President Trump’s spree of tariffs has incited many global leaders to respond in kind by imposing their own tariffs on US exports. But not all leaders have been pulled into the tit-for-tat game. Mexico and Brazil’s economies depend on trading relationships with the United States and their leaders have employed different strategies with which to respond to Trump’s tariffs.
Mexico
The United States is Mexico’s largest trading partner by far. Mexico was the second-largest destination for US exports and the top source of US imports. In 2024, Mexico exported an estimated USD505.9 billion: over 80% of total Mexican goods exports were to the United States and over 40% of total Mexican goods imports were from the United States.
Mexico’s largest exports to the United States include vehicles and automotive parts, followed by electrical equipment like computer data processing units, as well as medical instruments and fruits and vegetables. Given the relationship between the countries, Mexican President Claudia Sheinbaum has a crucial part to play to reduce impacts.
President Trump threatened Mexico with tariffs if there was no increase in effort to reduce fentanyl trafficking. Mexico responded by placing 10,000 troops at the border to reduce drug trafficking and illegal entry, but did not react with reciprocal tariffs, unlike China and Canada. We believe this has played well given that the United States has not implemented any additional tariffs, whereas other countries received a range of 10% to 49%.
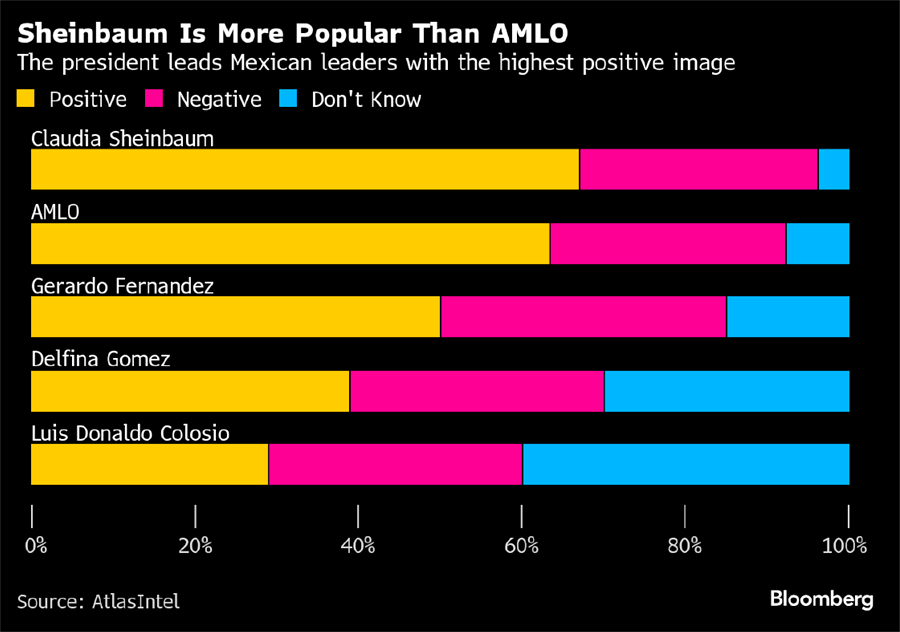
Sheinbaum is prioritizing a commercial relationship with the United States and Trump has adopted a warmer tone with Sheinbaum than with foreign leaders who have matched his confrontational style. This strategy has been received well not only by Trump, but by Mexico’s citizens – Sheinbaum’s popularity has surpassed that of previous Mexican leaders.
A company we like in Mexico is Bolsa Mexicana de Valores, S.A.B. de C.V. (BOLSAA MX). Bolsa is a Mexico-based stock exchange operator that functions as an integrated and organized market for equities, financial derivatives and OTC fixed-income instruments. It has access to custody, clearing and settlement of transactions and the sale of information.
The company generates over 50% of revenue through transaction fees. Bolsa should be seeing benefits, given the volatility of the market and the high volume of transactions as investors try to capitalize.
Brazil
The United States’ total goods traded with Brazil was an estimated USD92 billion in 2024, and imports from Brazil in 2024 totaled USD42.3 billion. Industrials comprised over three quarters of Brazilian exports to the United States. Key industrial products exported include crude oil, aircraft, coffee, cellulose and beef.
Brazilian President Luiz Inacio Lula da Silva (also known as “Lula”) has been in a tough spot. As the trade fight escalates between Brazil’s two largest trading partners, Lula does not want to have to choose between China or the United States. China has been Brazil’s largest trading partner for the last 15 years and this relationship has only grown.
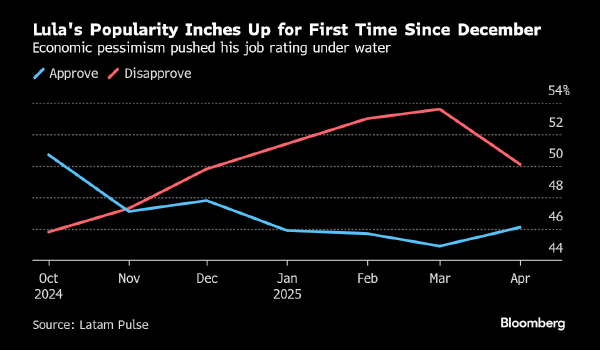
The United States has implemented just 10% tariffs on Brazil. Lula has not retaliated, which we believe has worked in his favour, and recent approval ratings reaffirm.
A company we like in Brazil is Vivara Participações S.A. (VIVA3 SA). Vivara is the largest jewelry player in Brazil. The company sells jewelry, watches and luxury accessories under two different brands: Vivara and Life.
Vivara has unparalleled scale, doubling their store footprint since 2018 with 265 Vivara and 180 Life stores representing 20% market share. The next four jewelry players represent a total of 6%, and the remaining smaller players represent 74%. Vivara has built all its production steps vertically, manufacturing ~80% of products sold. Vivara’s main production facility is in the Free Economic Zone of Manaus where it benefits from certain business tax incentives. The company currently trades at a P/E ratio of 7x which is half the multiple that its global luxury jewelry peers trade at.