Sparked by China’s rapid reopening, emerging market equities staged a sharp recovery from the lows of last October with the MSCI EM Index up nearly 23% (in USD terms) since the end of October, led by China which is up 54%.
The Institute of International Finance reported that January flows into EM equities and debt were the second strongest on record — the strongest being post-lifting of lockdowns in late 2020.
Buoyant sentiment in India is set to be tested with the collapse of Adani Group’s follow on public offer (FPO) after a report by U.S. short seller Hindenburg Research accusing the conglomerate of “brazen stock manipulation and accounting fraud over decades.”
The news drowned out positive press on the Indian federal government’s budget, with tax relief for India’s middle class expected to boost consumption, alongside a drive to slash regulations and improve the ease of doing business across the country.
The Bank of Korea is raising rates aggressively, pressuring equities and property markets. There is also added pressure from the downswing in the semiconductor cycle hitting DRAM giants Samsung Electronics and SK Hynix. Macro in Korea is a drag but longer-term the U.S. Inflation Reduction Act will provide a meaningful tailwind for the economy, particularly for those companies operating in the EV and renewables supply chains. There is also added pressure from the downswing in the semiconductor cycle hitting DRAM giants Samsung Electronics and SK Hynix but both are guiding for a H2 recovery and a strong 2024 outlook.
Similarly in Taiwan, there are signs that the semi cycle is bottoming. TSMC reported results with management expecting a H2 rebound in demand driven by increasing demand from data centres/hyperscale servers/AI applications, along with greater penetration in EVs.
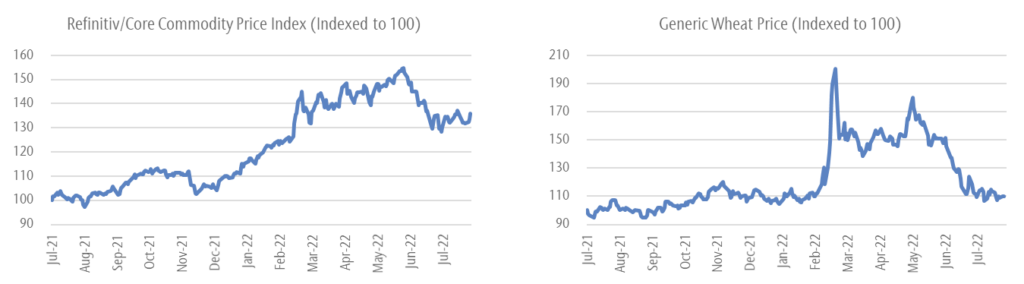
Money numbers in a number of major EM countries outside of Asia are picking up. In Brazil, inflation has fallen and there should soon be some scope for central bank easing (after pausing hikes at 13.75% last September). However, we are cautious of the impact of weakening commodities and political risk. In mid-January President Luiz Inácio Lula da Silva gave a TV interview where he stated that the formal independence of the central bank (enshrined into law in 2021) was “nonsense”. This was likely retaliation to comments from central bank governor Robert Neto that a spending boom by Lula’s government posed an inflationary risk. Tempering this political risk is a divided and right-leaning Brazilian Congress which should force Lula to moderate.
Can the EM bounce be sustained?
While 2022 was a painful year for EM equities (following a disappointing decade), the outlook is increasingly positive as a number of headwinds abate.
- Inflation – superior monetary policy and greater fiscal discipline in EM is the foundation for falling inflation, which opens the door to policy easing as the Federal Reserve approaches the end of its tightening cycle.
- Economic growth – global economic weakness remains a headwind. However, EM is forecast to outpace growth in the West, led by China reopening. GDP in EM economies is expected to grow by 3 ppts more than the rate in the U.S. over 2023 and 2024, versus even in 2022 (Morgan Stanley).
- Earnings momentum – the relative profitability gap between EM and DM is set to close, as companies benefit from the end of an extended deleveraging cycle and the recent period of global monetary tightening. On the other hand, profit margins in the U.S. sit at all-time record levels, a significant hurdle in the face of higher labour and other input costs.
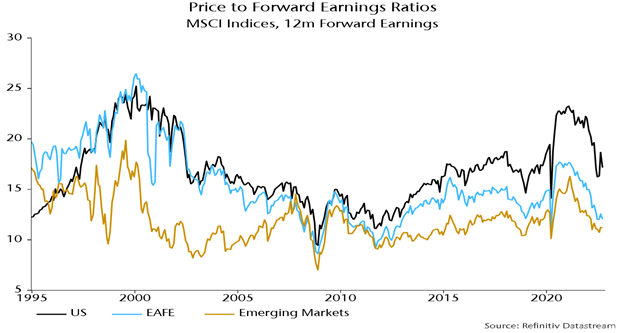
- Valuations – attractive relative to history and to DM, with positioning in EM equities among global allocators currently at depressed levels (Copley Fund Research).
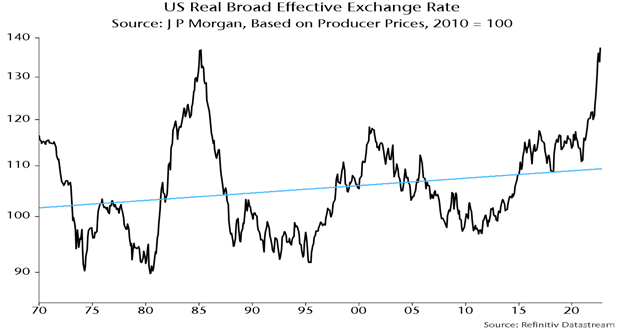
- Dollar – the dollar slumping into year-end 2022 was a tailwind for EM, but we are sceptical that the slide will continue at this rate in the near-term. Positive catalysts for a weaker dollar will include inflation continuing to fall, thereby increasing the odds of a Fed pause, and improving EM growth relative to DM.
China rally – is it time for a breather?
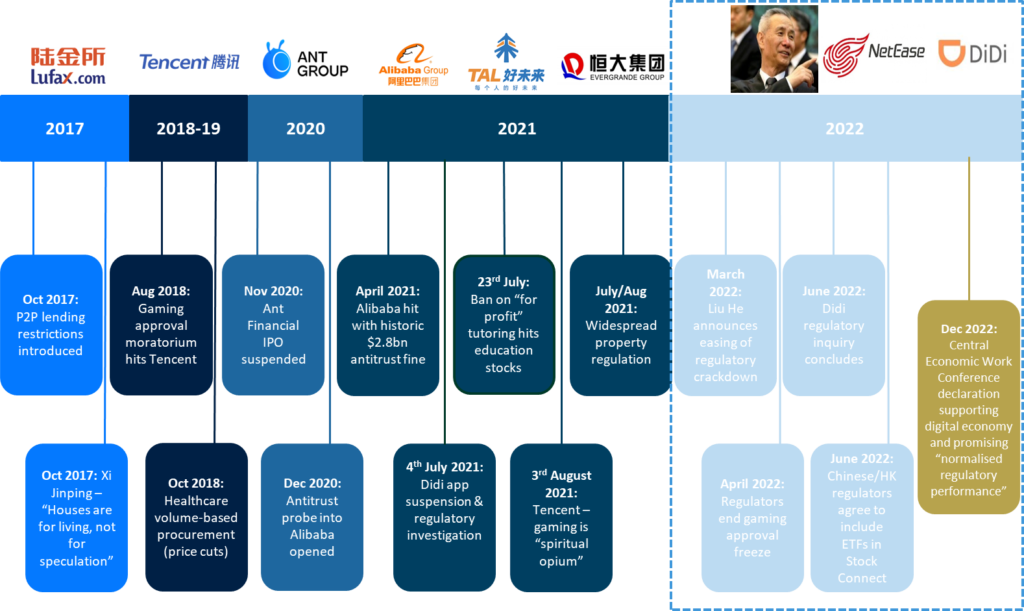
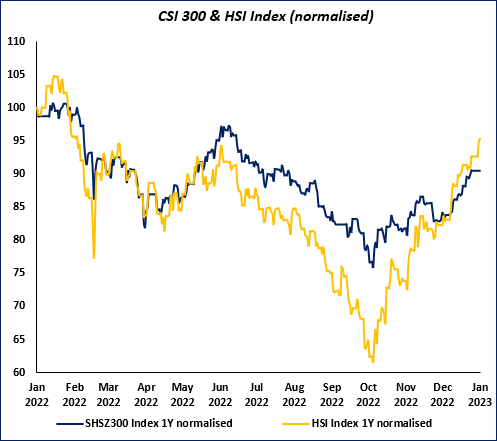
Chinese equities have run up a long away over the last two months following Xi’s pivot to more pragmatic policy on COVID, property, tech regulation and foreign relations. Abandoned by foreign investors earlier in 2022, H-shares rallied hard while A-shares lagged.
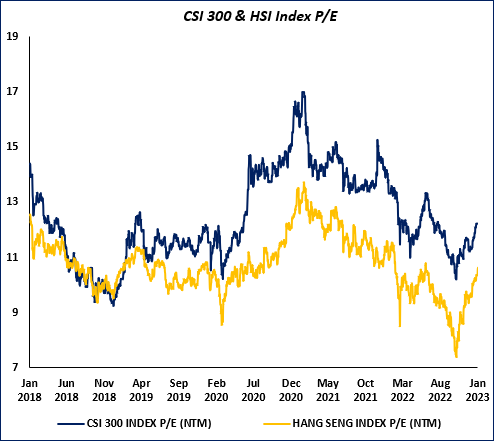
Valuations across Chinese equities remain supportive, although our view is that the “reopening trade” is now largely reflected in valuations. From here we see support for continued outperformance by Chinese stocks on an economic growth and corporate earnings recovery, along with positive money numbers. Consumption data over the Chinese New Year period were generally better than expected, with retail sales, passenger trip volumes, domestic tourism, box offices sales and restaurant sales up significantly and in many cases exceeding pre-COVID numbers.
That said, we do not expect a repeat of the reopening boom (in markets and the economy) that took place in the West when lockdowns ended. In the U.S. and Europe there were huge excess money balances and pent-up demand, to a far greater degree than what we currently see in China. On the latter, China was not subject to countrywide lockdowns, instead, harsh restrictions were applied on a regional basis to stamp out spikes in case numbers. In addition, the PBoC appears to be far less expansionary than Western counterparts, wary of setting off a wave of inflation as a result of pumping too much monetary stimulus. The weakness in the Chinese property market will also weigh on recovery as a negative wealth effect will hit consumer sentiment. Markets will be watching for additional government support to quash lingering structural risks in the sector.
Adani to test “India Inc.”
U.S. short-seller Hindenburg released a damaging short report claiming that giant Indian conglomerate Adani Group (with businesses across healthcare, energy, food and infrastructure) has been involved in “brazen stock manipulation and accounting fraud over decades.” The report argues that the group operated an elaborate web of shell companies across numerous tax havens, which were used as instruments to inflate Adani stock which in turn would be pledged as collateral for loans and thus placed the group on a “precarious financial footing”.
Hindenburg alleges the fraud enabled founder and Chairman Gautam Adani – who rose to prominence in Gujarat at the same time Prime Minister Narendra Modi was the state’s chief minister – to amass a personal fortune of over US$120 billion. Much of the wealth is owing to an 800% appreciation in stock prices across the Group’s seven listed companies over the last three years.
The release of the short report and subsequent collapse of Adani Enterprises’ stock has scuttled plans to raise over US$2 billion via a follow on public offer. Attention now turns to the Modi government and the Securities and Exchange Board of India to investigate any wrongdoing. Given both the close ties between Modi and Gautam Adani, and a business that lies at the heart of India’s economy, this will be an important test of institutional credibility.
We have written to clients extensively on India’s steady progress up the development ladder and opportunity this presents to investors. How authorities deal with this situation will provide an indicator of this progress – they will have to catch up to the local investment industry which has viewed Adani with suspicion for years. Hindenburg notes in its report that despite the Adani Group’s size, there is a dearth of reputable sell-side coverage on the companies, and no local active funds willing to hold these stocks in any meaningful size. We will watch on with interest to see how the government and the SEBI engage with the accusations – and hope for a tough response should they hold water.
We are sanguine with respect to the potential for systemic fallout in India should Adani collapse. India’s state banks would bear the brunt, however, it is likely that the viability of projects tied to Adani loans should cushion the blow. Indeed, should the market narrative around India’s rise lose some sheen in the coming months, we may see some emerging opportunities to add exposure to some names that we believe are long-term winners.