The most important issue in the global economic outlook is the meaning of Chinese monetary weakness.

Six-month rates of change of narrow / broad money, bank lending and total social financing (on both new and old definitions*) reached record lows in June / July – see chart 1.

Chart 1

20240816_NSP_MMM_C1_ChinaNominalGDPMoneySocialFinancing

Monetary weakness has been entirely focused on the corporate sector: M2 deposits of non-financial enterprises plunged 6.6% (13.6% annualised) in the six months to July (own seasonal adjustment) – chart 2.

Chart 2

20240816_NSP_MMM_C2_ChinaM2exBreakdown

Recent regulatory changes appear to account for only a small portion of the corporate broad money decline.

A clampdown on banks paying interest above regulatory ceilings has resulted in a shift out of demand deposits but money has largely stayed in the banking system – available data suggest modest inflows to wealth management products and other non-monetary assets.

The clampdown has also discouraged the practice of “fund idling” (round-tripping in UK monetary parlance), whereby banks offered loans to corporate borrowers to meet official lending targets, with borrowers incentivised to hold the funds on deposit.

If an unwinding of such activity accounted for the decline in corporate money, however, short-term bank lending to corporations would be expected to show equivalent weakness. Such lending has continued to grow, albeit at a slower pace recently, as have longer-term loans.

A trend decline in the ratio of corporate M2 deposits to bank borrowing, therefore, has accelerated – chart 3.

Chart 3

20240816_NSP_MMM_C3_ChinaCorporateLiquidityRatio

Household money holdings, by contrast, have been growing solidly – chart 2. An alternative explanation for the corporate money decline is simply that households are still hunkering down as the property crisis deepens, with weakening demand for consumer goods / services and housing transferring income and liquidity from the corporate sector.

The latest PBoC and NBS consumer surveys confirm rock-bottom sentiment – chart 4. If this explanation is correct, corporate money weakness may presage a collapse in profits – chart 5.

Chart 4

20240816_NSP_MMM_C4_ChinaConsumerConfidenceMeasures

Chart 5

20240816_NSP_MMM_C5_ChinaINdustrialProfitsM2DepositsNonFinancialEnterprises

Why hasn’t the PBoC hit the panic button? Policy easing has been constrained by currency weakness: the most comprehensive measure of f/x intervention (h/t Brad Setser) reached $58 billion in July, the highest since 2016 – chart 6. The recent yen rally has offered some relief, reflected in a narrower offshore forward discount, but the authorities may be concerned that this will prove temporary.

Chart 6

20240816_NSP_MMM_C6_ChinaNetFxSettlementBanksAdjustedForwards

The strange policy of trying to push longer-term yields higher against a recessionary / deflationary backdrop may represent an attempt to support the currency, rather than being motivated primarily by concern about financial risks. To the extent that the policy results in banks selling bonds, however, the result will be to exacerbate monetary weakness and economic woes.

*The previous definition excludes government bonds so is a measure of credit expansion to the “real economy”.

A sharp fall in the global manufacturing PMI new orders index in July confirms renewed industrial weakness. The companion services survey, however, reported an uptick in the new business component, which is close to its post-GFC average. Will services resilience sustain respectable overall growth?

The understanding here is that economic fluctuations originate in the goods sector, reflecting cycles in three components of investment – stockbuilding, business fixed capex and housing. Multiplier effects transmit these fluctuations to the services sector – there is no independent services cycle.

The manufacturing new orders and services new business indices have been strongly correlated historically, with Granger-causality tests indicating that the former leads the latter but not vice versa*.

Several considerations suggest that the recent divergence will be resolved by the services new business index moving lower:

1. The services future output index correlates with new business and fell to an eight-month low in July – see chart 1.

Chart 1

20240808_NSP_MMM_C1_GlobalServicesPMINewBusinessFutureOutput

2. Recent new business readings have been inflated by strength in financial services – chart 2. Financial services new business correlates with stock market movements, suggesting weakness ahead.

Chart 2

20240808_NSP_MMM_C2_GlobalServicesPMINewBusiness

3. Consumer services new business correlates with the manufacturing consumer goods new orders index, which fell below 50 in July – chart 3.

Chart 3

20240808_NSP_MMM_C3_GlobalConsumerGoods

Output price indices for consumer goods and services support the optimism here about inflation prospects through mid-2025. A weighted average has fallen back to its October 2009-December 2019 average, a period in which G7 annual CPI inflation excluding food / energy averaged 1.5% – chart 4.

Chart 4

20240808_NSP_MMM_C4_GlobalConsumerPrices

*Contemporaneous correlation coefficient since 1998 = +0.84. Granger-causality tests included six lags. Manufacturing terms were significant in the services equation but not vice versa.

Monetary analysis suggests that the global economy will weaken into early 2025, while inflation will continue to decline. A cyclical forecasting framework, on the other hand, points to the possibility of strong economic growth in H2 2025 and 2026.

Are the two perspectives inconsistent? A reconciliation could involve downside economic and inflation surprises in H2 2024 triggering a dramatic escalation of monetary policy easing. A subsequent pick-up in money growth would lay the foundation for a H2 2025 / 2026 economic boom.

How would equities perform in this scenario? Bulls would argue that any near-term weakness due to negative economic news would be swiftly reversed as policies eased and markets shifted focus to the sunlit uplands of H2 2025 / 2026.

More likely, a significant fall in risk asset prices would be necessary to generate easing of the required speed and scale, and a subsequent recovery might take time to gather pace.

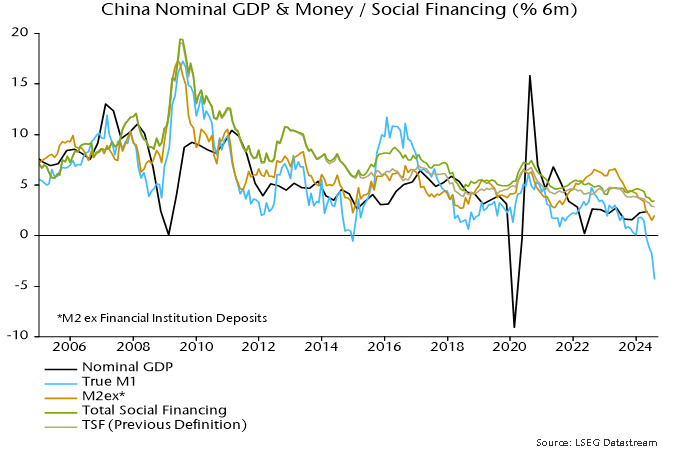
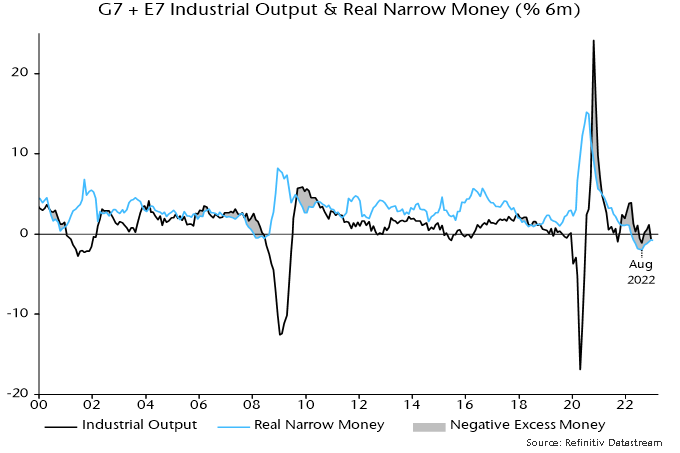
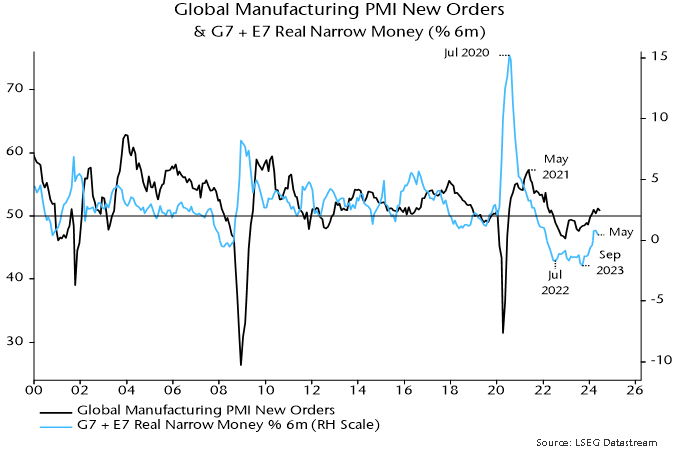
Global six-month real narrow money momentum has recovered from a major low in September 2023 but remains weak by historical standards and fell back in May – see chart 1. The assessment here is that the decline into the 2023 low will be reflected in a weakening of global economic momentum in H2 2024.

Chart 1

20240704_NSP_MMM_C1_GlobalManufacturingPMINewOrders

A counter-argument is that a typical lead-time between lows in real money and economic momentum historically has been six to 12 months. On this basis, negative fall-out from the September 2023 real money momentum low should be reaching a maximum now, with the subsequent recovery to be reflected in economic acceleration in late 2024.

The latter interpretation is consistent with the consensus view that a sustainable economic upswing is under way and will gather pace as inflation progress allows gradual monetary policy easing.

The pessimistic view here reflects three main considerations. First, economic acceleration now would imply an absence of any negative counterpart to the September 2023 real money momentum low – historically very unusual.

Secondly, the lag between money and the economy has recently been at the top end of the historical range, suggesting that a significant portion of 2023 monetary weakness has yet to feed through.

Highs in real money momentum in August 2016 and July 2020 preceded highs in global manufacturing PMI new orders by 16 and 10 months respectively, while a low in May 2018 occurred a year before a corresponding PMI trough – chart 2.

Chart 2

20240704_NSP_MMM_C2_GlobalManufacturingPMINewOrdersPaired

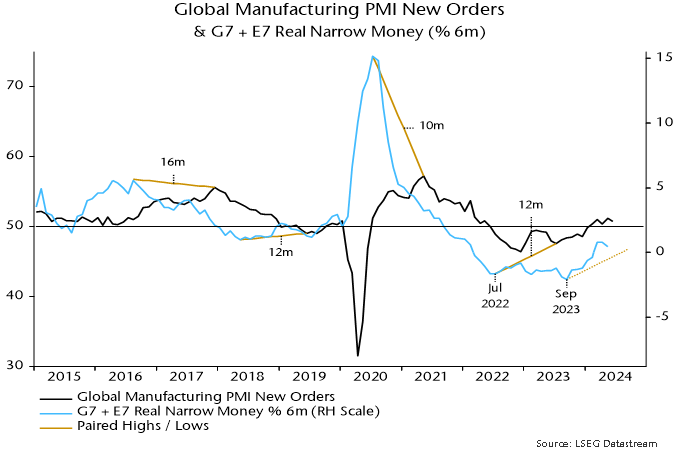
So a PMI low associated with the September 2023 real money momentum trough could occur as late as January 2025.

Thirdly, stock as well as flow considerations have been important for analysing the impact of money on the economy in recent years, and a current shortfall of real narrow money from its pre-pandemic trend may counteract a positive influence from the (tepid) recovery in momentum since September 2023 – chart 3.

Chart 3

20240704_NSP_MMM_C3_RatioOfG7E7RealNarrowMoneyToIndustrialOutput

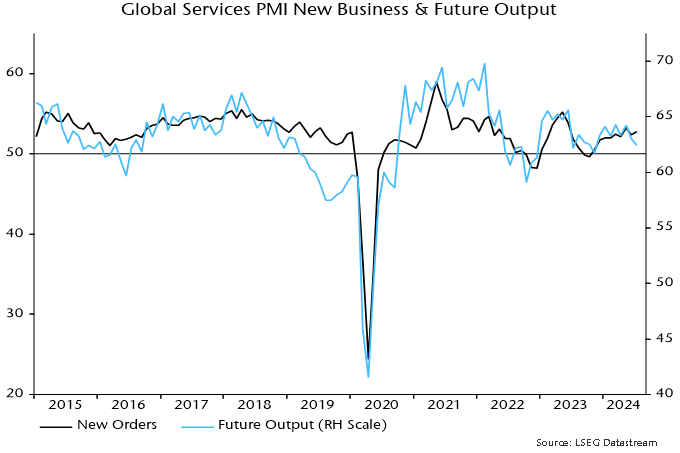
The decline in real money momentum into the September 2023 low began from a minor peak in December 2022, suggesting that the PMI – even allowing for a longer-than-normal lag – should have peaked by early 2024. Global manufacturing PMI new orders rose into March and made a marginal new high in May. However, two indicators displaying a significant contemporaneous correlation with PMI new orders historically – PMI future output and US ISM new orders – peaked in January. The future output series fell sharply in June, consistent with the view that another PMI downturn is starting – chart 4.

Chart 4

20240704_NSP_MMM_C4_GlobalManufacturingPMI

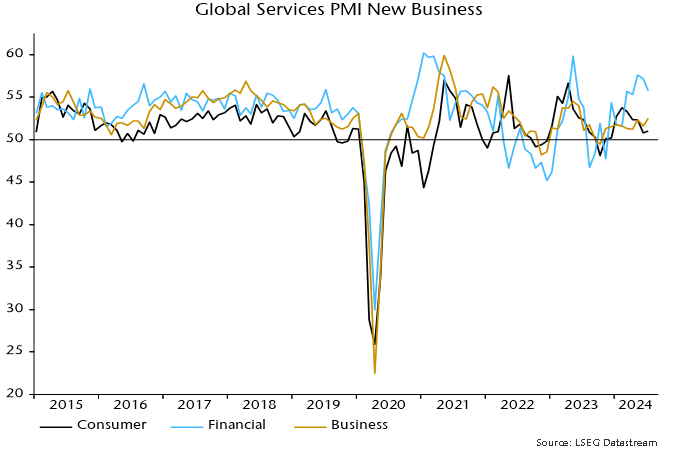
Signs of weakness are also apparent under the hood of the services PMI survey. Overall new business has been boosted by financial sector strength, reflecting buoyant markets, but the consumer services component fell to a six-month low in June – chart 5.

Chart 5

20240704_NSP_MMM_C5_GlobalServicesPMINewBusiness

Could a weakening of economic momentum in H2 2024 snowball into a deep / prolonged recession? The cycles element of the forecasting process used here suggests not.

Severe / sustained recessions occur when the three investment cycles – stockbuilding, business capex and housing – move into lows simultaneously. The most recent troughs in the three cycles are judged to have occurred in Q1 2023, 2020 and 2009 respectively. Allowing for their usual lengths (3-5, 7-11 and 15-25 years), the next feasible window for simultaneous lows is 2027-28 – chart 6. Cycle influences should be positive until then.

Chart 6

20240704_NSP_MMM_C6_ActualPossibleCycleTroughYears

Major busts associated with triple-cycle lows, indeed, are usually preceded by economic booms. Such booms often involve policy shifts that super-charge positive cyclical forces. The 1987 stock market crash, for example, triggered rate cuts by the Fed and other central banks that magnified a late 1980s housing cycle peak.

Could significant policy easing in H2 2024 / H1 2025 similarly catalyse a H2 2025 / 2026 boom? Such a policy shift, on the view here, is plausible because negative economic news into early 2025 is likely to be accompanied a melting of inflation concerns.

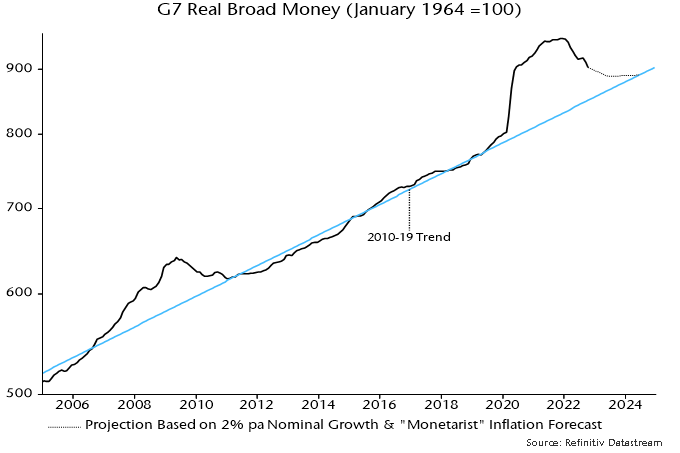
The latter suggestion is based on the monetarist rule-of-thumb that inflation follows money trends with a roughly two-year lag. G7 broad money growth of about 4.5% pa is consistent with 2% inflation. Annual growth returned to this level in mid-2022, reflected in a forecast here that inflation rates would move back to target in H2 2024 – chart 7.

Chart 7

20240704_NSP_MMM_C7_G7ConsumerPricesBroadMoney

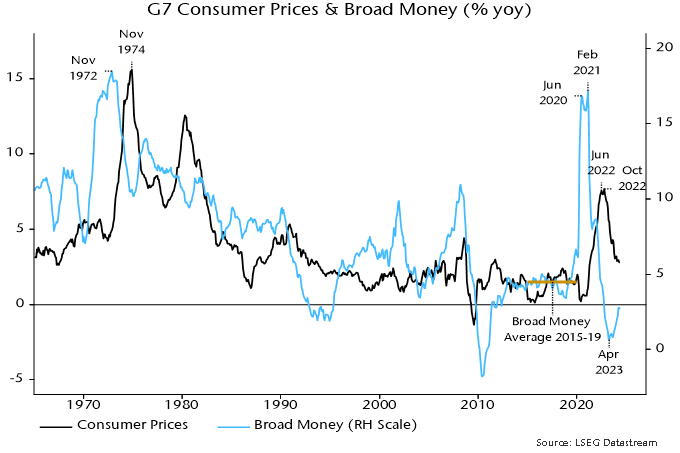
The forecast is within reach. Annual US PCE and Eurozone CPI inflation rates were 2.5% in May and June respectively, with a fall to 2% in prospect by end-Q3 on reasonable assumptions for monthly index changes. UK CPI inflation has already dropped to 2.0%.

G7 annual broad money growth continued to decline into 2023, reaching a low of 0.6% in April 2023 and recovering gradually to 2.7% in May 2024. The suggestion from the monetarist rule, therefore, is that inflation rates will move below target in H1 2025 and remain low into 2026.

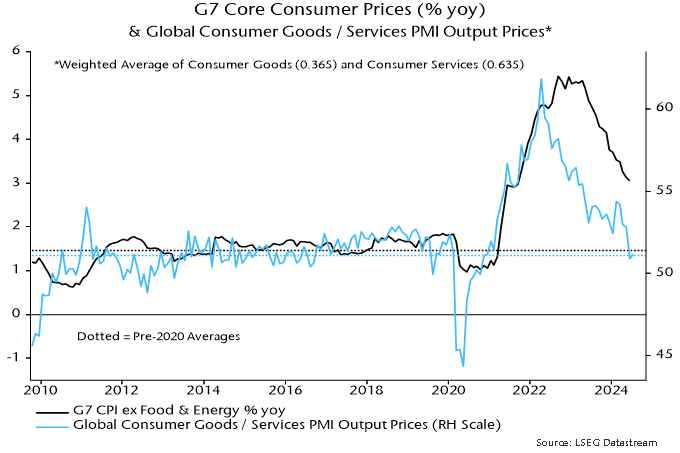
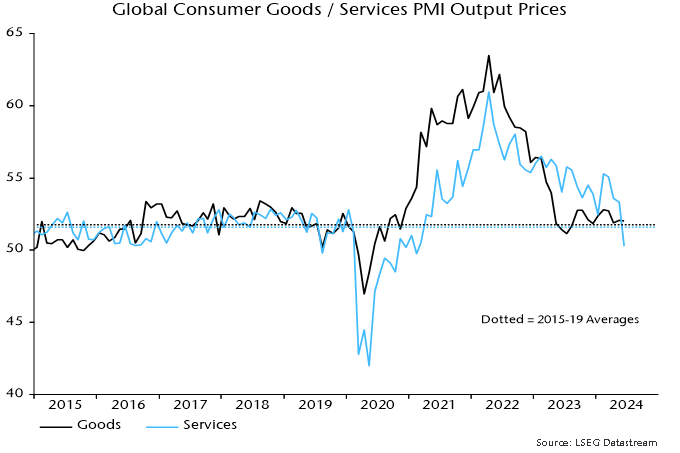
Central banks have been focusing on stickier services inflation, neglecting historical evidence that services prices lag both food / energy costs and core goods prices. Those relationships, and easing wage pressures, suggest that services resilience is about to crumble, a possibility supported by a sharp drop in the global consumer services PMI output price index in June to below its pre-pandemic average – chart 8.

Chart 8

20240704_NSP_MMM_C8_GlobalConsumerGoodsServicesPMIOutputPrices

The approach here uses two flow measures of global “excess” money to assess the monetary backdrop for equity markets: the gap between global six-month real narrow money and industrial output momentum, and the deviation of annual real money growth from a long-term moving average.

The two measures turned negative around end-2021, ahead of 2022 market weakness, but remained sub-zero as global indices rallied to new highs in H1 2024. The latter “miss” may be attributable to a money stock overshoot shown in chart 3 – the flow measures of excess money may have failed to capture the deployment of existing precautionary money holdings.

Still, the MSCI World index in US dollars outperformed dollar deposits by only 3.9% between end-2021 and end-June 2024, with the gain dependent on a small number of US mega-caps: the equal-weighted version of the index underperformed deposits by 8.4% over the same period.

What now? The money stock overshoot has reversed. The first excess money measure has recovered to zero but the second remains significantly negative. Mixed readings have been associated with equities underperforming deposits on average historically, with some examples of significant losses. Caution still appears warranted.

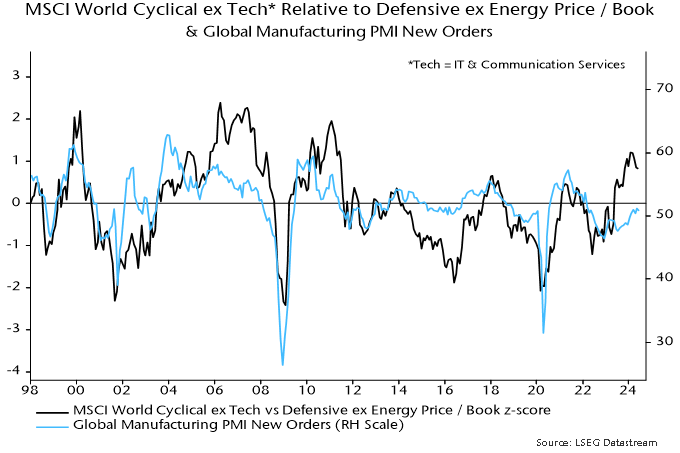
An obvious suggestion based on the economic scenario described above is to overweight defensive sectors. Non-tech cyclical sectors gave back some of their outperformance in Q2 but are still relatively expensive by historical standards, apparently discounting PMI strength – chart 9.

Chart 9

20240704_NSP_MMM_C9_MSCIWorldCyclicalExTech

Accelerated monetary policy easing could be favourable for EM equities, especially if associated with a weaker US dollar. Monetary indicators are promising. EM equities have outperformed historically when real narrow money growth has been higher in the E7 than the G7 and the first global excess money measure has been positive – chart 10. The former condition remains in place and the second is borderline.

Chart 10

20240704_NSP_MMM_C10_MSCIEMCumulativeReturnVsMSCIWorld

Image of office skyscrapers with reflections in the sunlight

Fonds Connor, Clark & Lunn Inc. (Fonds CC&L) est heureuse d’annoncer deux portefeuilles axés sur le rendement absolu sous forme de fonds alternatifs liquides, soit le Fonds mondial neutre au marché CC&L II et le Fonds d’actions mondiales longues/courtes CC&L (les Fonds).

Le Fonds mondial neutre au marché CC&L II cherche à obtenir un rendement positif et intéressant à long terme après correction du risque, présentant une faible corrélation avec les marchés boursiers traditionnels, et moins volatil que ces derniers. Cote de risque : Faible à moyenne.

Le Fonds d’actions mondiales longues/courtes CC&L vise à procurer une plus-value du capital à long terme et des rendements corrigés du risque intéressants en investissant activement dans un portefeuille de titres à court et à long terme. Cote de risque : Moyenne.

Pour gérer les Fonds, Fonds CC&L a retenu les services de Gestion de placements Connor, Clark & Lunn Ltée (Gestion de placements CC&L), établie à Vancouver; cette entité est l’une des plus importantes sociétés de gestion de placements privées au Canada, avec près de 20 ans d’expérience dans la gestion de stratégies de placement non traditionnelles pour les investisseurs institutionnels.

« Nos clients nous ont dit qu’ils veulent avoir accès à des placements non traditionnels de calibre institutionnel, gérés par une équipe qui a un historique de bons résultats, dans le but d’obtenir un fonds alternatif liquide. En lançant ces deux nouveaux portefeuilles, nous atteignons ces objectifs et offrons aux conseillers en placement et à leurs clients deux profils de risque et de rendement intéressants parmi lesquels choisir », a déclaré Tim Elliott, président et chef de la direction de Fonds CC&L.

« Nous sommes ravis que ces solutions de placement non traditionnelles soient offertes à un plus grand nombre d’investisseurs canadiens. Comme nous sommes passés à un contexte caractérisé par des taux d’intérêt et une inflation structurellement plus élevés, nous nous attendons à ce que les cycles de marché soient plus courts, que la volatilité soit plus élevée et que les rendements des actifs risqués conventionnels soient plus faibles. Dans un tel contexte, nous croyons qu’il deviendra plus important pour les investisseurs d’intégrer des sources de rendement indépendantes des marchés boursiers et obligataires afin d’améliorer les résultats du portefeuille », a déclaré Martin Gerber, président et chef des placements à Gestion de placements CC&L.

Fonds CC&L et Gestion de placements CC&L sont des sociétés affiliées du Groupe financier Connor, Clark and Lunn (CC&L), dont la structure à multiples sociétés affiliées réunit les talents d’équipes de placement diversifiées qui offrent une vaste gamme de solutions de placement traditionnelles et non traditionnelles. CC&L est l’un des plus importants gestionnaires de placements indépendants au Canada; il gère plus de 104 milliards de dollars d’actifs pour le compte d’investisseurs institutionnels et particuliers.

À propos des fonds

Offerts en parts de série A et de série F, les fonds sont conformes au cadre réglementaire des fonds communs de placement non traditionnels offerts par prospectus simplifiés. Les parts des fonds sont vendues par l’intermédiaire de courtiers en placement titulaires d’un permis; leur prix est évalué quotidiennement et elles pourront être rachetées quotidiennement. Le fonds est offert au moyen de FundServ.

À propos de Fonds Connor, Clark & Lunn Inc.

Fonds Connor, Clark & Lunn Inc. (les Fonds CC&L) noue des partenariats avec des institutions financières canadiennes de premier plan et leurs conseillers en placement afin d’offrir des stratégies de placements institutionnelles uniques à des investisseurs particuliers, grâce à une gamme de fonds, de placements alternatifs liquides et de comptes en gestion distincte choisis avec soin.

En limitant sa gamme à un groupe de solutions de placement en particulier, Fonds CC&L est en mesure d’offrir des stratégies uniques conçues pour améliorer les portefeuilles traditionnels des investisseurs. Pour obtenir des précisions, consultez le site cclfundsinc.com.

À propos de Gestion de placements Connor, Clark & Lunn Ltée

Gestion de placements Connor, Clark & Lunn Ltée (Gestion de placements CC&L) est l’une des plus importantes sociétés de gestion de placements indépendantes au Canada (elle appartient à ses associés) et gère un actif de 54,2 milliards de dollars. Fondée en 1982, elle propose une gamme diversifiée de solutions de placements traditionnels (actions, titres à revenu fixe et placements équilibrés) et non traditionnels (stratégies neutres au marché, à alpha portable et à rendement absolu).

CC&L fait partie du Groupe financier Connor, Clark & Lunn (Groupe financier CC&L), une société de gestion d’actifs dotée d’une structure multientreprise, dont les sociétés affiliées gèrent collectivement un actif financier de plus de 104 milliards de dollars. Pour de plus amples renseignements, consultez le site cclinvest.com.

À propos du Groupe financier Connor, Clark & Lunn Ltée.

Le Groupe financier Connor, Clark & Lunn Ltée (Groupe financier CC&L) est une société de gestion d’actifs indépendante à multiples sociétés affiliées qui offre une vaste gamme de solutions de gestion de placements traditionnelles et non traditionnelles aux investisseurs institutionnels et individuels. Le Groupe financier CC&L procure une envergure et une expertise considérables qui permettent d’assumer des fonctions administratives qui ne sont pas liées aux placements tout en laissant les gestionnaires de placement se concentrer sur ce qu’ils font le mieux grâce à la centralisation des activités liées aux opérations et à la distribution. Les sociétés affiliées du Groupe financier CC&L gèrent un actif de plus de 104 milliards de dollars. Pour obtenir des précisions, consultez le site cclgroup.com.

Personne-ressource

Lisa Wilson
Directrice, Produits et service à la clientèle
Fonds Connor, Clark & Lunn Inc.
416 864-3120
[email protected]

Downtown skyline of Toronto Canada at twilight.

Fonds Connor, Clark & Lunn inc., le gestionnaire du Fonds de rendement absolu II PCJ (le « Fonds ») est heureux d’annoncer un changement aux modalités de liquidité du Fonds.

À partir de maintenant, les ordres d’achat, de vente et de substitution du Fonds ne seront plus hebdomadaires à 16 h, heure de l’Est, le vendredi, mais quotidiens à 15 h, heure de l’Est, chaque jour ouvrable ou avant la fermeture de la Bourse de Toronto (TSX) pour la journée, selon la première éventualité, et tous les ordres seront traités en fonction de la valeur liquidative calculée ce jour-là. Les ordres reçus après 15 h, heure de l’Est, seront traités le jour ouvrable suivant en fonction de la valeur liquidative de ce jour-là.

À propos de Fonds Connor, Clark & Lunn Inc.

Fonds Connor, Clark & Lunn Inc. (les Fonds CC&L) noue des partenariats avec des institutions financières canadiennes de premier plan et leurs conseillers en placement afin d’offrir des stratégies de placements institutionnelles uniques à des investisseurs particuliers, grâce à une gamme de fonds, de placements alternatifs liquides et de comptes en gestion distincte choisis avec soin.

En limitant sa gamme à un groupe de solutions de placement en particulier, Fonds CC&L est en mesure d’offrir des stratégies uniques conçues pour améliorer les portefeuilles traditionnels des investisseurs. Pour obtenir des précisions, consultez le site cclfundsinc.com.

Renseignements prospectifs

Le présent communiqué peut contenir des renseignements prospectifs (au sens des lois sur les valeurs mobilières applicables) à l’égard des activités du gestionnaire et du Fonds (les « énoncés prospectifs »). Ces énoncés prospectifs se reconnaissent par des mots comme « croire », « anticiper », « projeter », « s’attendre à », « avoir l’intention de », « planifier », « pourrait », « estimer » et d’autres expressions semblables. Les énoncés prospectifs contenus dans le présent communiqué sont fondés sur certaines hypothèses; ils ne sont pas garants du rendement futur et comportent des risques et des incertitudes difficiles à contrôler ou à prévoir. Un certain nombre de facteurs pourraient faire en sorte que les résultats réels diffèrent considérablement des résultats présentés dans les énoncés prospectifs, y compris, mais sans s’y limiter, les facteurs énumérés à la rubrique « Qu’est-ce qu’un organisme de placement collectif et quels sont les risques associés à un placement dans un tel organisme? » dans le prospectus simplifié disponible sur le profil SEDAR du Fonds au www.sedar.com. Rien ne garantit que les énoncés prospectifs se révéleront exacts, car les rendements et les résultats réels peuvent considérablement différer de ceux qui y sont exprimés. En conséquence, les lecteurs ne devraient pas se fier indûment à de tels énoncés prospectifs. De plus, ces énoncés prospectifs sont faits en date du présent communiqué et, sauf si la loi applicable l’exige expressément, le gestionnaire et le Fonds ne s’engagent aucunement à mettre à jour ou à réviser tout énoncé prospectif public, que ce soit à la suite de l’obtention de nouveaux renseignements, d’événements futurs ou autres.

Personne-ressource

Lisa Wilson
Directrice, Produits et service à la clientèle
Fonds Connor, Clark & Lunn Inc.
416-864-3120
[email protected]

Luminated office buildings at Canary Wharf, London at night.

Fonds Connor, Clark & Lunn inc. (Fonds CC&L) est heureux d’annoncer le récent lancement d’une version admissible au prospectus du portefeuille concentré d’actions internationales NS Partners, qui est maintenant offert aux investisseurs canadiens. Le Fonds concentré d’actions internationales NS Partners est fondé sur un portefeuille semblable, auparavant offert uniquement aux investisseurs institutionnels et internes.

Le Fonds cherche à procurer aux investisseurs une plus-value du capital à long terme en investissant dans un portefeuille composé principalement d’actions autres que nord-américaines, dont jusqu’à 20 % dans les marchés émergents.

Pour gérer le fonds, Fonds CC&L a retenu les services de NS Partners Ltd (NS Partners), un gestionnaire établi à Londres, au Royaume-Uni, qui compte plus de 30 ans d’expérience dans la gestion de portefeuilles d’actions internationales, y compris des marchés développés et émergents. NS Partners combine un cadre ascendant de qualité et de croissance pour examiner les sociétés au moyen d’une analyse descendante unique de la liquidité à l’échelle mondiale afin de repérer les régions, les pays et les secteurs qui devraient enregistrer des rendements supérieurs ou inférieurs, ainsi que pour déterminer s’il y a lieu de positionner le portefeuille en fonction d’un appétit ou d’une aversion pour le risque.

« Pour les investisseurs dans des portefeuilles d’actions mondiales à grande capitalisation, il existe des arguments convaincants en faveur d’une pondération distincte des actions internationales, compte tenu des problèmes de valorisation et de concentration sur le marché des actions américaines à grande capitalisation et des difficultés liées à la vigueur du dollar américain. En présentant notre portefeuille concentré d’actions internationales de NS Partners sous forme de fonds, nous pouvons offrir une solution attrayante aux investisseurs individuels, gérée par une équipe de placement de calibre institutionnel qui a fait ses preuves et qui adopte une approche différenciée », a déclaré Tim Elliott, président et chef de la direction de Fonds CC&L.

« Nous sommes ravis que notre portefeuille concentré d’actions internationales soit accessible à un plus grand nombre d’investisseurs canadiens. Grâce à notre processus éprouvé, à notre solide feuille de route en matière de placements institutionnels et à notre équipe de placement talentueuse et dévouée, nous croyons que ce portefeuille offrira une solution intéressante aux personnes qui cherchent une croissance à long terme sur les marchés boursiers internationaux. » a déclaré Tim Bray, président et chef des placements de NS Partners.

Fonds CC&L et NS Partners sont des sociétés affiliées du Groupe financier Connor, Clark and Lunn (« CC&L »), dont la structure à multiples sociétés affiliées réunit les talents d’équipes de placement diversifiées qui offrent une vaste gamme de solutions de placement traditionnelles et non traditionnelles. CC&L est l’un des plus importants gestionnaires de placements indépendants au Canada; il gère plus de 104 milliards de dollars d’actifs pour le compte d’investisseurs institutionnels et particuliers.

À propos du fonds

Offert en parts de série A et de série F, le fonds est conforme au cadre réglementaire des fonds communs de placement conventionnels offerts par prospectus simplifié. Les parts du fonds seront vendues par l’intermédiaire de courtiers en placement titulaires d’un permis; leur prix est évalué quotidiennement et elles pourront être rachetées quotidiennement. Le fonds est offert au moyen de FundServ.

À propos de Fonds Connor, Clark & Lunn Inc.

Fonds Connor, Clark & Lunn Inc. (les Fonds CC&L) noue des partenariats avec des institutions financières canadiennes de premier plan et leurs conseillers en placement afin d’offrir des stratégies de placements institutionnelles uniques à des investisseurs particuliers, grâce à une gamme de fonds, de placements alternatifs liquides et de comptes en gestion distincte choisis avec soin.

En limitant sa gamme à un groupe de solutions de placement en particulier, Fonds CC&L est en mesure d’offrir des stratégies uniques conçues pour améliorer les portefeuilles traditionnels des investisseurs. Pour de plus amples renseignements, consultez le site www.cclfundsinc.com.

À propos de NS Partners Ltd

NS Partners Ltd est une société de gestion de placements indépendante qui se spécialise dans la gestion active de portefeuilles d’actions mondiales pour le compte de grandes entreprises, de caisses de retraite, de fondations, de fonds de dotation et de fonds souverains. NS Partners Ltd est membre du Groupe financier Connor, Clark & Lunn, une société de gestion de placements dotée d’une structure multientreprise. Pour obtenir de plus amples renseignements, consultez le site www.ns-partners.co.uk.

À propos du Groupe financier Connor, Clark & Lunn Ltée.

Le Groupe financier Connor, Clark & Lunn Ltée (Groupe financier CC&L) est une société de gestion d’actifs indépendante à multiples sociétés affiliées qui offre une vaste gamme de solutions de gestion de placements traditionnelles et non traditionnelles aux investisseurs institutionnels et individuels. Le Groupe financier CC&L procure une envergure et une expertise considérables qui permettent d’assumer des fonctions administratives qui ne sont pas liées aux placements tout en laissant les gestionnaires de placement se concentrer sur ce qu’ils font le mieux grâce à la centralisation des activités liées aux opérations et à la distribution. Les sociétés affiliées du Groupe financier CC&L gèrent un actif de plus de 104 milliards de dollars. Pour obtenir de plus amples renseignements, consultez le site www.cclgroup.com.

Personne-ressource

Lisa Wilson
Directrice, Produits et service à la clientèle
Fonds Connor, Clark & Lunn Inc.
416-864-3120
[email protected]

The two measures of global “excess” money tracked here remain negative, arguing for a cautious view of equity market prospects. 

Excess (or deficient) money refers to the difference between the actual money stock and the demand for money to support economic transactions. According to “monetarist” theory, a surplus is associated with increased demand for financial / real assets and upward pressure on their prices, assuming no change in supply. 

Excess money is unobservable so two proxies are followed here: the difference between six-month rates of change of global (i.e. G7 plus E7) real narrow money and industrial output; and the deviation of 12-month real narrow money growth from a slow moving average. 

Historically (i.e. over 1970-2021), global equities outperformed US dollar cash on average only when both measures were positive. Unsurprisingly, average performance was worst when both were negative (underperformance of 8.9% pa). These results allow for reporting lags in monetary / economic data. 

The second measure turned negative in October 2021, which was known by end-November. The first measure followed in November, which was known by end-January 2022 (a longer lag because industrial output numbers are released after monetary / CPI data). 

Previous posts noted a recovery in global six-month real narrow money momentum during H2 2022*. With industrial output expected to weaken, it was suggested that the first measure would turn positive, possibly by December. 

The second measure – based on 12- rather than six-month real money momentum – was deeply negative in late 2022, with a switch to positive deemed unlikely before mid-2023. 

The suggested switch positive in the first measure has yet to occur. The six-month rate of change of industrial output crossed below zero in December but remained just above real narrow money momentum – see chart 1. 

Chart 1

Chart 1 showing G7 + E7 Industrial Output & Real Narrow Money (% 6m) highlighting August 2022

Will a cross-over have occurred in January? Partial data suggest that the recovery in real money momentum stalled last month. A reliable January estimate of industrial output won’t be available until mid-March. A reopening bounce in China could offset weakness elsewhere. 

A further point is that the recovery in global real narrow money momentum since mid-2022 partly reflected a strong pick-up in Russia, which may be of limited global relevance given the country’s enforced economic and financial isolation. 

Chart 2 shows the result of replacing Russia with Indonesia in the G7 plus E7 real money calculation from January 2022, before the February invasion of Ukraine**. The trough in real money momentum is placed in October rather than August, with the subsequent recovery even more anaemic. 

Chart 2

Chart 2 showing G7 + E7 Industrial Output & Real Narrow Money (% 6m) highlighting October 2022

*The trough in real money momentum originally occurred in June but is now placed in August, partly reflecting revisions to US CPI seasonal adjustments.

**The other E7 countries (as defined here) are Brazil, China, India, Korea, Mexico and Taiwan.

Gas price relief and Chinese reopening have tempered pessimism about Eurozone economic prospects, contributing to a Q4 rally in equities. Monetary trends, by contrast, suggest a worsening outlook due to the ECB’s scorched earth policy tightening. 

The preferred narrow money measure here – non-financial M1 – contracted for a third straight month in November. The three-month annualised rate of decline of 5.3% compares with a maximum fall of 1.7% during the GFC – see chart 1. 

Chart 1

Chart showing Eurozone Money Measures

Narrow money weakness is being driven by households and firms switching out of overnight deposits into time deposits and notice accounts – a normal pre-recessionary development. Broad money, in addition, is slowing – non-financial M3 rose by only 0.2% in November, pulling three-month annualised growth down to 3.4%, the slowest since 2018. 

The headline M1 and M3 measures are displaying greater weakness, reflecting a fall in money holdings of non-bank financial corporations.

Broad money growth had been supported by solid expansion of bank loans to the private sector but, as expected and signalled by the ECB’s lending survey, momentum is now fading – chart 2. Slumping credit demand and forthcoming QT suggest that broad money will follow narrow into contraction. 

Chart 2

Chart showing Eurozone Bank Loans to Private Sector and ECB Bank Lending Survey Credit Demand Indicator

Corporate loan demand had been boosted by inventory financing but stockbuilding reached a record share of GDP in Q3 – chart 3 – and is probably now being cut back sharply, contributing to a move into recession. Consistent with this story, short-term loans to corporations contracted in both October and November. 

Chart 3

Chart showing Eurozone Stockbuilding as Percent of GDP

A sharp fall in inflation will support real money trends but has yet to arrive. The six-month rate of contraction of real non-financial M1 reached another new record in November – chart 4. 

Chart 4

Eurozone GDP and Real Narrow Money

Monetary tightening in 2007-08 and 2010-11 was associated with a divergence of money trends across countries, reflecting and contributing to financial fragmentation. This is occurring again, with weakness focused on Italy. 

Italian real narrow money deposits contracted by 9.7%, or an annualised 18.4%, in the six months to November, with the larger decline than elsewhere due to both greater nominal weakness and higher CPI inflation – chart 5.

Chart 5

Chart showing Real Narrow Money

In nominal terms, total bank deposits in Italy were unchanged in the year to November – chart 6. Italian banks’ assets grew modestly over this period. The banks funded this expansion by increasing their net borrowing from Banca d’Italia, which in turn accessed additional funding from the Eurosystem, resulting in a further widening of its TARGET2 deficit. The deficit reached a record €715 billion in September following a surge in Italian BTP yields, falling back in October / November – chart 7. Another rise in yields since early December may have been associated with deposit outflows from the banking system and renewed upward pressure on the TARGET2 shortfall. 

Chart 6

Chart showing Bank Deposits of Eurozone Residents

Chart 7

Chart showing TARGET2 Balances

The “monetarist” rule of thumb that broad money growth leads inflation by two years suggests a rapid fall in G7 CPI inflation in 2023 and an undershoot of targets by H2 2024.

Annual growth of the G7 broad money measure calculated here is likely to have fallen below 3% in October, based on US and Japanese data. The money stock appears to have stagnated in the latest three months, with a contraction in the US offsetting weak growth elsewhere*.

The monetarist rule worked perfectly in the early 1970s, when a surge in annual money growth to a peak in November 1972 was followed by a spike in annual CPI inflation to a high exactly two years later – see chart 1.

Chart 1

Chart 1 showing G7 Consumer Prices and Broad Money (% yoy)

Inflation fell sharply from its 1974 peak, mirroring a big decline in money growth in 1973-74. The difference from now is that annual money growth bottomed above 10%, resulting in inflation stalling at a still-high level.

The money growth surge in 2020-21 was almost complete by June 2020 but a final peak was delayed until February 2021. Consistent with the two-year rule, CPI inflation spiked into June 2022, since moving sideways. It may or may not make a final peak but the rule suggests that a major decline will be delayed until after February 2023.

Broad money growth averaged 4.5% in the five years to end-2019. CPI inflation averaged 1.9% in the five years to end-2021 (i.e. allowing for the two-year lag). Money growth returned to the 2015-19 average in June 2022 (4.4%). The monetarist rule, therefore, suggests that inflation will be back below 2% by mid-2024 and will continue to move lower later in the year, reflecting the further decline in money growth since June.

How fast will inflation fall? A reasonable assumption is that its decline will mirror the rapid drop in money growth two years earlier, consistent with the 1970s experience. An illustrative projection is shown in chart 2. Inflation, currently at 7.8% (October estimate), falls to 4% in July 2023 and below 3% by December.

Chart 2

Chart 2 showing G7 Consumer Prices & Broad Money (% yoy) with “Monetarist” Forecast

Some monetarist economists expect inflation to be stickier in 2023. They argue that there is still a monetary “overhang” from the growth surge in 2020-21. Inflation, according to this view, will remain high into H2 2023 to “absorb” this excess. The impact of current monetary weakness will be delayed until 2024-25.

The assessment here is that the overhang is much reduced and its removal is consistent with the optimistic inflation projection shown in chart 2 as long as money trends remain as weak as currently, which is likely.

One measure of the monetary overhang is the deviation of the real broad money stock from its 2010-19 trend. This deviation peaked at 16% in May 2021 and has since narrowed to 6% as inflation has overtaken slowing nominal money growth – chart 3. 

Chart 3

Chart 3 showing G7 Real Broad Money where January 1964 = 100

The projection in chart 3 is based on the inflation profile in chart 2 and an assumption that broad money grows by 2% pa. The deviation of the real money stock from trend falls below 2% in H2 2023 and is eliminated by mid-2024.

Is the assumption of 2% money growth realistic? As noted, there has been no expansion in the latest three months.

As the chart shows, there was a larger deviation of real money from trend than currently at the end of the GFC in 2009. The adjustment back to trend was driven by nominal money weakness rather than high inflation – the money stock contracted by 1.9% between July 2009 and June 2010.

Bank lending has been supporting money growth but central bank loan officer surveys suggest a sharp slowdown ahead: October Fed survey results released this week echo weakness in earlier ECB and BoE surveys – chart 4.

Chart 4

Chart 4 showing US Commercial Bank Loans and Leases (% 6m) with Fed Senior Loan Officer Survey Credit Demand and Supply Indicators* *Weighted Average of Balances across Loan Categories

Continued monetary stagnation – or worse – would confirm that G7 central banks, with the honourable exception of the BoJ, have overtightened policies, compounding their 2020-21 policy error.

G7 monetary gyrations may be contrasted with relative stability around trend in E7** real broad money – chart 5. E7 central bank eased policies conventionally in 2020 and were quick to reverse course as economies rebounded and / or inflationary pressures emerged. This has been reflected in lower average inflation than in the G7 and a faster turnaround – chart 6.

Chart 5

Chart 5 showing E7 Real Broad Money where June 1995 = 100

Chart 6

Chart 6 showing G7 and E7 Consumer Prices (% 6m)

*Money measures used: US M2+ (M2 plus large time deposits and institutional money funds), Japan M3, Eurozone non-financial M3, UK non-financial M4, Canada expanded M2+ (M2+ plus non-personal time deposits).

**E7 defined here as BRIC plus Korea, Mexico and Taiwan.

Photo de Michael Mortimore

Michael Mortimore, gestionnaire de portefeuille client de NSP, a expliqué à WealthBriefing comment l’analyse des cycles de liquidité peut contribuer à la discipline dans la sélection des actions et la répartition des actifs.

M. Mortimore s’est joint à NS Partners en février 2022; auparavant, il a travaillé à Somerset Capital et à Macquarie Bank.

Dans cet article, il explique comment les flux de liquidités provenant des banques centrales peuvent guider les décisions de placement dans ces économies. Il illustre ce thème à l’aide d’exemples venant des marchés émergents, comme l’Asie du Sud-Est. M. Mortimore a indiqué que « notre exposition à la région reposait en partie sur la probabilité que les prix du pétrole demeurent élevés pendant encore un certain temps, ainsi que sur les prix élevés des matières premières et les données monétaires favorables. Ces marchés ont connu une excellente année et ont récemment été une source de liquidités pour nous. »

L’article a été publié le 11 août 2022 dans WealthBriefing et WealthBriefingAsia.

Lisez l’article complet (en anglais).