The fall in UK CPI inflation in July reported this week will be of limited comfort to policy-makers – a decline had been expected because of a large base effect and will be more than reversed in August. A bigger story was the further widening of the RPI / CPI inflation gap to an 11-year high. RPI inflation could top 5.5% in Q4 2021, boosting interest payments on index-linked gilts by a whopping £15 billion relative to the OBR’s Budget forecast.

CPI inflation fell from 2.5% in June to 2.0% in July but RPI Inflation eased by only 0.1 pp to 3.8%. RPIX inflation – excluding mortgage interest – was stable at 3.9%.

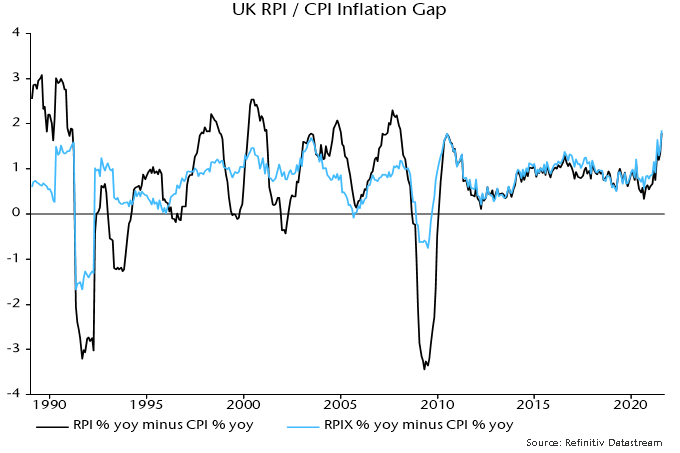
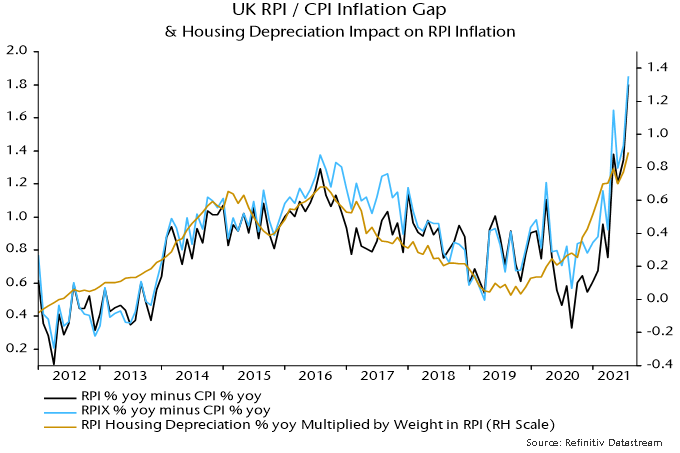
The RPI / CPI inflation gap, therefore, widened to 1.8 pp, its largest since June 2010. The RPIX / CPI inflation gap of 1.9 pp is the biggest on record since the inception of CPI inflation data in 1989 – see chart 1.

Chart 1

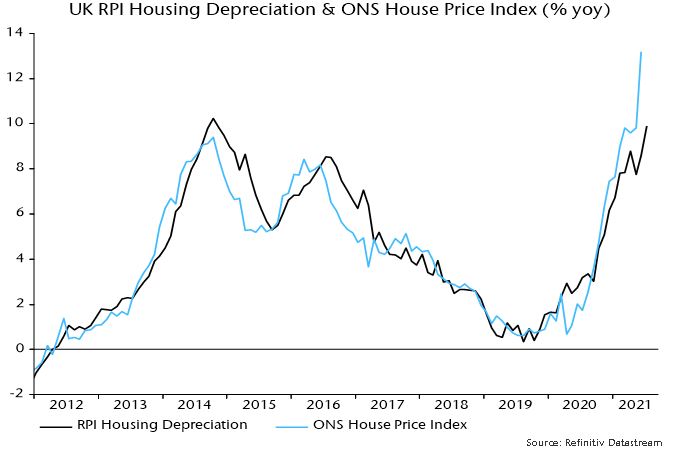
The widening gaps mainly reflect surging house prices, driven partly by Chancellor Sunak’s stamp duty holiday. House prices enter the RPI via the housing depreciation component*, which is linked to ONS house price data with a short lag – chart 2. This component has a 9.0% weight and rose by 9.9% in the year to July, contributing 0.9 pp to RPI inflation of 3.8%. The CPI omits owner-occupier housing costs.

Chart 2

Note that the housing depreciation weight has risen from 5.8% in 2014, i.e. the sensitivity of the RPI to house prices has increased by more than 50% since then.

The RPI / CPI and RPIX / CPI inflation gaps, however, have widened by more than implied by house prices alone – chart 3.

Chart 3

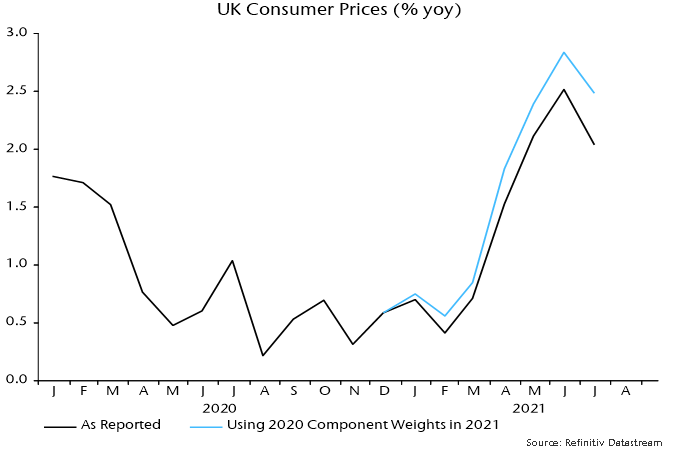
A likely additional influence has been the ONS decision to depart from its normal procedure and base 2021 CPI weights on 2020 rather than 2019 expenditure data. As previously explained, this has lowered the weight of categories hit hardest by the pandemic but now experiencing a rebound in demand and prices. An alternative calculation carrying over 2020 weights (based on 2018 expenditure data) to 2021 produces an annual inflation number for July of 2.5% rather than 2.0% – chart 4.

Chart 4

The RPI has been less affected because the normal procedure was followed of basing weights on expenditure shares in the 12 months to June of the previous year. 2021 weights, therefore, reflect spending in the year to June 2020 – the impact of the pandemic was smaller over this period than in calendar 2020.

So weighting effects are likely to have had a larger negative impact on CPI than RPI inflation.

The phase-out of the stamp duty holiday is being reflected in a slowdown in housing market activity but estate agents expect a shortage of supply to support prices, according to the RICS survey. Recent strength may not yet have fed through fully to the RPI housing depreciation component – the annual rise in the latter of 9.9% in July compares with a 13.2% increase in the ONS house price index in the year to June.

Assume, as a reasonable base case, that that the annual increase in the housing depreciation component moderates to 8.0% in Q4 2021 while other influences on the RPI / CPI inflation gap are stable. This would imply a decline in the gap from the current 1.8 pp to 1.6 pp. The Bank of England’s August forecast of CPI inflation of 4.0% in Q4 would then read across to RPI inflation of 5.6%.

The OBR’s March Economic and fiscal outlook projected a 2.4% rise in the RPI in the year to Q4 2021. According to its debt interest ready reckoner, a 1% rise in the RPI boosts interest costs on index-linked gilts by £4.8 billion in the following year. The suggested Q4 overshoot of 3.2 pp, therefore, implies a spending increase of £15.2 bn – or 0.6% of annual GDP – relative to Budget plans.

*House prices also feed into the mortgage interest component, as well as estate agents’ fees and ground rent.

The economic / market view here remains cautious based on 1) an expected slowdown in global industrial momentum through H2 (already apparent in Chinese data) and 2) recent less favourable “excess” money conditions.

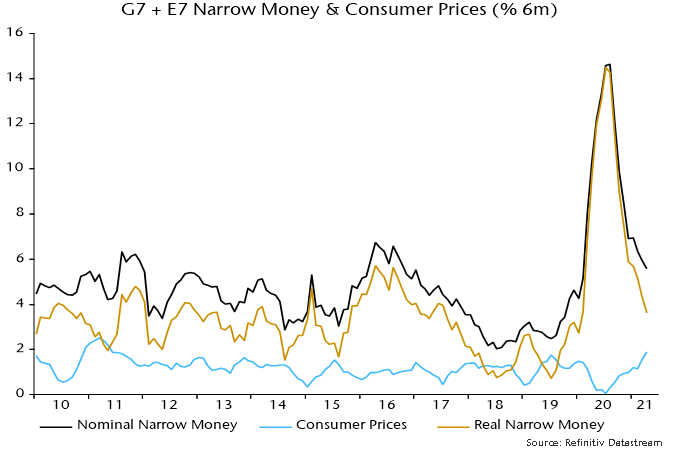
Global six-month real narrow money growth, however, may have bottomed in May / June. A Q3 rebound would signal a stronger economy in H1 2022. An associated improvement in excess money could reenergise the reflation trade in late 2021.

The issue can be framed in cycle terms: does the recent top in the global manufacturing PMI new orders index mark the peak of the stockbuilding cycle (implying a shortened cycle) or will the peak be delayed until H1 2022?

Possible drivers of a real money growth rebound include Chinese policy easing, a slowdown in global consumer price momentum and a pick-up in US / Eurozone bank loan expansion.

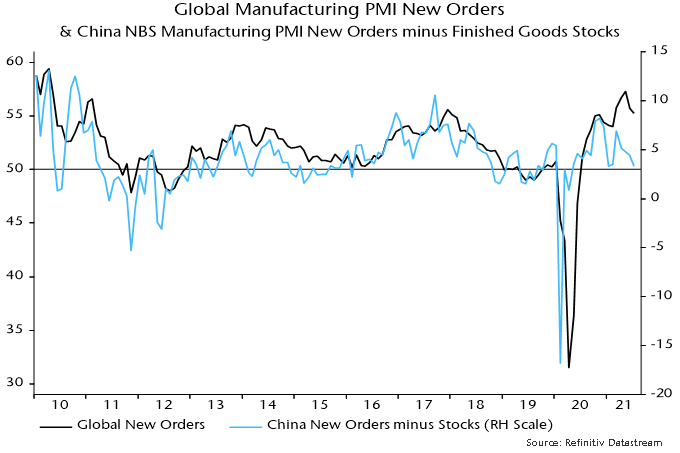
The H2 industrial slowdown view remains on track. The global manufacturing PMI new orders index fell further in July, confirming May as a top. Chinese orders were notably weak and have led the global index since the GFC – see chart 1.

Chart 1

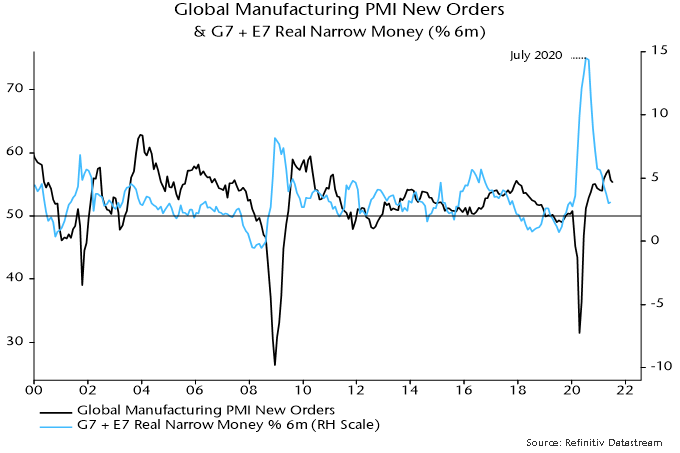
Global six-month real narrow money growth fell steadily between July 2020 and May but a stabilisation in June has been confirmed by additional monetary data released over the last week – chart 2.

Chart 2

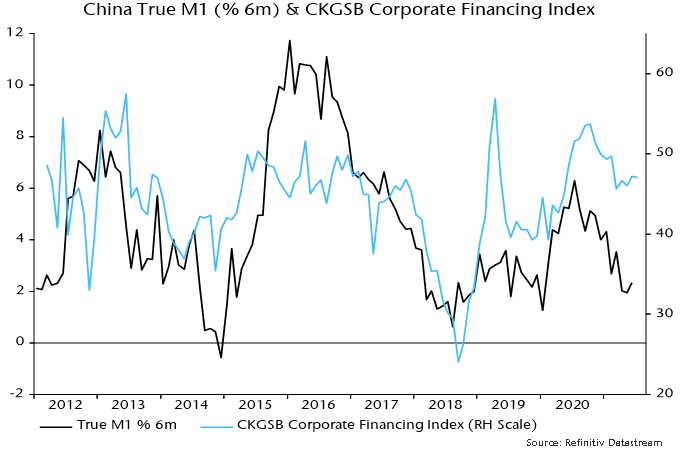
Will PBoC policy easing drive a recovery in Chinese / global money growth? The hope here was that the 15 July cut in reserve requirements would be reflected in an early further fall in money market interest rates and easier credit conditions. Three-month SHIBOR, however, has moved sideways while corporate credit availability is little changed, judging from the July Cheung Kong Graduate School of Business survey – chart 3. July money data, therefore, could show limited improvement.

Chart 3

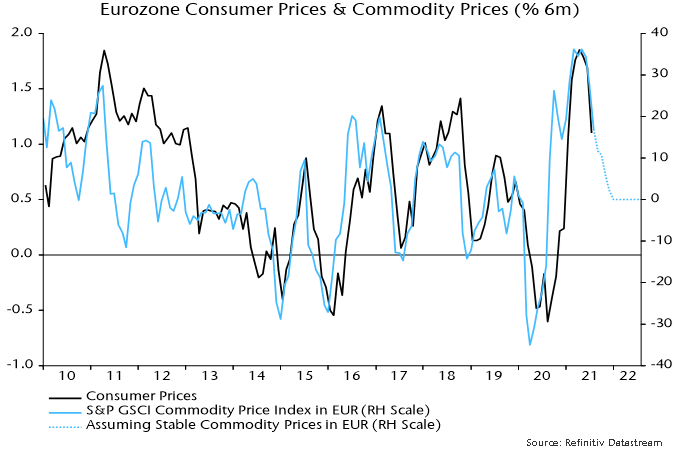
Global six-month real money growth should receive support from a slowdown in consumer price momentum as commodity price and bottleneck effects fade. Eurozone six-month CPI inflation eased on schedule in July, with further moderation suggested and the move lower likely to be mirrored in other countries (Tokyo July numbers also showed a slowdown) – chart 4.

Chart 4

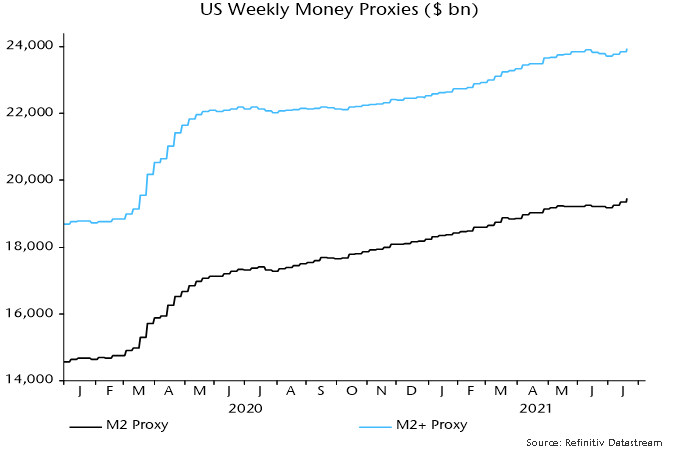
US monetary prospects are foggy. Disbursement of stimulus payments boosted nominal money growth over March-May but there was a sharp slowdown in June. Weekly data indicate a reacceleration in July as the Treasury ran down its cash balance at the Fed to comply with debt ceiling legislation – chart 5. This effect, however, will be temporary and an improving fiscal position suggests a reduced contribution from monetary financing during H2 and into 2022.

Chart 5

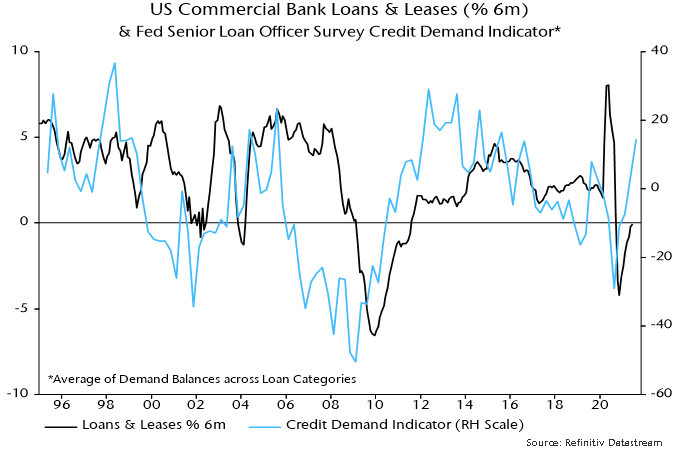
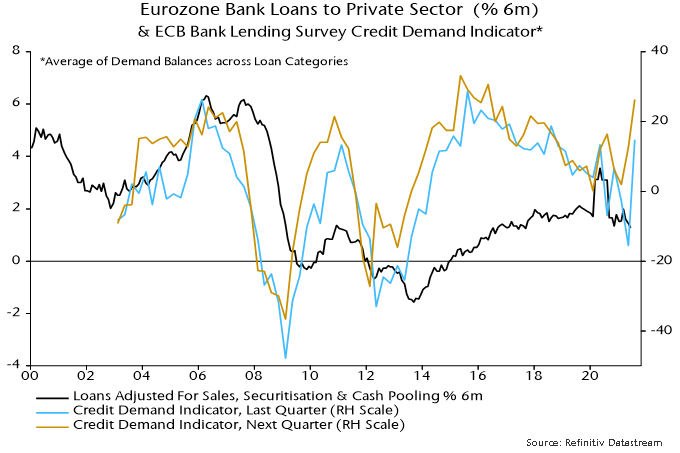
Stable or higher US money growth, therefore, may require a pick-up in bank loan expansion. The Fed’s July senior loan officer survey, released yesterday, is hopeful, showing a further improvement in demand balances across most loan categories (not residential mortgages) – chart 6. The ECB’s July lending survey gave a similar message – chart 7. The survey indicators, however, are directional and the magnitude of a likely loan growth pick-up is uncertain. Actual lending data remained soft through June.

Chart 6

Chart 7

Failure of global real money growth to recover in Q3 – and especially a further slowdown – would suggest that the stockbuilding cycle is already at or close to a peak. The cycle bottomed in Q2 2020 and – based on its average historical length of 3.33 years – might be expected to reach another low in H2 2023, in turn implying a peak no earlier than H1 2022. As previously discussed, however, the current upswing could be short to compensate for a long (4.25 years) prior cycle.

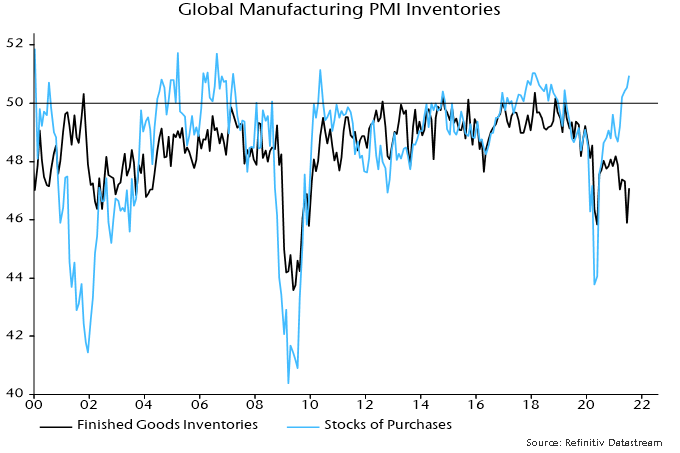
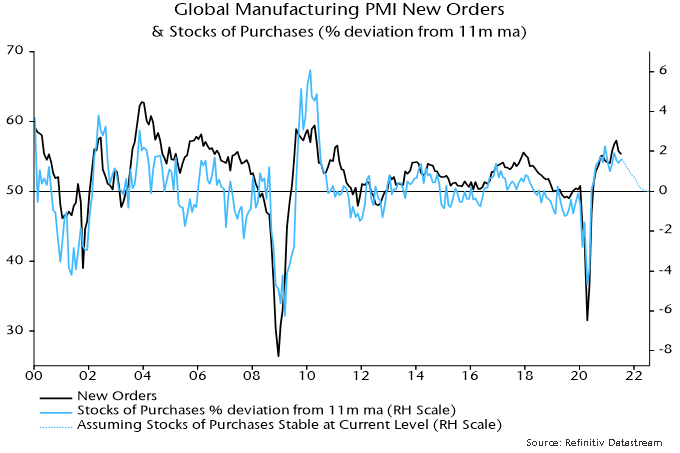
Proponents of the consensus view that replenishment of stocks will underpin solid industrial growth in H2 cite the still-low level of the global manufacturing PMI finished goods inventories index – chart 8. Research conducted here, however, indicates that the stocks of purchases index (i.e. raw materials / intermediate goods) is a better gauge of the stockbuilding cycle and tends to lead the finished goods index. The former index is already at a level consistent with a cycle top and the rate of change relationship with the new orders index is another reason for expecting orders to weaken significantly during H2 – chart 9.

Chart 8

Chart 9

As we write this commentary, the first half of the year is behind us and most stock indices are at all-time highs. Earlier in the year, an inflation scare drove the United States (US) 10-year Treasury yield to 1.74% with a small correction in growth assets like those listed on the Nasdaq. It seems the market has decided to follow the cues of the US Federal Reserve (Fed) that inflation will be transitory, once the effects of the pandemic, the pent-up demand and the disruptions to the supply chain are behind us.  Since March 5, equity markets have been roaring back and the 10-year Treasury yield is now range-bound at around 1.5%. Inflation numbers, however, continue to rise.

What do we think at Global Alpha? Unfortunately, we do not have a crystal ball, nor have we reached a consensus amongst ourselves. However, we believe the risk that inflation will be sustainably higher than the target of 2% established the Fed and many central banks is high.

The table below shows the prices of various commodities. Many would argue that 2020 was an outlier.  That is why we based our comparison on 2019, which was a normal year with a strong economy. The numbers are self-explanatory. In many cases, prices are at multi-year highs. Copper is now at its highest level since 2011, and reached an all-time record this quarter, as did lumber.

Price of (in US$)June 28, 2019June 30, 2020June 30, 2021% increase over 2019
Oil (Bbl)58.4739.2773.9026%
Natural Gas (Mcf)2.311.753.6558%
Gasoline (gallon)1.771.262.2627%
Corn (Bushel)41437358541%
Pork (lb)0.870.751.0420%
CRB Food Index34829048840%
Copper (MT)59936015933556%
Aluminium (MT)18201620255240%
Lumber (MBF)37943671889%
CRB Index40836055737%
Baltic Freight Sea shipping138117993418247%
Sources: USDA, CRB

The broadest measure of commodity prices, the CRB Index, is at its highest since 2011, when it reached an all-time high. Its component, the CRB Food Index, is also at its highest since 2011, near its record high.

Many observers will brush off commodity price inflation, arguing that it is caused by an imbalance between demand and supply that normally reverts within a few quarters. Although true, the supply response can take a lot longer than expected. Oil and gas companies are under enormous pressure and are not increasing exploration. Political uncertainty in South America may slow the supply growth for copper. The effects of weather events seem to have a more permanent effect on the inflation of agricultural commodities. For now, let’s assume that supply will come back and prices will come down. The example of lumber, which has recently retreated from above $1700/mbf to just over $700 may prove this point. In our opinion, what may drive a more sustainable inflation will be wage increases, which are driven by inflation expectations.

What we are witnessing currently, particularly in North America, is a wage inflation between 5% and 10% for the lowest earners. Inflation expectations are running close to 4%. There is a risk that the situation becomes a self-feeding mechanism, like in the 70s. Another big component of inflation is rent. The median asking rent in the US has increased almost 18% from the end of March 2020 to the end of March 2021, reaching $1,226 per month. It is up 22% since March 2019.[1]

Many have stated that a big reason for the low-inflation of the last twenty years was the emergence of China and its vast labor pool of migrant workers as the factory of the world. In May of this year, China’s producer price index reached 9%, its highest level since the summer of 2008. China will no longer be the deflationary force it has been in the last two decades. Between the aging of its population, its internal needs and increasing trade frictions, we can expect price increases from China.

Inflation numbers will continue to be very high, one might even call them scary for the next twelve months. How the Fed, politicians, unions, consumers and investors will react to these numbers will be important to watch, and our job is to forecast. We are already starting to see some divergence between central banks, like those of Norway, New Zealand and Canada, and even within the ranks of the Fed.

How will the market react to increasing signs that inflation will be more than transitory and that rates will rise?

Past episodes have shown that long-duration assets like long-term bonds and high growth stocks will be most affected. US large caps, particularly technology companies, are selling at important premiums versus other markets. They will be most vulnerable. Europe does not have the same labor inflation pressures. That said, inflation in the region may be more contained.

Smaller companies have generally outperformed in periods of inflation. From January 1979 to July 1983, the Russell 2000 Index outperformed the S&P 500 Index by 77%. During this time, inflation rose to as high as 13% and the economy suffered a double-dip recession in 1980 and 1981-82, before staging an extremely strong recovery in 1983 with growth rates as high as 8.5%.[2]

Our portfolio is well positioned for a strong recovery accompanied by higher inflation. With less debt, a rise in interest rates will have a minimal impact. With a more important exposure to the consumer and industrial sectors, economic growth will translate into earnings growth.

As mentioned in last week’s commentary, our companies have been able to maintain their margin despite rising input costs through a combination of price increases and efficiency gains.


[1] www.census.gov

[2] http://www.cmegroup.com/

Closeup side view of a mid 50’s couple going grocery shopping during coronavirus pandemic. They are in an empty aisle, wearing face masks and choosing some frozen foods.

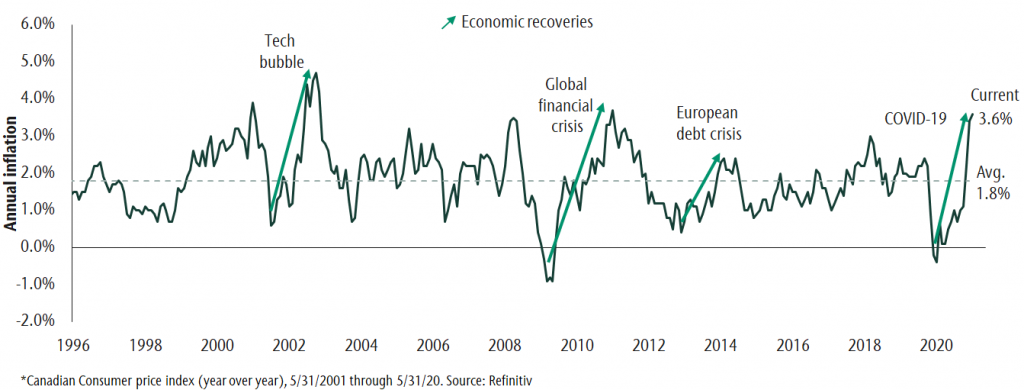
Inflation has moved to its highest level in ten years. Higher prices result from strong economic growth led by pent-up demand for goods and record levels of government spending. At the same time, strong demand is leading to supply shortages. This dynamic is normal and has occurred after every recession. Further, when we look at the components of inflation, we see that recent price increases are largest in industries hurt the most during the pandemic, e.g. energy and travel. These industries are cyclical and are pulling inflation readings higher as prices recover after a period of decline.
We don’t believe investors should be worried about longer-term secular inflation. Higher prices in the short term are expected to be tempered as supply adjusts and demand returns to more normal levels. And while policy actions such as higher spending and larger debt levels have increased short-term inflation, the same forces are deflationary long-term. This is because more money goes to paying down debt as opposed to future investment. The caveat is that higher debt levels encourage policymakers to allow inflation to move higher than it has been in recent cycles. Considering these forces, we believe inflation will be higher but not at the disruptive levels we saw in the 70s and 80s. Our long-term inflation expectation is for a 2.1% increase in prices. This is higher than the last 25 years but still moderate.

Inflation rises during economic recoveries

Impact of inflation on different asset classes.

While we don’t think inflation will be disruptive in the long term, inflation is higher now and likely to be higher during the coming cycle. Now is a good time to consider the effect of inflation on different asset classes that make up your portfolio. Stocks can generally do well in a period of moderate inflation, whereas fixed income is hurt the most. Alternative asset classes also have some natural protection from inflation. Here follows our inflation perspective on each major asset class:

Equities

Moderate inflation is a double-edged sword for stocks. On the one hand it increases corporate cash flows and on the other it decreases the real value of investment returns. Companies with high valuations tend to underperform as their valuations are based on future earnings growth long into the future. In a period of higher inflation, these future earnings are now worth less today. Companies with lower valuations, companies we call value stocks, do better in a period of above-average inflation. Strategically we think it makes sense to hold both growth and value styles within your equity allocation.

In this environment we also want to own companies that can maintain their profit margins and offer specialized goods or services. These companies are more likely to be able to pass on rising business costs to consumers.

Fixed Income

The bond allocation of a portfolio is the one that is hardest hit by inflation. This is because most bond coupon payments do not increase with inflation. In addition, bond yields tend to rise when inflation is moving higher. The result is both a temporary decline in the price of bonds and lower long-term real return.

The negative effects of rising inflation and yields can be managed by holding short-term bonds and higher coupon bonds. The former are less sensitive to changes in inflation and yields. This protects capital when inflation is rising. The latter have more income to offset price declines. Having a view of the economic backdrop and managing a bond portfolio’s sensitivity to changes in yields and inflation is important to delivering risk-adjusted returns. This is particularly true when inflation is on the rise.

Alternatives

The alternative asset classes in a portfolio are attractive since they generate strong levels of income relative to traditional equities and bonds. They also tend to be the least sensitive to risks in the broader economy, including inflation. Each of our private market investments (real estate, infrastructure and private loans) have natural inflation stabilizers. For real estate, rental income tends to rise with inflation and most of our infrastructure contracts have ongoing inflation adjustments. Finally, the coupon payment on private loans are variable and income rises as yields and inflation move higher.

Hedge strategies are a liquid alternative asset class. They don’t directly hedge against inflation, but when allocating to strategy within a portfolio, we reduce bond exposure which is most negatively affected by inflation.

Planning for different investing environments

A well-diversified portfolio by its nature has many offsets to inflation. As active managers we also make investment decisions to improve portfolio returns or mitigate inflation risk. While it’s been a long time since we have had to worry about inflation, we are positioned for higher but moderate price increases. When reviewing your asset allocation, a key point to keep in mind is that inflation does not affect all portfolios equally. More conservative investors with a larger percentage of their portfolio in fixed income are more susceptible to lower returns as inflation rises. As such, it’s important to review the asset allocation on an ongoing basis to see how trends like inflation may impact the ability of a portfolio to meet your objectives. We have many tools to assess the tradeoffs you face as an investor under different market and economic conditions. While the future is uncertain, we can assist you in making informed decisions that consider risks like inflation, among others.

This post is for information only and is not intended as investment advice. The views expressed are those of the author at the time of publication and are subject to change at any time.

The sharp rise in UK CPI inflation to 2.1% in May supports the long-standing forecast here of a move above 3% in late 2021.

The 2.1% outturn compares with a 2.0% forecast in a post a month ago but there were bigger surprises within the detail. Core inflation – excluding food, energy, alcohol and tobacco – jumped from 1.3% in April to 2.0%. This was partly offset by unexpected further weakness in food prices, which posted a 1.2% annual fall, up from 0.5% in April.
This is an unfavourable combination because the rise in core prices is more likely to stick, with food prices expected to pick up into 2022.

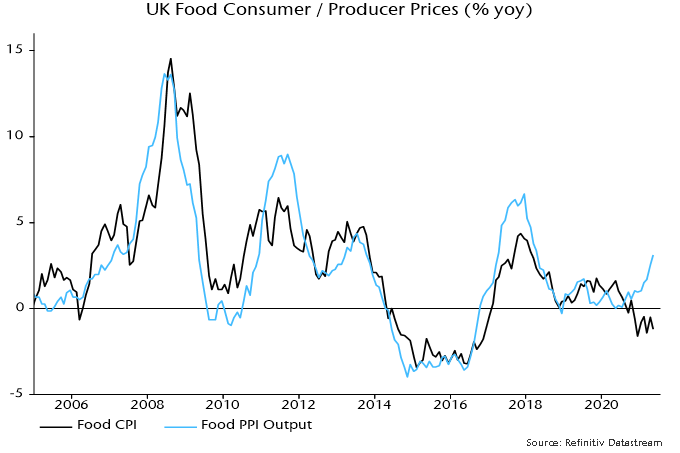
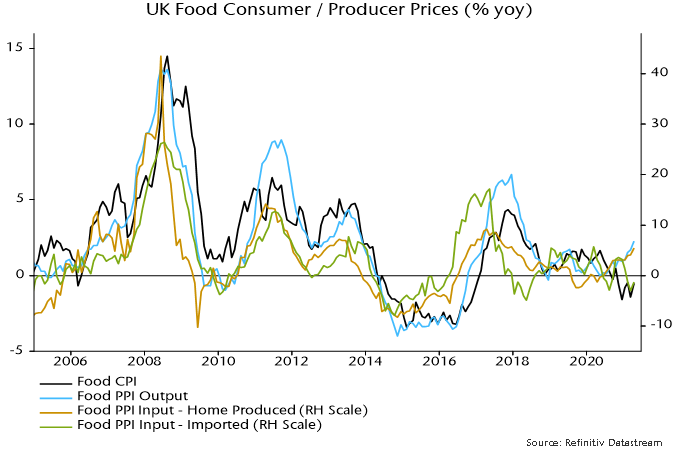
A food rebound is already evident in producer output price inflation for food products, which rose to 3.1% in May and correlates with / leads CPI food inflation – see chart 1,

Chart 1

Headline / core inflation rates are still being suppressed by last year’s VAT cut for hospitality, which is due to be reversed in two stages starting in October. The guesstimate here is that core inflation would be 2.7% in the absence of the cut, based on an assumption of 35% pass-through to consumers.

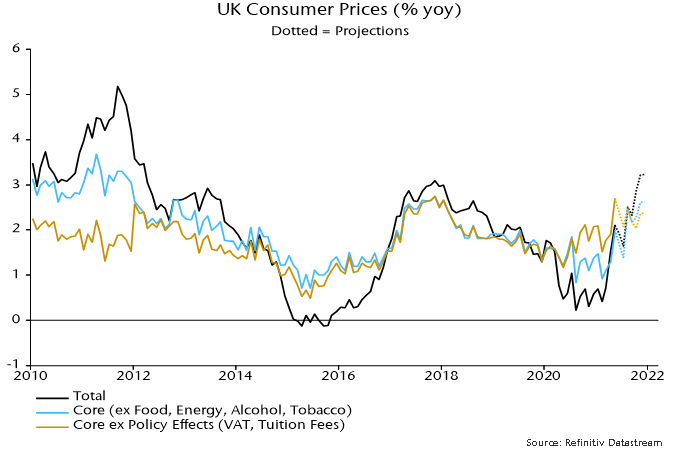
The revised forecasts shown in chart 2 incorporate one-third of the upside core surprise in May, attributing the remainder to temporary “noise” – this may prove overoptimistic. As before, annual food inflation is assumed to rise to 2.0% by year-end. The previous energy price assumptions are also maintained.

Headline / core rates fall back in June / July because of base effects but rises resume thereafter, with headline inflation reaching 3.2% in November / December.

Chart 2

It should be noted that the end-2020 basket reweighting has had the effect of suppressing recorded inflation in 2021. The new weights reflect spending patterns during the pandemic but expenditure shares are normalising as the economy reopens, with an associated shift in relative prices.

The CPI weight of restaurants and hotels, for example, was cut from 11.9% in 2020 to 8.7% in 2021 but the price index for the sector rose by 3.4% between December 2020 and May, more than double a 1.5% rise in the overall CPI. The cut in the weight also implies that the VAT reversal will have a smaller CPI impact than last year’s reduction.

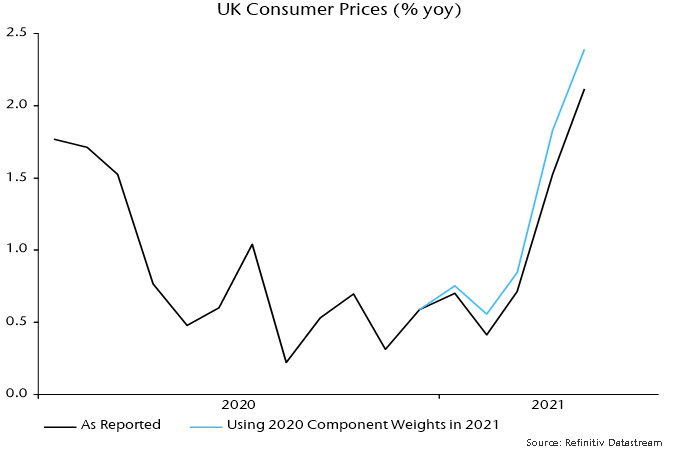
An alternative approach, which may better reflect consumer experience, is to reuse the 2020 basket weights, based on 2018 spending shares, for the 2021 index calculation. The alternative measure rose by 1.7% between December and May, with its annual increase at 2.4% versus the official 2.1% – chart 3.

Chart 3

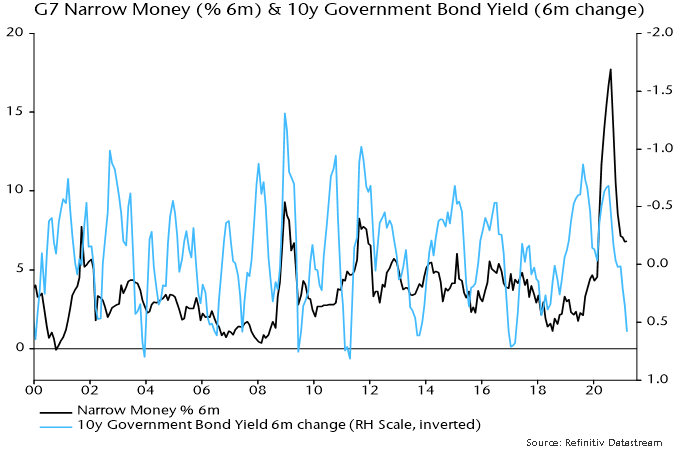
Additional country releases in recent days confirm that global six-month real narrow money growth fell further in April, to its slowest pace since January 2020 – see chart 1. The decline from a peak in July 2020 is the basis for the forecast here of a significant cooling of global industrial momentum during H2 2021.

Chart 1

The April fall reflected both slower nominal money growth and a further pick-up in six-month consumer price momentum – chart 2. The latter is probably at or close to a short-term peak and the central scenario here remains that real money growth will stabilise and recover into Q3. The risk is that nominal money trends continue to soften – the boost to US numbers from disbursement of stimulus payments may be over and this year’s rise in longer-term yields may act as a drag.

Chart 2

Six-month growth of real broad money and bank lending also moved down in April, with the former close to its post-GFC average and the latter considerably weaker – chart 3. Forecasts last year that government guarantee programmes would lead to a lending boom have so far proved wide of the mark; monetary financing of budget deficits, mainly by central banks, remains the key driver of broad money expansion.

Chart 3

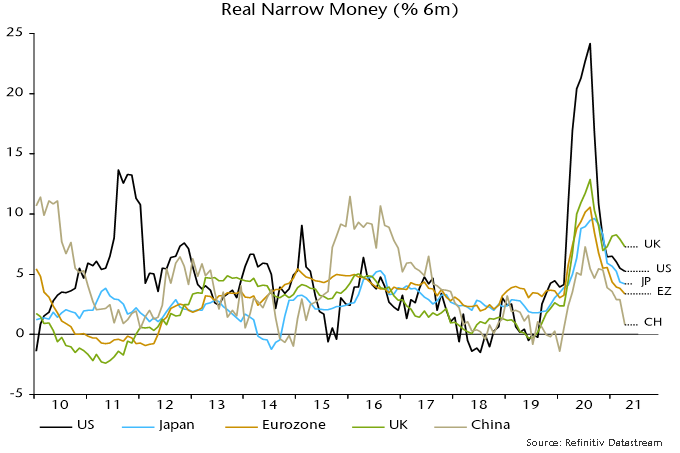
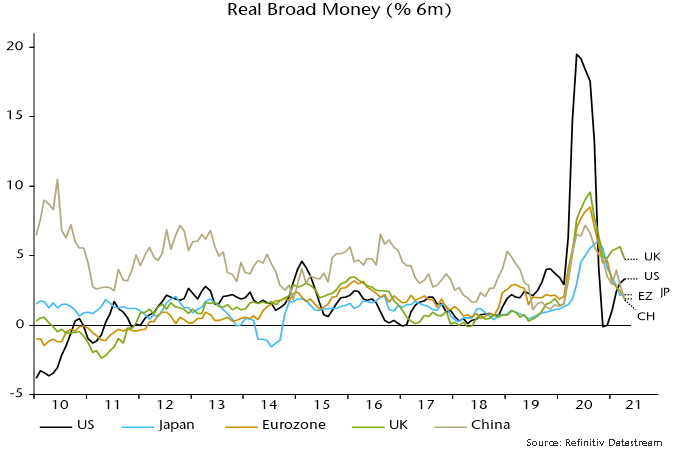
Charts 4 and 5 shows six-month growth rates of real narrow and broad money in selected major economies. The UK remains at the top of the range on both measures, supporting optimism about near-term relative economic prospects, although slowing QE and a sharp rise in inflation promise to erode the current lead.

Chart 4

Chart 5

Eurozone real money growth, by contrast, is relatively weak: monetary deficit financing has been on a smaller scale than in the US / UK, while six-month inflation is higher than in the UK / Japan. Bank lending has been expanding at a similar pace in the Eurozone and UK. The recent step-up in ECB PEPP purchases could lift Eurozone broad money growth although the change is modest and could be offset by an increased capital outflow – see previous post.

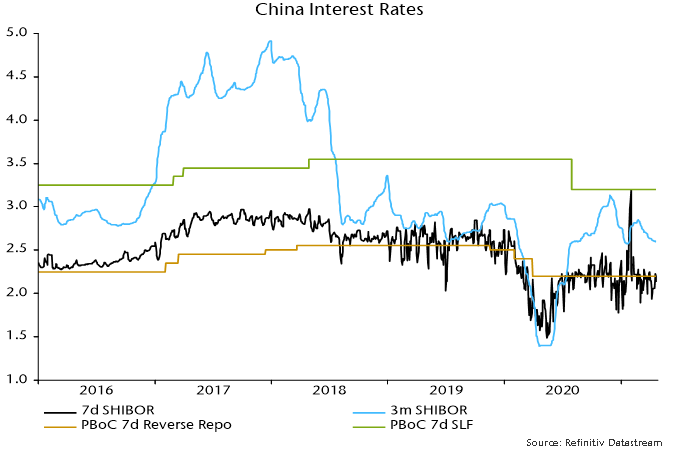
China remains at the bottom of the ranges and monetary weakness was expected here to trigger PBoC easing by mid-year. Policy shifts usually proceed “under the radar” via money market operations and directions to state-run banks. The managed decline in three-month SHIBOR continued this week, while the corporate financing index in the Cheung Kong Graduate School of Business survey stabilised in April / May after falling over October-March, which could be a sign that banks have been instructed to increase loan supply.

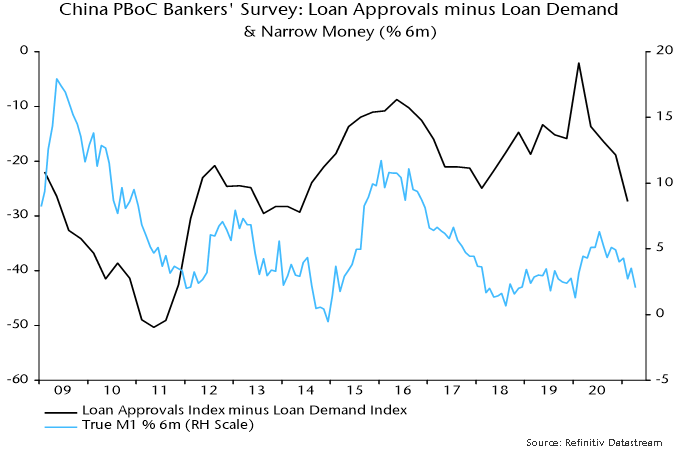
The PBOC’s quarterly bankers’ survey, due for release later this month, could provide further corroboration of a policy shift: the differential between loan approval and loan demand indices leads money growth swings – chart 6. Monetary reacceleration in China remains the most likely driver of a rebound in global six-month real narrow money growth – required to support a forecast that H2 industrial cooling will represent a pause in an ongoing upswing rather than a foretaste of more significant weakness in 2022.

Chart 6

post in November presented a “monetarist” forecast that CPI inflation would rise to more than 3% by late 2021. This forecast appears on track.

The Bank of England’s central projection for Q4 2021 was 2.1% in November. This was lowered to 1.9% in February but raised to 2.5% in May.

A key element of the November forecast was a significant inflation boost from energy prices, reflecting a view that a strong global industrial recovery would push up oil and other commodity prices. This has played out: the CPI energy component rose by 7.5% in the year to April, contributing 0.5 percentage points (pp) to annual CPI inflation of 1.5%.

The energy effect explains the upward revision to the Bank of England’s forecast. The Bank now expects the contribution of energy prices to annual inflation to rise further to 0.75 pp by Q4 – similar to the view here, which assumes an additional 5% increase in the Ofgem price cap in October.

The forecast that CPI inflation will exceed 3% by year-end is driven by three additional factors:

  • The planned increase in VAT in the hospitality and tourism sectors from 5% to 12.5% in October, with a return to 20% scheduled for April 2022.
  • A pick-up in food price inflation, partly reflecting recent strength in global food commodity prices.
  • A rise in underlying core inflation (i.e. excluding the VAT effect as well as energy / food contributions) in lagged response to faster broad money growth.

Taking these in turn, the forecast assumes that there will be 35% pass-through of the VAT rise to prices, implying a 0.2 pp boost to the monthly change in the CPI in October. The Bank and consensus, by contrast, appear to assume a negligible impact. This is surprising: firms face rising costs and the withdrawal of government support while economic reopening should ensure strong demand – why would they allow margins to take the full hit from the VAT hike?

Food prices have so far been weaker than assumed in the November forecast here, falling by 0.5% in the year to April. Producer output prices of food products, however, were up by 2.3% over the same period, the largest annual rise since 2018 – see chart 1.

Chart 1

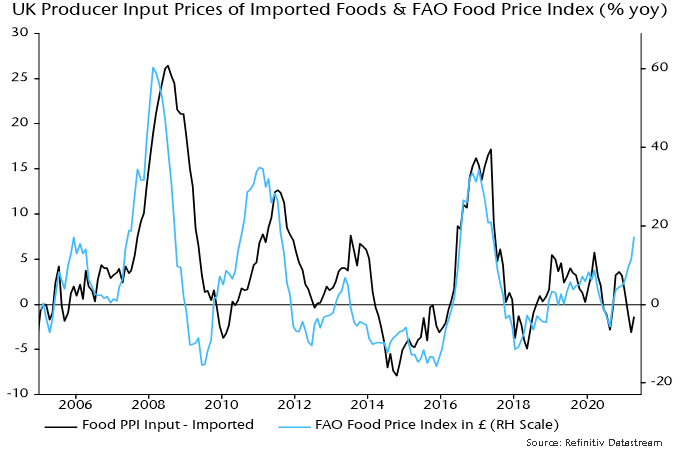
The pick-up in producer output prices appears to have been driven by higher input costs of home-produced food. Imported food materials, by contrast, have cheapened, partly reflecting sterling appreciation. This is about to change: the FAO global food commodity price index rose by 17% in sterling terms in the year to April – chart 2.

Chart 2

The forecast here continues to assume that annual CPI food inflation will rise to 2.0% by December.

The final element of the forecast is an expected further rise in underlying core CPI inflation. Actual core inflation (i.e. excluding energy, food, alcohol and tobacco) was 1.3% in April but the assumption of 35% pass-through of the VAT cut in hospitality and tourism implies a significantly higher underlying rate, of 1.9%. The underlying rate has risen from a low of 1.2% in May 2020.

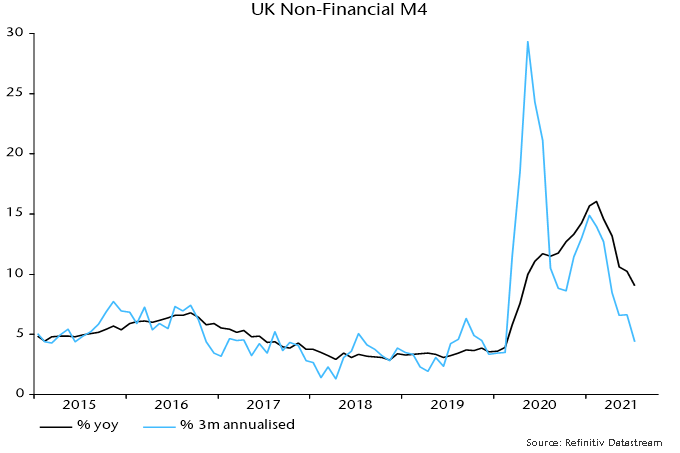
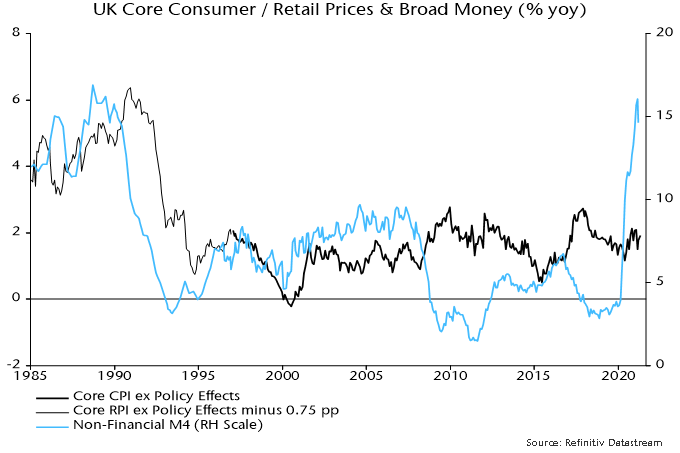
Research previously reported here found a consistent directional leading relationship between broad money growth and underlying core inflation, albeit with a variable lead time influenced particularly by exchange rate movements – chart 3. The surge in annual broad money growth, as measured by non-financial M4, from 3.6% at end-2019 to a likely peak of 16.1% in February suggests further upward pressure on the underlying core rate in 2021 -22 – the assumption here is that it will rise to 2.1% by December.

Chart 3

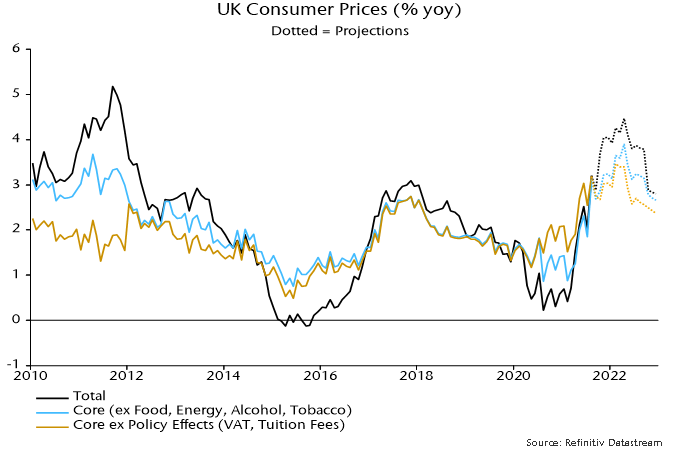
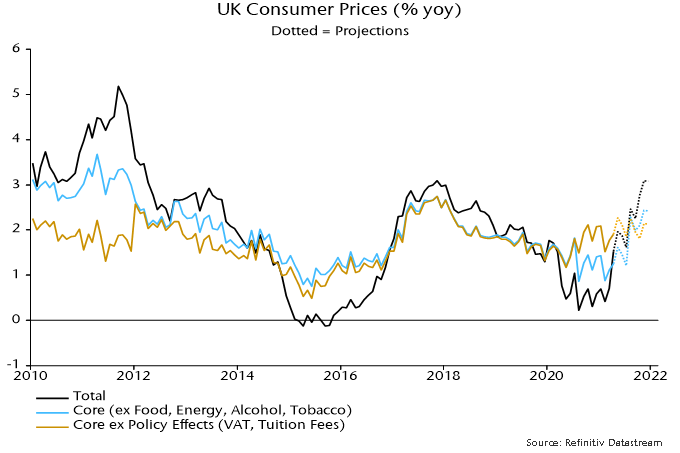
Chart 4 shows forecasts for headline, core and underlying core CPI Inflation through end-2021 based on the above assumptions. The headline rate finishes the year at 3.1% – slightly lower than in the November forecast because of the Budget decision to postpone full reversal of the VAT cut until 2022.

Chart 4

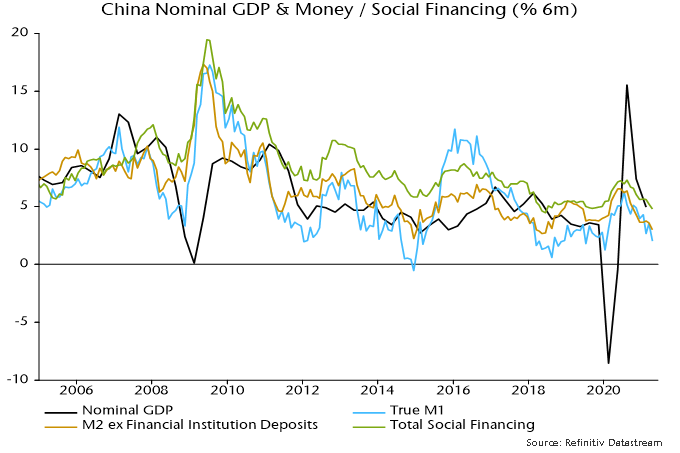
Chinese money trends continue to give a negative message for economic prospects. The PBoC could be moving towards easing policy despite a surge in producer price inflation.

Monthly changes in money and lending aggregates were notably weak in April. Six-month growth rates of narrow money, broad money and broad credit fell again, sustaining a downward trend since Q3 2020 – see chart 1.

Chart 1

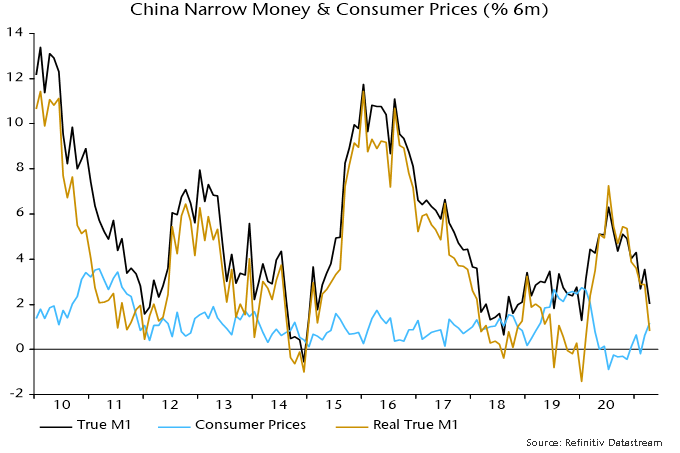
Trends are weaker in real terms because of a recovery in six-month consumer price inflation. Six-month real narrow money growth is the lowest since February last year – chart 2.

Chart 2

The monetary slowdown was the basis for a forecast that the economy would lose momentum in H1 2021. Q1 GDP growth was below consensus and PMIs have moderated since late 2020. Further monetary weakness suggests that that the slowdown will extend through Q3, at least.

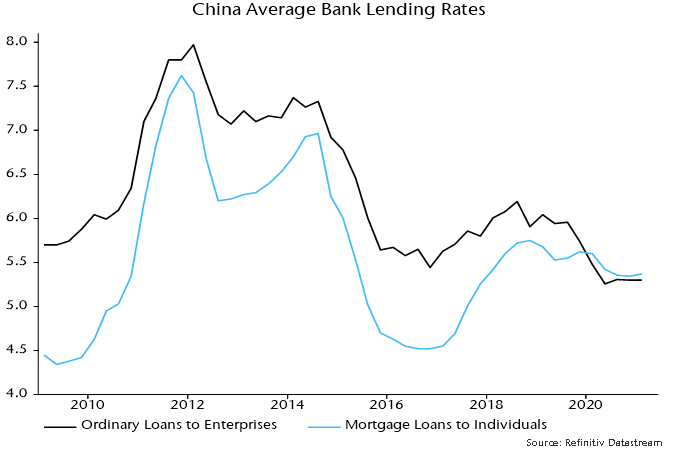
There is little reason to expect money / credit trends to revive. Average interest rates on bank loans have moved sideways since Q3 2020 – chart 3. The PBoC’s Q1 bankers’ survey reported a fall in loan approvals, consistent with a decline in the Cheung Kong Graduate School of Business corporate financing index – weaker readings imply less favourable credit conditions.

Chart 3

The expectation here was that the PBoC would reverse its H2 2020 policy tightening in response to softer economic data and an ongoing money / credit slowdown. The central bank, however, was concerned about housing market strength in early 2021 and withdrew liquidity to reverse a decline in money market rates into late January.

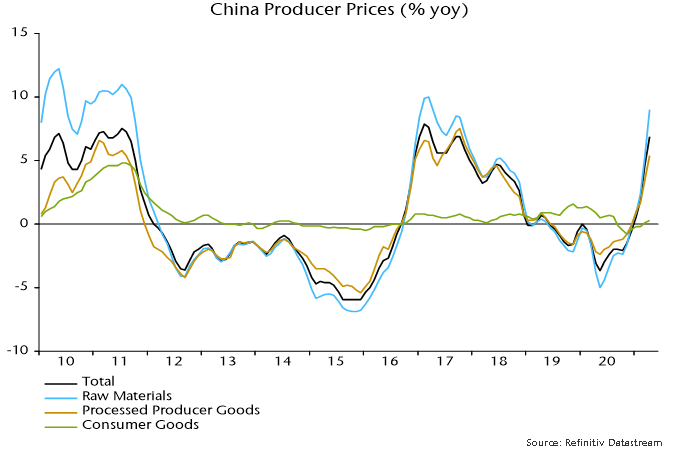
Many continue to expect the next PBoC move to be a tightening, a forecast seemingly supported by a recent surge in producer price inflation. The latter, however, has been driven by raw material costs, with little pass-through to date into producer prices of consumer goods – chart 4.

Chart 4

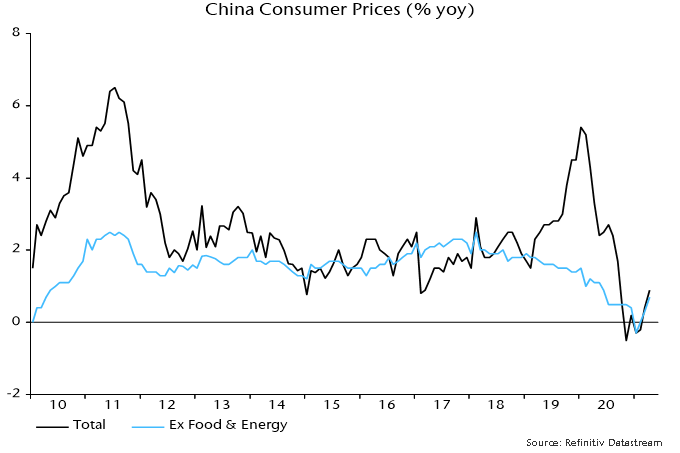
Core consumer price inflation has recovered from early year weakness but remains low – chart 5.

Chart 5

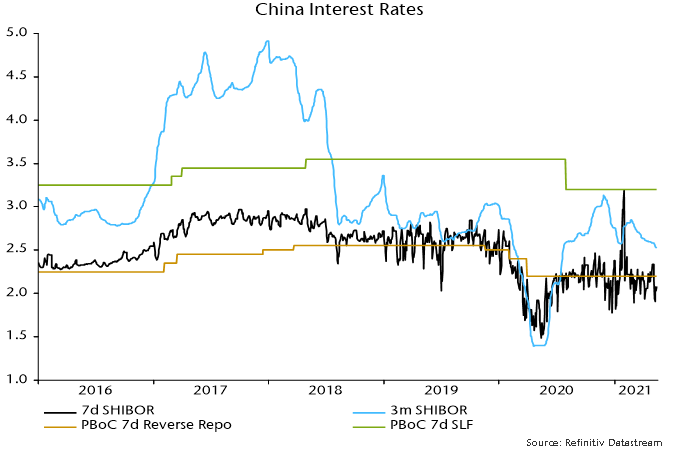
The weak April money / credit numbers could be the trigger for a PBoC rethink. Three-month SHIBOR has been allowed to drift slightly below its January low – chart 6. A further decline would support the view that a policy shift is under way.

Chart 6

Global six-month real narrow money growth appears to have edged lower in March, continuing a downtrend since last summer. This suggests that an expected relapse in global industrial momentum will extend through late Q3 / early Q4.

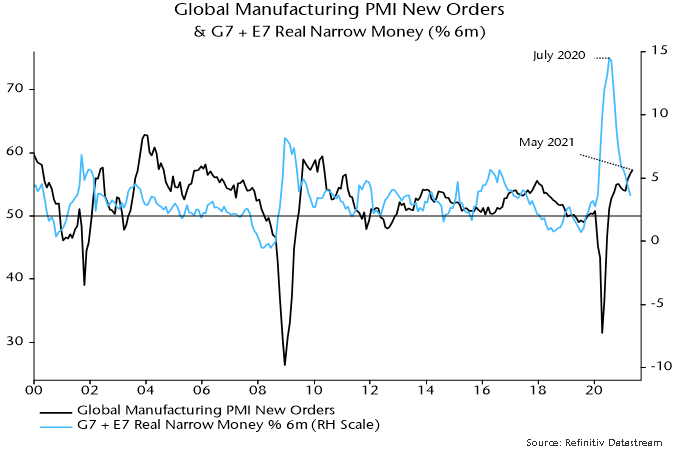
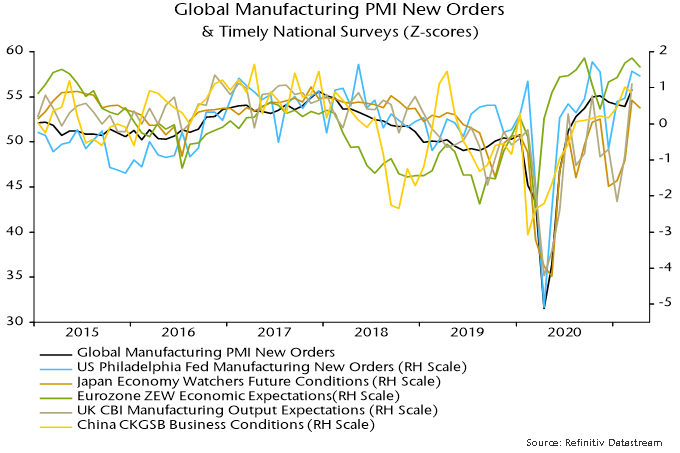
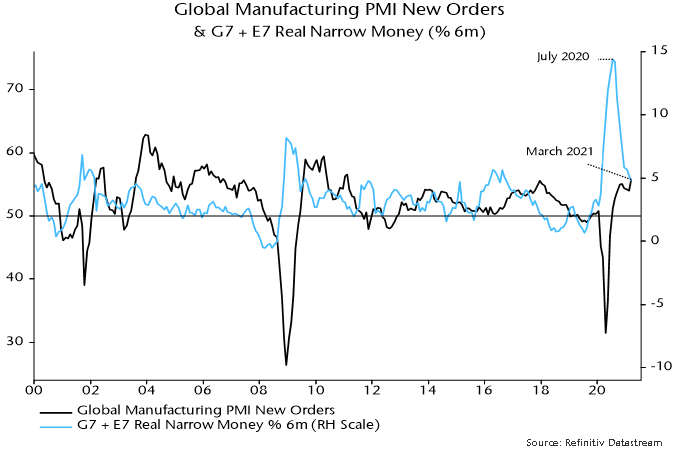
The global manufacturing PMI new orders index reached a new recovery high in March, consistent with a surge in six-month real narrow money growth into July / August 2020, allowing for the historical average 6-7 month lead time. More recent national surveys hint that March will mark a top – see chart 1.

Chart 1

The March real money growth estimate is based on information for the US, China, Japan, India and Brazil, together accounting for 70% of the G7 plus E7 aggregate tracked here. The US component is estimated from weekly data on currency in circulation and commercial bank deposits – official March money numbers are released next week and the Fed no longer provides weekly updates.

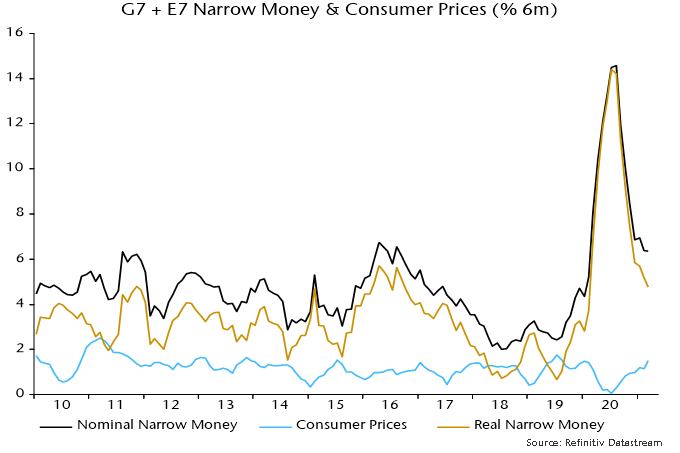
Global six-month real narrow money growth appears to have eased further to its lowest level since February 2020, reflecting stable nominal growth and another rise in six-month CPI inflation – charts 2 and 3.

Chart 2

Chart 3

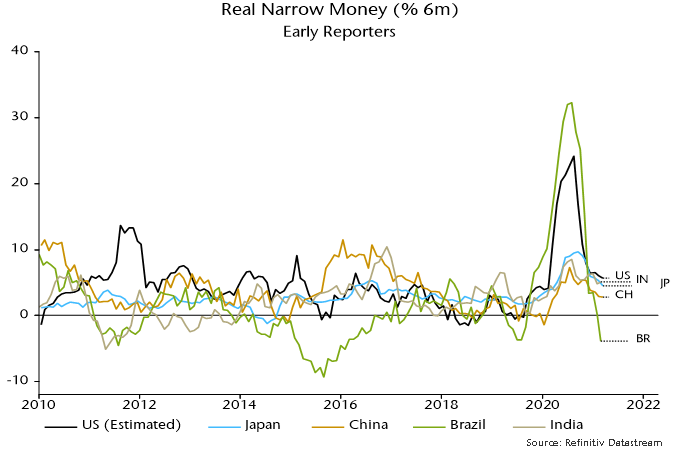
Chart 4 shows the early reporting countries individually. US six-month real narrow money growth is estimated to have edged lower despite disbursement of $318 bn of stimulus payments to households – these were made in the second half of the month and may have a larger impact in April (the money numbers are month averages).

Chart 4

Six-month growth also eased slightly further in Japan and China, with a small rise in India. Brazil moved into contraction although this needs to be placed in the context of an extraordinary surge last summer – 12-month growth is still strong.

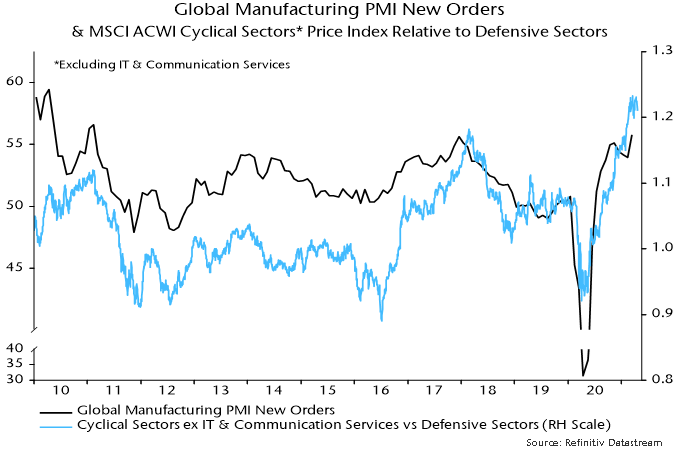
Markets could be starting to offer corroboration of the scenario of a global manufacturing PMI new orders peak and pull-back, with Treasury yields stalling and equity market cyclical sectors no longer outperforming – chart 5.

Chart 5

Will global six-month real narrow money growth recover? Six-month CPI inflation is likely to rise slightly further in April / May but could fall back in H2 as commodity prices move sideways or correct.

Fiscal stimulus is acting to push up US nominal money growth but there may be an offsetting drag across the G7 from recent bond yield rises – chart 6.

Chart 6

A revival in Chinese narrow money growth probably requires a PBoC policy shift. The view here has been that policy was overtightened in H2 2020 and the economy would slow in H1 2021. This scenario appears to be playing out, with Q1 GDP disappointing and industrial output falling in March. Core CPI inflation (i.e. ex. food and energy) is at 0.3% and a surge in PPI inflation reflects input cost rises that are squeezing downstream margins. The PBoC has allowed three-month SHIBOR to drift back to its January low, consistent with a switch to an easing bias – chart 7.

Chart 7

UK money numbers continued to show absolute and relative strength in February, suggesting a coming domestic demand boom with unfavourable balance of payments and inflation consequences.

Charts 1 and 2 compare six-month growth rates of real narrow and broad money across economies. The UK tops both rankings, with recent monetary reacceleration contrasting with ongoing slowdowns elsewhere (although US growth is turning up again as stimulus payments enter bank accounts).

Chart 1

Chart 2

The preferred UK broad money measure here – non-financial M4, comprising money holdings of households and private non-financial corporations (PNFCs) – grew by 16.0% in nominal terms in the year to February. The comparable Eurozone measure – non-financial M3 – rose by 12.5%. Annualised growth rates in the latest three months were 14.4% and 9.5% respectively.

The Bank of England’s M4ex broad money measure grew by a slightly lower 15.2% in the year to February, with its annualised rate of increase slowing to 9.7% in the latest three months. M4ex also includes money holdings of financial institutions, which have fallen over the last three months* but are of limited significance for near-term demand prospects.

UK broad money strength reflects the large fiscal deficit and its entire financing by money creation, i.e. net sterling lending to the government by the banking system, including the Bank of England – chart 3**.

Chart 3

In 1985 then Chancellor Nigel Lawson introduced the “full funding” rule, which required deficits (and any increase in foreign exchange reserves) to be financed by net debt sales to the UK non-bank private and overseas sectors, implying no public sector contribution to broad money growth. According to this concept there has been zero funding over the last 12 months – domestic and overseas “savers” made no contribution to financing the deficit, which has been mirrored pound-for-pound by an increase in the broad money stock.

In terms of the “credit counterparts” arithmetic, monetary financing accounted for 15.4 percentage points (pp) of the 16.0% growth of non-financial M4 in the year to February. A positive contribution of 3.6 pp from sterling lending to households and PNFCs was offset by a 3.1 pp drag from other counterparts*** – chart 4.

Chart 4

The chart shows that official money creation made an even larger contribution in 2009-10, reflecting the Bank of England’s post-GFC QE programme. This was, however, needed to offset private money destruction as banks attempted to meet regulatory demands to boost their capital ratios rapidly by contracting their lending and shedding other assets. The net result was low broad money growth and inflation. There is no actual or potential monetary shortage to counteract now, and hence no monetary justification for QE on the current scale.

Broad money growth would have been even faster but for a diversion of liquidity into sterling bank deposits of overseas residents – monetary aggregates include deposits of domestic residents only. Overseas deposits grew by £49 bn in the year to February, equivalent to 2.6% of non-financial M4. The recent rise is the largest since before the GFC, when liquidation of the overhang of foreign balances triggered a sharp fall in sterling – chart 5.

Chart 5

Strong domestic demand prospects typically imply upward pressure on the exchange rate as expectations for monetary policy adjust. With central banks now committed to prolonged interest rate suppression, this linkage has been broken. Instead, the prospect of unchecked demand strength suggests a bigger current account deterioration and falling real rates as inflation accelerates. Central banks may be rehabilitating the monetary theory of exchange rate determination, according to which a rise in the relative supply of a currency (in this case sterling) results in depreciation.

The consensus appears complacent about balance of payments risks: the average current account deficit forecast in the Treasury’s monthly survey is £80 bn in 2021 and £84 bn in 2022, essentially unchanged from £74 bn in 2020 (£79 bn excluding trade in precious metals). The view here remains that a major blow-out is possible, based on the historical relationship with broad money growth – chart 6 – and a Brexit hit to the UK’s global export share.

Chart 6

*Due to reductions in sterling bank deposits of fund managers, insurance companies and securities dealers.
**The deficit definition referred to here is public sector net borrowing excluding public sector banks (PSNB ex). The public sector net cash requirement (PSNCR) includes financial transactions and was larger than PSNB ex in the 12 months to February (£330 bn vs £286 bn), mainly reflecting Bank of England lending schemes and the student loan programme. Monetary financing accounted for 90% of the PSNCR over this period.
**Net sterling lending to UK financial institutions plus net overseas and foreign currency lending minus capital and other net non-deposit liabilities.