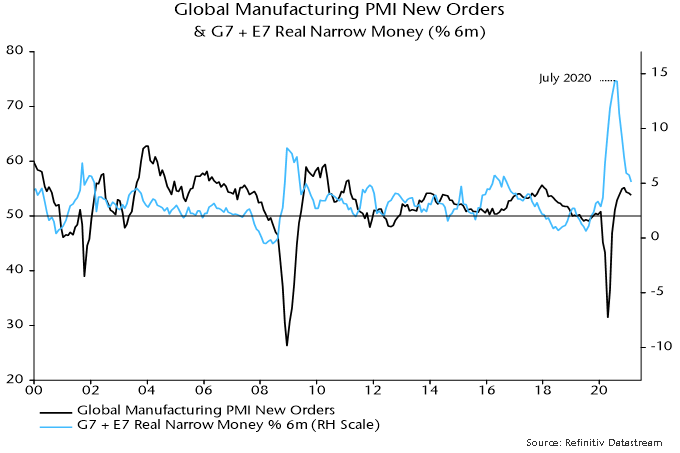
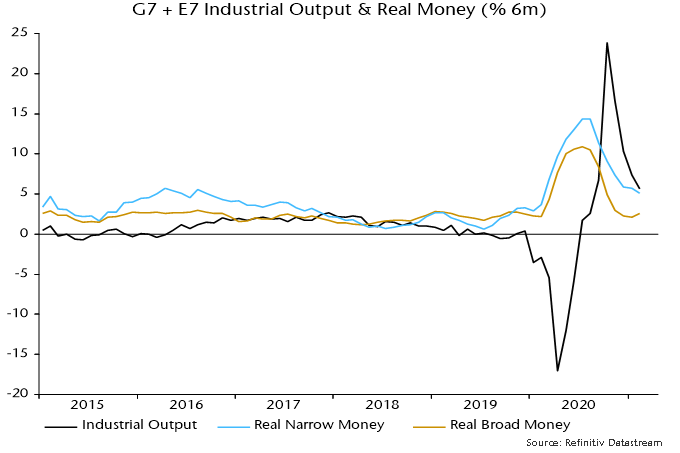
Global six-month real narrow money growth is estimated to have fallen further in February, based on monetary data covering 70% of the G7 plus E7 aggregate calculated here. The decline from a July 2020 peak suggests a slowdown in industrial momentum extending through Q3 2021.

Turning points in six-month real narrow money growth have led turning points in the global manufacturing PMI new orders index by 6-7 months on average historically. The July money growth peak, therefore, suggested a new orders peak in January-February. The current high point of the orders index is November 2020 but this may have been surpassed in March. These are details: the key point is that the index appears to be reaching a peak on schedule, with money trends suggesting a significant relapse by end-Q3.

Chart 1

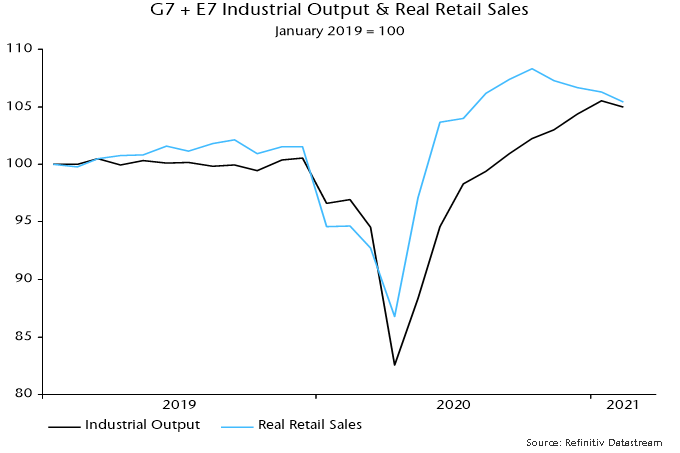
Cooler consumer goods demand is consistent with a coming industrial slowdown. Global retail sales fell between October and January, with early data suggesting another decline in February – chart 2.

Chart 2

Industrial output growth appears to have been sustained by a continued recovery in investment goods demand and – probably more importantly – a rebuilding of depleted inventories. Restocking, however, will have been accelerated by softer consumer goods demand and the associated output boost may be peaking.

A key point, often neglected, is that the level of industrial output is related to the rate of change of inventories. These are probably still lower than desired and restocking should continue. A slowdown in the rate of increase, however, is sufficient to exert a negative impact on the level of output.

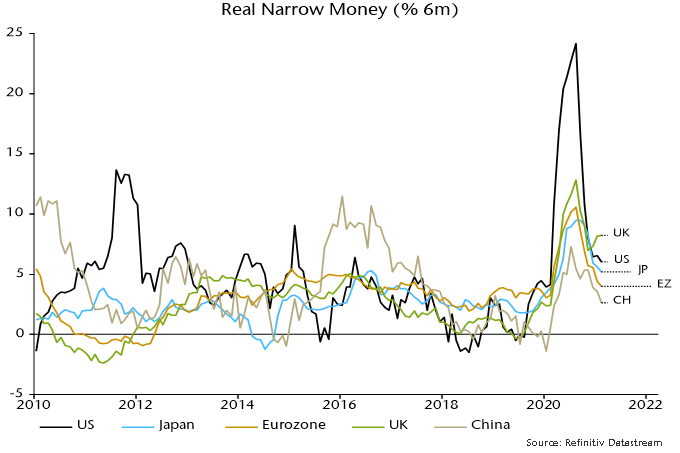
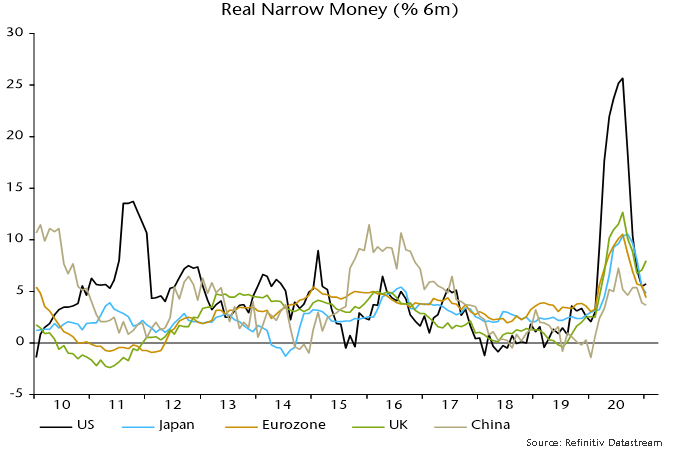
A normalisation of US six-month real narrow money growth has been a key driver of the slowdown in the global measure, although smaller declines have occurred elsewhere – chart 3. US money growth should rebound strongly in March / April as the Treasury transfers cash to households from its account at the Fed (i.e. helicopter money).

Chart 3

A US rebound could drive a pick-up in global six-month real narrow money growth, signalling industrial reacceleration in late 2021 / H1 2022. This isn’t guaranteed, however: a further inflation rise will drag on real money growth near term, while nominal money trends elsewhere may continue to cool.

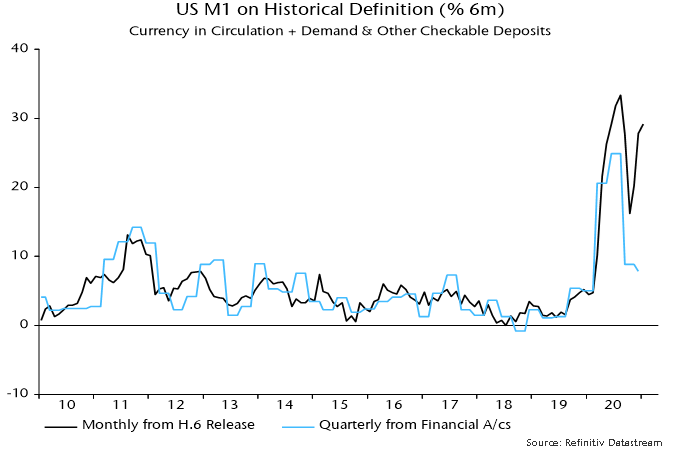
Analysis of US narrow money trends has been complicated by banks reclassifying some savings accounts as transactions accounts following a Fed decision to lift restrictions on the former. This artificially boosted the old M1 measure in 2020, particularly later in the year, when its six-month growth rate rebounded strongly – chart 4. The numbers used here attempt to correct for this distortion but the suggestion of a significant slowdown was disputed by some readers.

The debate has now been resolved by the recently released Q4 financial accounts – these contain M1 flow data adjusted for reclassifications and other discontinuities. The fall in six-month growth of the break-adjusted M1 series during H2 2020 was similar to that of the corrected measure calculated here.

Chart 4

A global industrial slowdown in Q2 / Q3 may not be reflected in GDP data because of services reopening. The latter, indeed, could contribute to industrial softening as consumer demand switches back from goods to services. The judgement here is that industrial trends are a better guide to underlying economic momentum and a more important driver of markets, partly reflecting a stronger correlation with equity market earnings.

A simple rule for switching between global equities and US dollar cash discussed in previous posts holds cash when six-month growth of global real narrow money is below that of industrial output. A negative cross-over occurred in October 2020 and – allowing for data publication lags – resulted in the switching rule recommending a move to cash at end-2020.

Real money growth was below industrial output growth in January and early indications are that this remained the case in February – chart 5. The rule, therefore, will continue to recommend cash in April and, probably, May. The rule is currently about 4% offside since the end-December switch. Such a drawdown is not unusual and compares with a 32% gain when the rule was in equities between end-April and end-December 2020.

Chart 5

Chinese money trends have been signalling an economic slowdown in H1 2020. This appears to be playing out but the PBoC has kept policy tight and narrow money growth has fallen further in early 2020. A Chinese slowdown could derail current global reflation optimism.

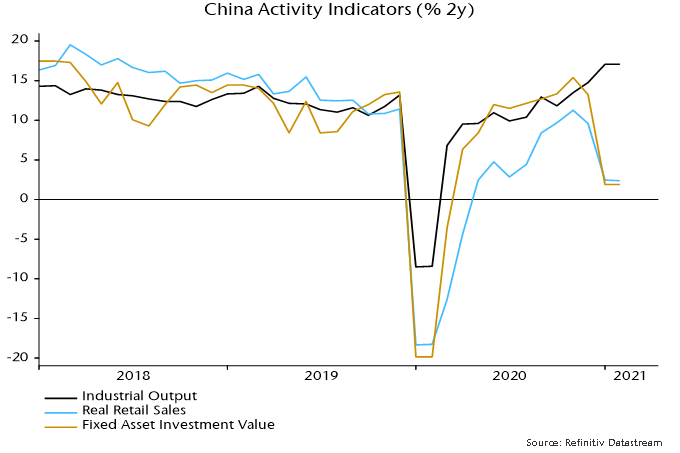
Covid base effects are distorting year-on-year growth rates of coincident economic indicators so a two-year comparison is more informative. Retail sales and fixed asset investment slowed sharply in January / February but industrial output gained further momentum – see chart 1.

Chart 1

Output strength is probably explained by additional working days due to covid travel restrictions that shortened workers’ holidays and reduced factory idling – this suggests payback in March / April. The NBS PMI manufacturing new orders index peaked in November and fell to its lowest since June last month.

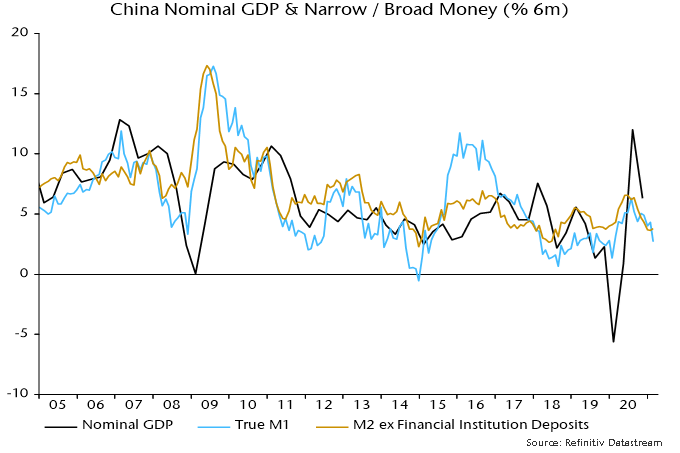
An economic slowdown had been signalled by money trends: six-month growth rates of narrow and broad money peaked over May-July 2020 at modest historical levels, moving lower during H2 – chart 2.

Chart 2

Six-month broad money growth stabilised in early 2021 but is below the post-GFC average, while narrow money growth has fallen further. Sectoral detail shows weaker expansion of both household and enterprise narrow money holdings, consistent with the joint slowdown in retail sales and private investment.

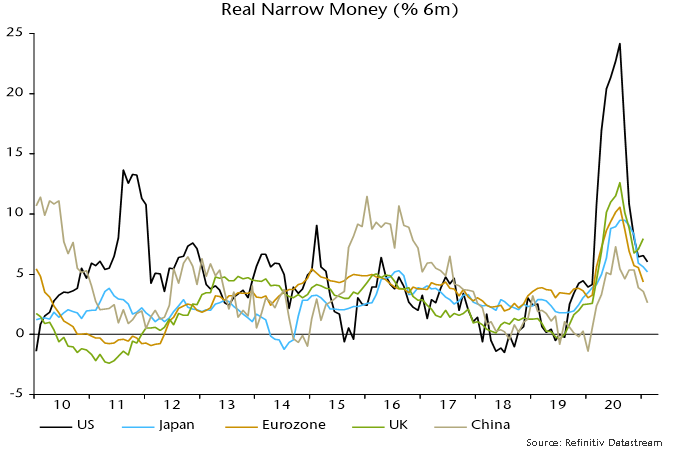
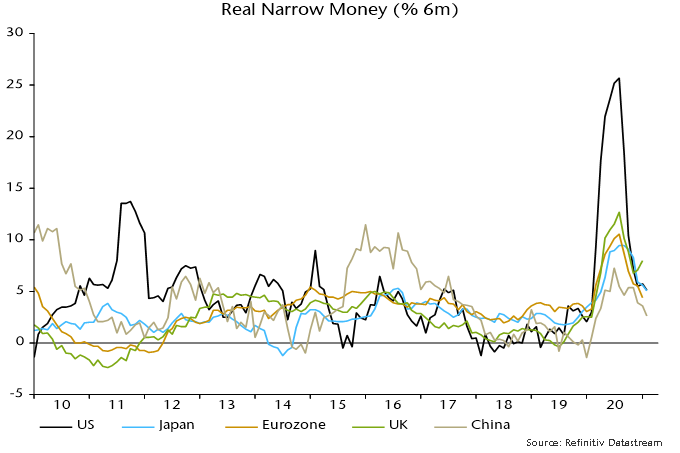
China has retained its bottom place in a ranking of six-month real narrow money growth across major economies despite falls elsewhere – chart 3.

Chart 3

The expectation here had been that the PBoC would respond to early economic slowdown signs by partially reversing its H2 2020 policy tightening. Instead, it withdrew liquidity before the holiday to protest an easing of money market rates in December / January. Three-month SHIBOR has backed up to 2.7%, almost double its low in April / May 2020.

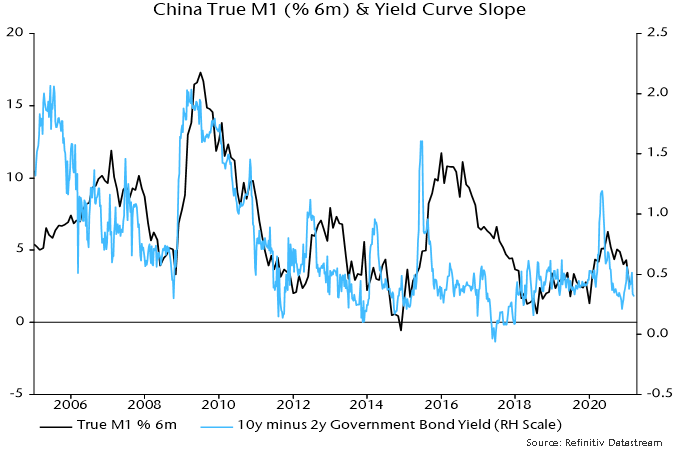
The suggestion that monetary policy is restrictive is supported by a flat yield curve – chart 4 – and weak core inflation: consumer prices ex. food and energy were unchanged in February from a year before.

Chart 4

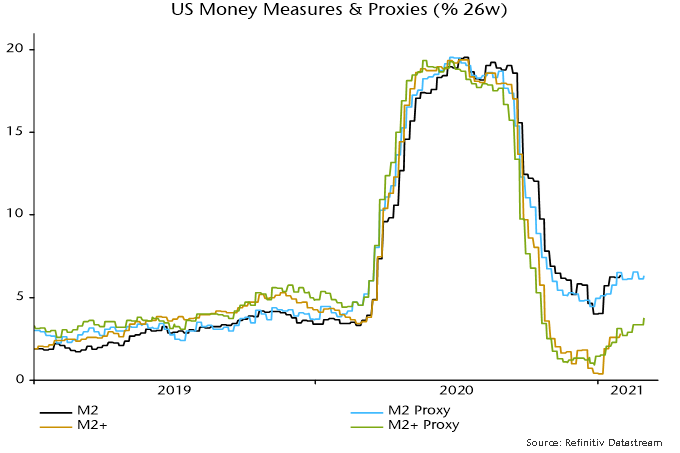
China led last year’s economic recovery and the expectation here has been that a Chinese slowdown would presage a loss of global industrial momentum into Q3 2020. Assuming that this scenario plays out, a key question is whether new US fiscal stimulus will drive a growth rebound during H2. This will hinge on the extent to which another deficit blowout in Q2 / Q3 is reflected in US money trends. Growth of the weekly broad money series calculated here has firmed slightly – chart 5 – and a significant pick-up is likely in late March / April as households receive stimulus payments.

Chart 5

Last year’s US (and global) broad money surge is expected, on the “monetarist” view, to be reflected in a significant inflation rise over 2021-22. US broad money* growth, however, has normalised recently: six-month expansion has retreated from 41% at an annualised rate in July to 4.3% in January. Stabilisation at the current pace would suggest an eventual return of low inflation.

A key driver of the broad money slowdown has been a narrowing of the federal budget deficit after its H1 2020 blowout. The six-month rolling shortfall declined from $2.42 trn to $1.06 trn between July and January. Monetary deficit financing – net lending to the federal government by the Fed, commercial banks and money funds – has fallen accordingly.

President Biden’s stimulus package will drive another deficit surge and a reasonable base case scenario is that this will be associated with a rebound in monetary financing and broad money growth, with unfavourable implications for medium-term inflation prospects.

This monetary scenario, however, is not guaranteed.

Monetary financing by the Fed will rise substantially as the recent pace of Treasury purchases is maintained and the Treasury runs down its deposit balance at the Fed to finance the stimulus package and comply with the 2019 Bipartisan Budget Act. This could, however, be offset by reduced purchases, or even sales, by commercial banks and money funds, reflecting Treasury plans to reduce bill supply and a constraint on banks’ balance sheet expansion from the supplementary leverage ratio (SLR), assuming that this is not relaxed. The recent rise in Treasury yields could attract buying from “real money” domestic investors and foreigners, implying an increase in non-monetary financing of the deficit.

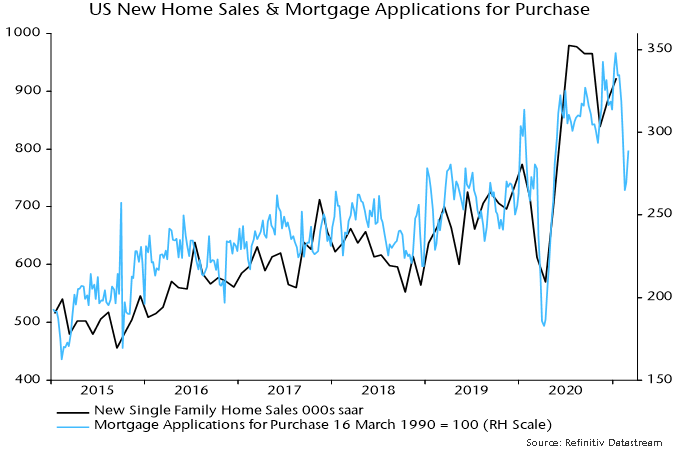
Higher yields could also dampen money growth via their impact on private sector credit demand. The jump in mortgage rates has already been reflected in a fall in mortgage applications for house purchase – chart 1. Growth of commercial banks’ lending book will continue to be dragged down by forgiveness of Payment Protection Program (PPP) loans: of the $521 bn of advances in 2020, only $169 bn had been forgiven as of 4 March.

Chart 1

The upshot is that broad money reacceleration is likely but not certain and there is no alternative to monitoring the incoming monetary data to judge whether another inflationary boost is in the pipeline.

It is, therefore, unfortunate that the Fed recently ended publication of weekly monetary data while pushing back the release of monthly figures to the fourth Tuesday of each month.

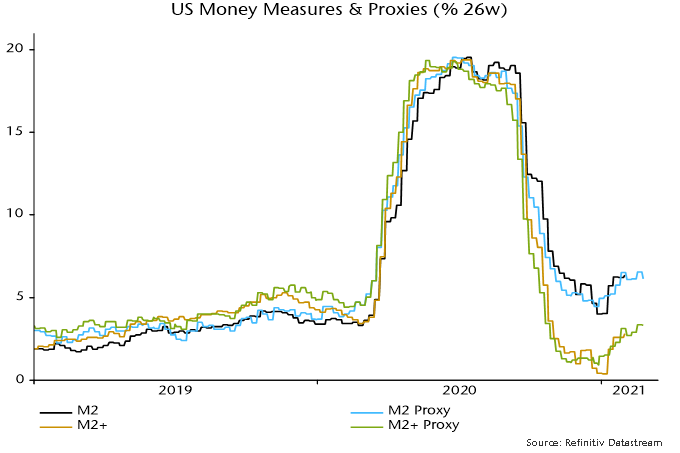
Timely monitoring of monetary trends, however, is still possible using alternative sources of weekly data for currency in circulation, commercial bank deposits and money funds. Chart 2 shows 26-week growth rates (not annualised) of broad money* and M2 up to the final week of Fed data (ending 1 February) along with growth of proxy measures calculated from the alternative sources. Broad money growth remains modest but has firmed since year-end ahead of the expected fiscal package boost. The extent of any further pick-up will be key for assessing medium-term inflation danger.

Chart 2

*”Broad money” refers to “M2+”, calculated as M2 plus large time deposits at commercial banks and institutional money funds.

UK broad and narrow money measures continue to surge, with growth now significantly above that in the Eurozone – a reversal of the norm in recent years. This suggests strong near-term prospects for domestic demand and support for UK equity prices but at the likely cost of a sizeable deterioration in the balance of payments combined with much higher inflation.

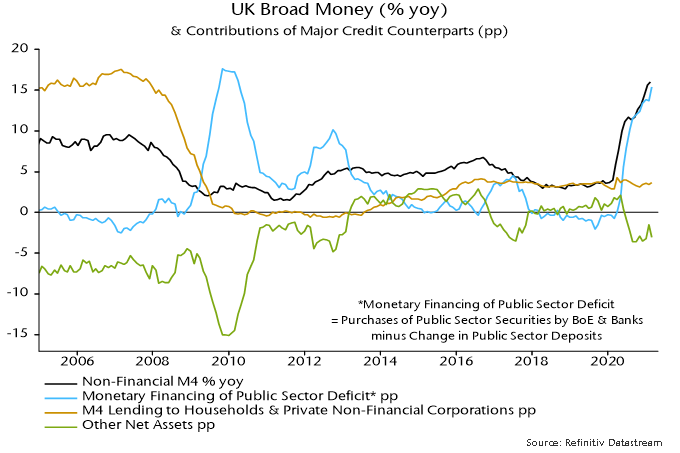
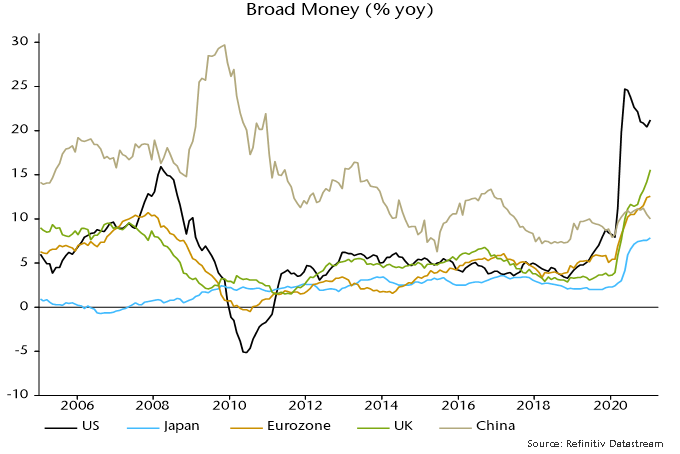
Annual growth of the preferred broad money measure here – non-financial M4, comprising money holdings of households and private non-financial corporations – rose further to 15.6% in January, the highest since 1989. Eurozone money growth on a comparable measure – non-financial M3 – was 12.5%.

Chart 1

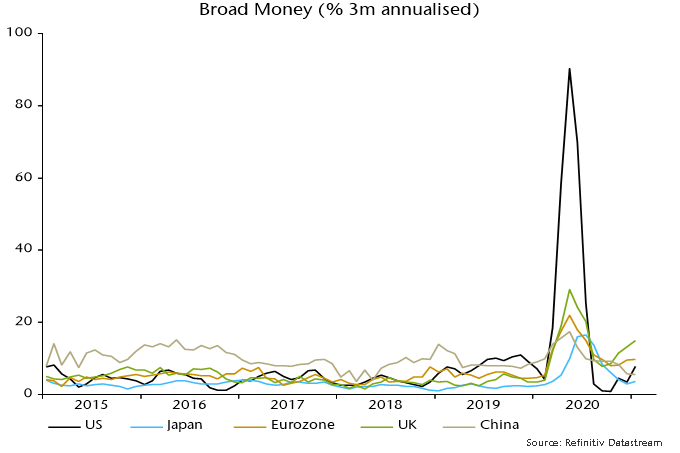
Annual broad money growth remains strongest in the US but the UK has moved into the lead on a three-month comparison: UK annualised expansion of 14.9% over November-January compares with 7.8% in the US and 9.8% in the Eurozone – chart 2.

Chart 2

The Bank of England has suggested that household bank deposits have been boosted by a recent outflow from National Savings but this provides, at best, only a partial explanation of broad money strength. A wider aggregate including National Savings and foreign currency deposits grew by 11.4% annualised in the latest three months.

The National Savings effect, in any case, may have been offset by an outflow from bank deposits to purchase unit trusts and OEICs: inflows to retail funds totalled £14.5 billion in November / December, according to the Investment Association, compared with a £9.1 billion outflow from National Savings over the same two months.

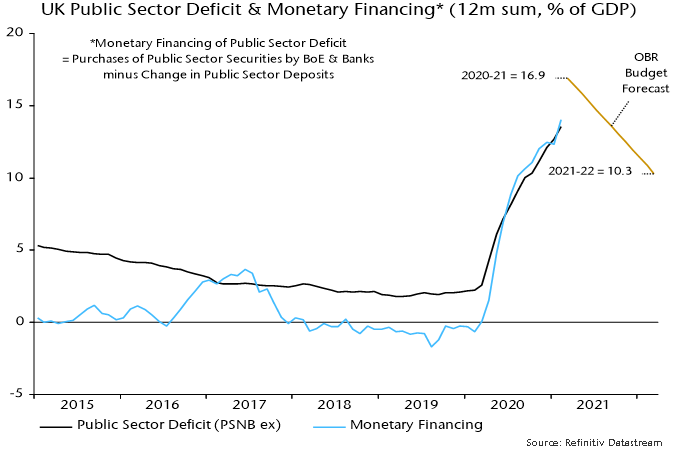
Why has UK broad money growth strengthened relative to trends elsewhere? The UK has been running a larger fiscal deficit and funding this almost wholly through the banking system. “Monetary financing” – net lending to government by the Bank of England and other monetary financial institutions – totalled £261 billion in the 12 months to January, equivalent to 93% of public sector net borrowing of £279 billion.

Monetary financing contributed (in an accounting sense) 13.7 percentage points (pp) to annual non-financial M4 growth of 15.6% in January; the equivalent contribution to non-financial M3 growth in the Eurozone was 7.4 pp.

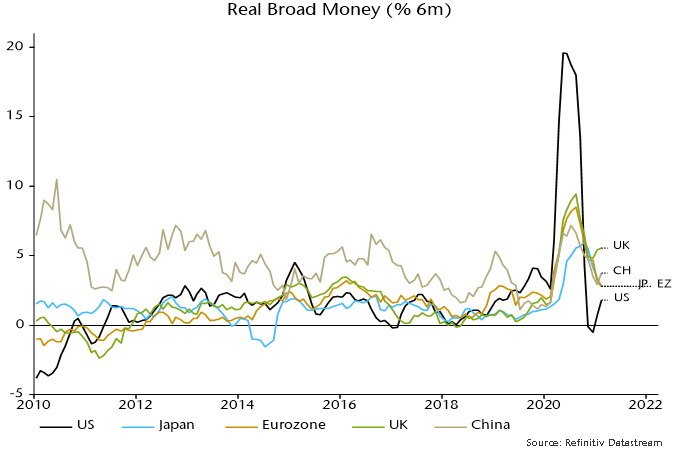
Broad money trends set the medium-term path for nominal demand, incomes and inflation but narrow money is a better guide to short-term economic prospects. Six-month growth of real narrow money (non-financial M1 deflated by consumer prices) has risen since November and is stronger than in other major economies  – chart 3.

Chart 3

Six-month real narrow money growth was consistently lower than in the Eurozone over 2017-19, a period during which UK GDP lagged Eurozone growth by 1.4 pp (i.e. measured between Q4 2016 and Q4 2019). UK equities returned 5.1% less than Eurozone equities in the three years to end-2019, with underperformance accelerating last year, according to MSCI US dollar indices. With Eurozone six-month real narrow money growth continuing to moderate, the current UK lead is the largest since 2002.

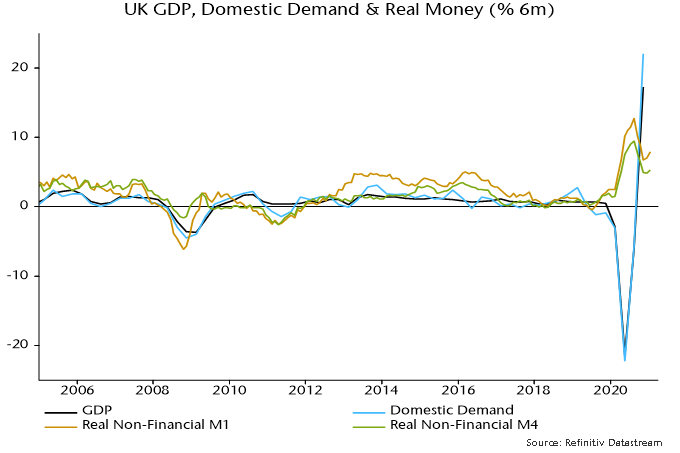
The rebound in six-month real money growth since November from an already strong level suggests a monetary boost to domestic demand and GDP momentum during H2 2021. This could interact with economic reopening to generate boom conditions by early 2022.

Chart 4

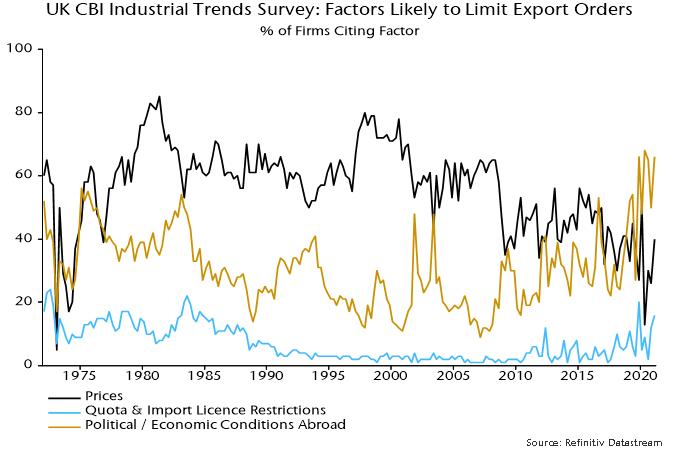
Domestic demand strength has been associated historically with rapid growth of imports and a worsening current account position. The impact could be magnified on this occasion by supply-side damage from the pandemic and a Brexit drag on exports. The CBI quarterly industrial trends survey asks manufacturers whether specified factors are acting to limit export orders. The Brexit effect is probably captured under “quota and import licence restrictions” and “political or economic conditions abroad”. The percentage citing the former is the highest since the 1980s, while the series for political / economic conditions abroad reached a record before the covid shock, rising further since. The percentage of firms expressing concern about price competitiveness, by contrast, is below the long-run historical average, though has increased as sterling has appreciated – chart 5.

Chart 5

Services exporters are expected to be harder hit than manufacturers because of the omission of services from the trade agreement with the EU.

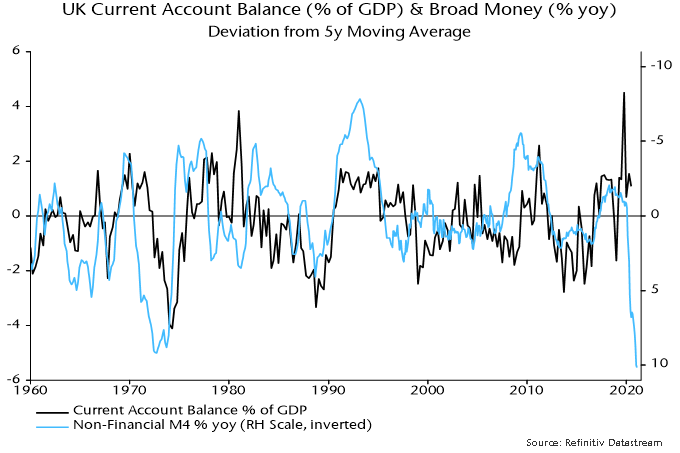
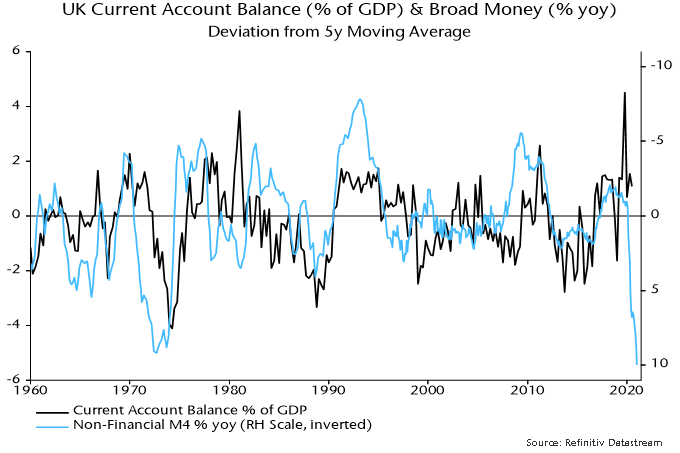
Chart 6 shows that the current account position has tended to deteriorate following a rise in broad money growth relative to the medium-term trend (plotted inverted), although often with a significant lag. A comparable money growth surge in 1971-72 was associated with the current account moving from surplus in 1972 to a deficit of 3.9% of GDP in H1 1974. The starting position now is worse, with a deficit of 2.9% of GDP in Q3 2020.

Chart 6

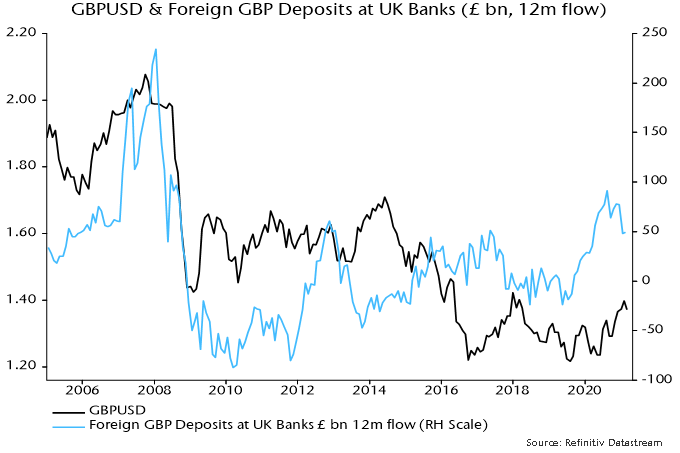
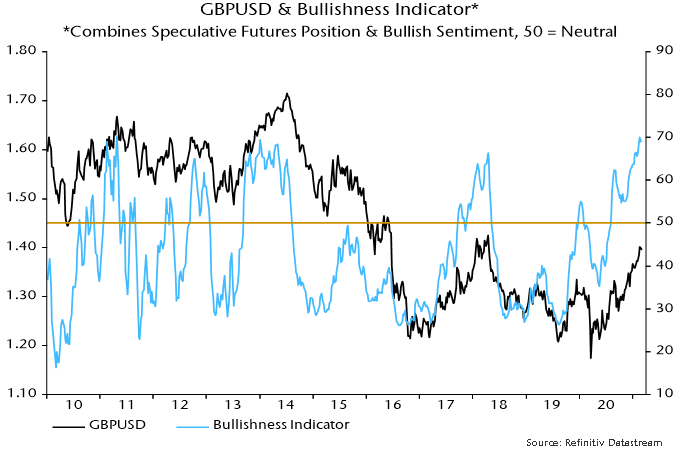
A blowout in the current account deficit would suggest medium-term downward pressure on sterling. A strong economic rebound might be expected to provide near-term support for the currency but speculators are already long and worries about the inflationary implications of fiscal dominance of monetary policy could bring forward weakness. An indicator combining speculative futures positioning and bullish sentiment as measured by Consensus Inc. is at the top of its range in recent years, suggesting a pause in sterling’s rally, at least – chart 7.

Chart 7

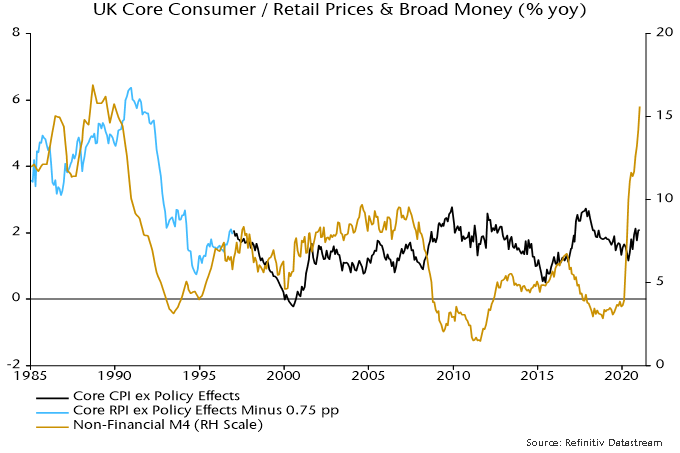
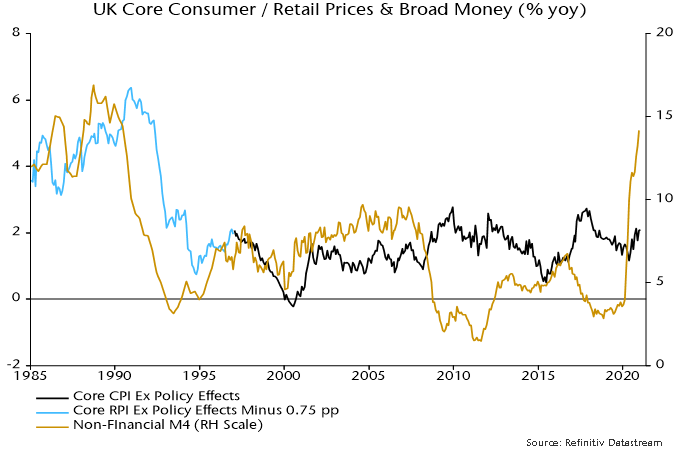
A fall in sterling has been a standard feature of the transmission of rapid UK money growth into inflation. As previously discussed, annual broad money growth has led turning points in annual core CPI / RPI inflation by an average of 26-27 months since WW2. With money growth still rising in January 2021, core inflation may pick up into early 2023, at least.

Chart 8

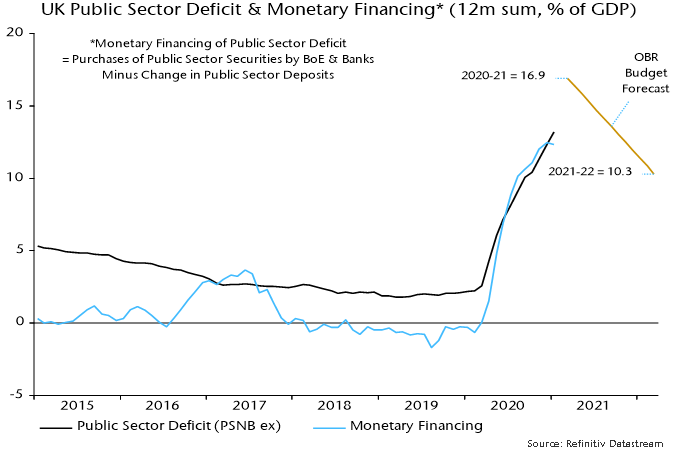
Annual broad money growth will moderate as bumper monthly rises over March-May 2020 drop out of the calculation but fiscal / monetary plans suggest that it will remain high. The MPC decided at its November meeting to buy an additional £150 billion of gilts during 2021, equivalent to 6.9% of the stock of non-financial M4 at the start of the year. Fiscal financing needs may call forth more QE, with the OBR now expecting borrowing of £234 billion in 2021-22, up from £164 billion in November and equivalent to 10.3% of GDP – chart 9.

Chart 9

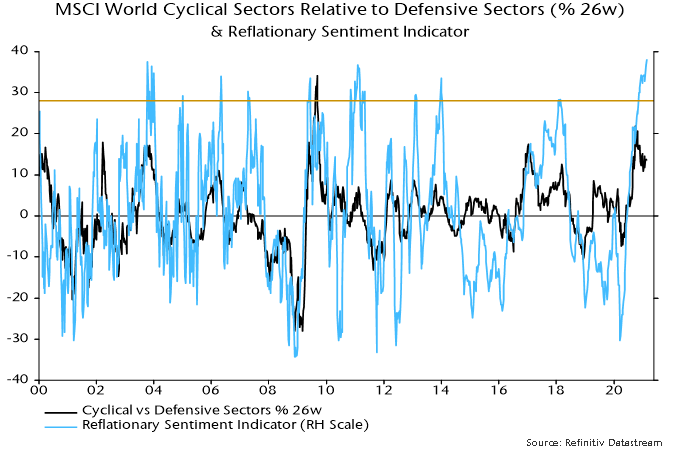
Reflationary sentiment in markets is extreme, suggesting that investors should be cautious about chasing cyclical assets and inflation hedges.

The chart updates the reflationary sentiment indicator calculated here by combining bullish sentiment data sourced from Consensus Inc. for various markets that have correlated (positively or negatively) with global economic momentum historically. This week’s reading is a record in data extending back to 2000.

The sentiment indicator, unsurprisingly, correlates positively with the relative performance of MSCI World cyclical equity market sectors* but extreme readings often signal a short-term turning point.

Indicator values above the 95th percentile of the distribution over 2000-19 (the horizontal line) were associated with an average decline of 6.6% in the ratio of cyclical to defensive sectors within the following six months (i.e. from the starting level to the low point over that period). The range was -1.5% to -13.3%.

The maximum rise within the six months following an extreme positive indicator reading averaged 1.6%. In 8 of the 37 weekly cases, the sentiment extreme marked the high point of the cyclical to defensive sectors relative.

The time to switch to a pro-cyclical investment strategy was March last year when the sentiment indicator was at an opposite extreme and money measures were surging, suggesting strong support for economies and markets.

Global six-month real narrow money growth peaked in July 2020 and appears to have fallen further in January – an update will be provided following the release of remaining January country data over coming days.

*Cyclical sectors (MSCI definition) = materials, industrials, consumer discretionary, financials, real estate, IT and communication services. Defensive sectors = energy, consumer staples, health care and utilities.

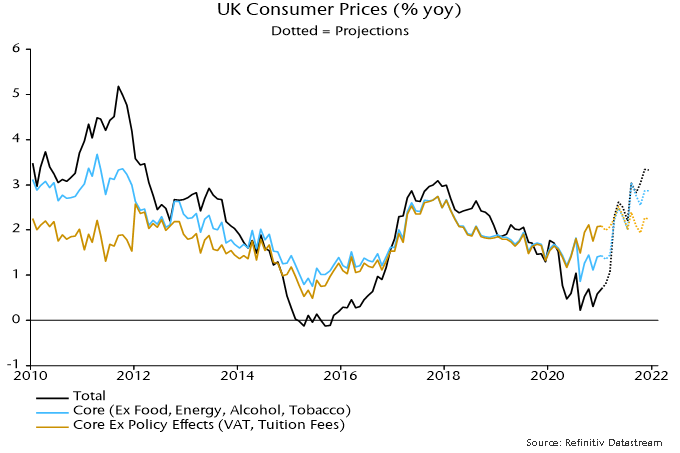
An article in November presented a “monetarist” forecast of a rise in UK annual CPI inflation to 3.2% in Q4 2021, far above the Bank of England’s central projection of 2.1% (reduced to 1.9% in February). News since then has been consistent with the assumptions underlying the forecast, which is maintained.

January inflation of 0.7% was slightly above the forecast for the month made in November.

Economists share the Bank’s relaxed view of prospects. The median Q4 projection in the Treasury’s latest survey of independent forecasters is 2.0%. Only one contributor expects an outturn above 3%*.

The assumptions underlying the forecast are set out below but the key differences from the Bank / consensus are 1) a larger rise in global commodity prices and associated stronger paths for energy / food inflation, 2) a more pessimistic assessment of current core trends, and 3) an expected increase in core inflation in response to last year’s broad money surge.

The commodity price view is on track, with the Brent oil price up by 40% since November and Ofgem hiking the energy price cap by 9% from April – above a 5% assumption in the November forecast. The FAO world food price index, meanwhile, rose by 7% between November and January, pushing annual growth up to 11%.

The preferred broad money measure here (i.e. non-financial M4, comprising money holdings of households and private non-financial corporations) continued to rise strongly in November / December, with annual growth now at a 31-year high of 14.2% – see chart 1.

Chart 1 

Previous research documented a leading relationship between broad money growth and core CPI / RPI inflation in post-WW2 data, with an average lead time at turning points of 26-27 months. The lead, however, varied widely and was affected particularly by exchange rate developments. A fall in money growth in the late 1990s, for example, was swiftly reflected in core inflation because of prior sterling strength. The lead was much longer after the GFC, when a large fall in the currency placed extended upward pressure on import prices.

Sterling’s effective rate has firmed 3% since November but is little changed from a year ago. A reasonable assumption, therefore, is that the lead time from money growth to core inflation will conform to historical average experience, implying a rising core rate through end-2022, at least.

An assessment of current core trends is complicated by the temporary VAT cut for hospitality and tourism. The assumption here is that one-third of this cut was reflected in prices, in which case core inflation (i.e. ex. energy, food, alcohol and tobacco) of 1.4% in January is understated by 0.7 percentage points (pp). The Bank of England and consensus assume that pass-through was much lower.

The forecast, accordingly, assumes a 0.6 pp boost to published core inflation when VAT for these industries is normalised – currently scheduled for April but possibly to be delayed**. The Bank / consensus view, by contrast, implies little impact. The VAT reversion is likely to coincide with excess demand for these services as the economy reopens, suggesting scope for providers to hike prices to protect current margins – the assumption of one-third pass-through could be too conservative.

Chart 2 shows projections for headline inflation, the published core measure and the policy-adjusted core series calculated here. These incorporate the same assumptions as in November, except for a small change in the Ofgem energy price cap.A rise in inflation for food, alcohol and tobacco to 2.0% in December 2021 (2010-19 average = 2.5%, January = 0.4%).

A return of vehicle fuel prices to their pre-covid level (unleaded petrol = £1.28 per litre).

A further 3% increase in the Ofgem energy price cap in October.

Monthly growth in core prices excluding tax effects of 2.25% at an annualised rate.

Chart 2

Note that the headline and published core rates will be artificially high in Q4 because of a reversal of the VAT effect. This distortion will end in April 2022, assuming that VAT is normalised in April 2021. Adjusted core inflation, however, is likely to have risen further by then, suggesting limited decline in headline / published core rates.

What could derail this forecast? A significant further rise in the exchange rate could push back an inflation pick-up but bullish positioning in sterling may already be extreme, judging from Consensus Inc. sentiment and US CFTC futures data – risks may now be skewed to the downside.

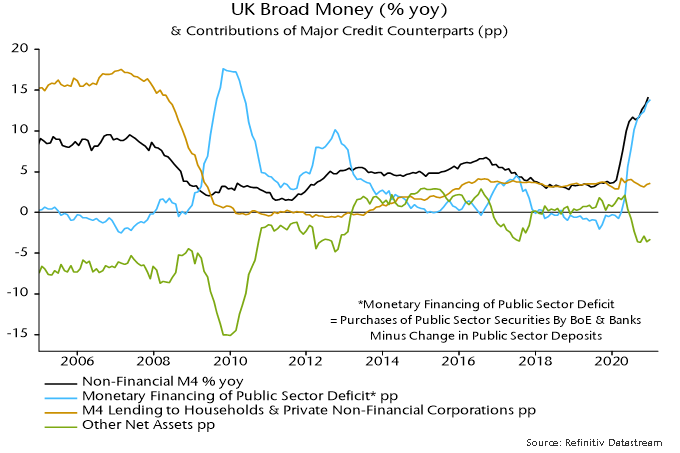
Inflation prospects beyond 2021-22 will depend on broad money developments this year. Monetary deficit financing has given as large a boost to broad money growth in the UK as in the US – chart 3. With little appetite for fiscal restraint***, and the Bank of England restored to its historical role of government financing arm, it is likely to remain a significant driver this year, suggesting low probability of money growth returning to its post-GFC average (i.e. over 2010-19) of 4.2%.

Chart 3

*Economic Perspectives (Peter Warburton).
**The impact is asymmetric because of changes in weights.
***The claim that low bond yields “make it a good time for governments to borrow” is misleading, because deficits are being financed by monetary expansion (and an implicit future inflation tax) rather than borrowing from savers: low yields would be unlikely to survive a switch to non-monetary financing.

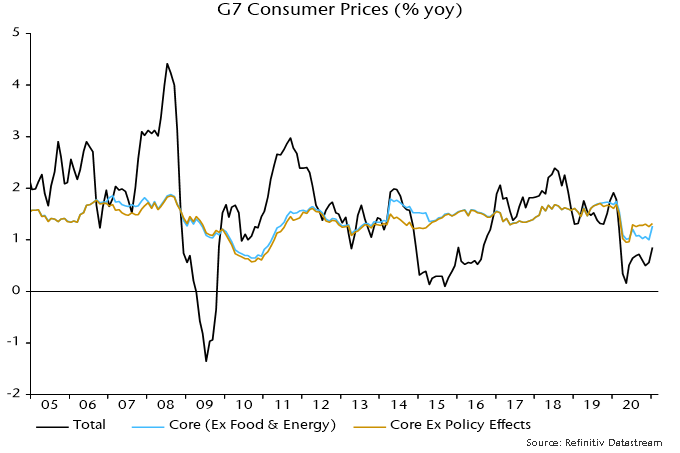
G7 headline consumer price inflation will spike in H1 2021, possibly reaching 3-4%, which would mark a 13-year high. Central banks will portray the rise as a temporary blip but the “monetarist” view is that higher inflation is related to the 2020 broad money surge and will be sustained into 2022. A key issue is whether G7 broad money growth will return to its low post-Global Financial Crisis (GFC) average in 2021. Monetary financing of enlarged fiscal deficits was the key driver of the 2020 surge and is likely to remain a significant contributor in 2021, suggesting that broad money will grow by 5-10% over the course of the year.

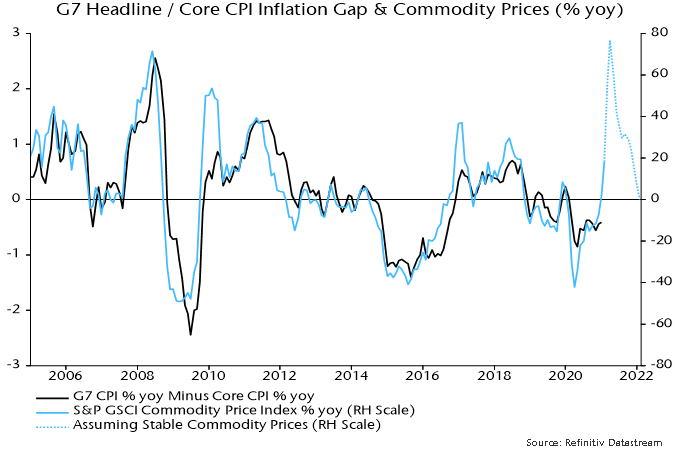
G7 core CPI inflation, i.e. excluding food / energy and adjusting for policy effects such as VAT changes in Germany / the UK and Japan’s travel subsidy programme, is estimated to have been stable at 1.3% in January – see chart 1. Mainstream forecasters had expected a significant fall in response to last year’s economic weakness but the latest reading is exactly in line with the post-GFC average (i.e. over 2010-19).

Chart 1

Headline inflation remained below core in January but the headline / core gap will spike during H1, reflecting recent commodity price strength and base effects. The relationship in chart 2 suggests that the gap will reach 2 percentage points or more, in which case stable core inflation of 1.3% would imply a headline rate peak of 3-4%.

Chart 2

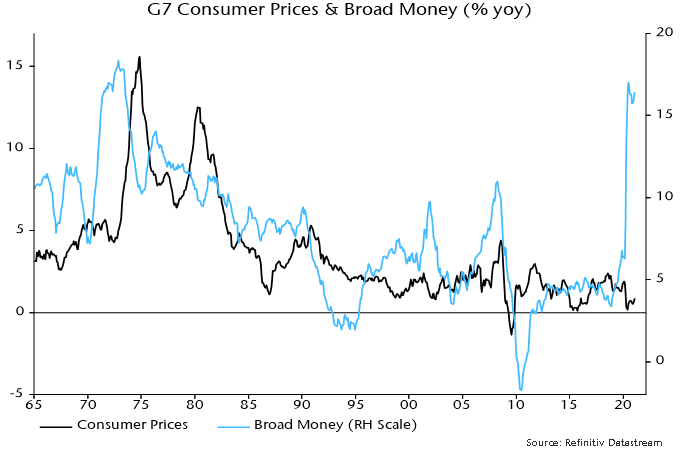
Central banks and the consensus are expecting a pick-up, though probably not on this scale. The official response will be insouciance – an inflation comeback, it will be argued, would be welcome but the rise is temporary / technical, with output gapology signalling future weakness. Headline inflation is indeed likely to retreat during H2 but the “monetarist” view is that it will continue to exceed forecasts into 2022, reflecting last year’s broad money surge and an average two-year lead from money to prices. Commodity prices may strengthen further later in 2021, with core inflation lifting into 2022.

Chart 3

Medium-term inflation prospects, on this view, hinge critically on whether G7 broad money growth will return to around its low post-GFC average of 3.7% during 2021. Annual growth, estimated at 16.4% in January, will fall sharply from March as negative base effects kick in but the central case here is that it will end the year at 5-10%, consistent with a lasting inflation upshift.

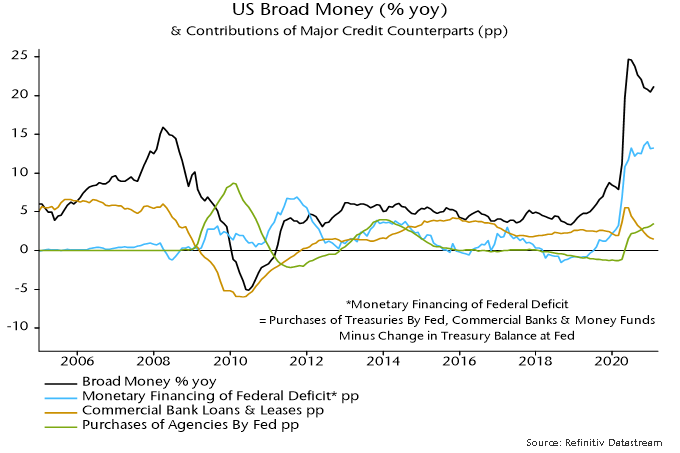
The central case recognises that monetary financing of fiscal deficits was the key driver of the broad money surge and – with deficits remaining large – is likely to make another sizeable contribution this year. Bank lending to the private sector is projected to grow weakly but not to contract, as it did after the GFC as banks sought to pare their balance sheets to boost capital ratios.

Chart 4 shows the main credit counterparts of US broad money* growth. Monetary deficit financing – defined as net lending to the federal government by the Fed and private monetary institutions – accounted for an estimated 13.2 percentage points (pp) of annual broad money growth of 21.2% in January. The Fed’s purchases of agency MBS added a further 3.5 pp, with growth of commercial banks’ loans and leases contributing only 1.5 pp.

Chart 4

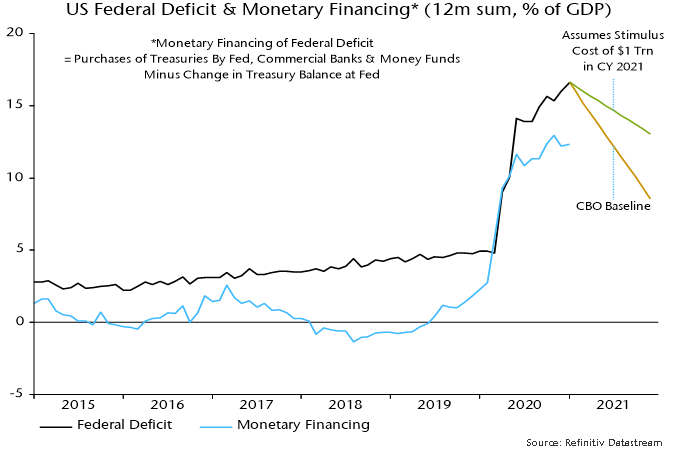
The rise in monetary financing mirrored the blow-out of the federal deficit, which reached 16.0% of GDP in 2020 – chart 5. Non-monetary financing as a share of GDP – the gap between the black and blue lines – was slightly larger in 2020 than in 2019, though smaller than in 2018.

Chart 5

The CBO’s revised baseline budget forecasts released last week suggested a fall in the federal deficit to below 9% of GDP in 2021 on unchanged policies. President Biden’s stimulus package could, on a conservative estimate, maintain it at about 13% of GDP. Assuming that monetary financing covers the same proportion as in 2020, the implied contribution to broad money growth in the 12 months to December 2021 would be about 9 pp.
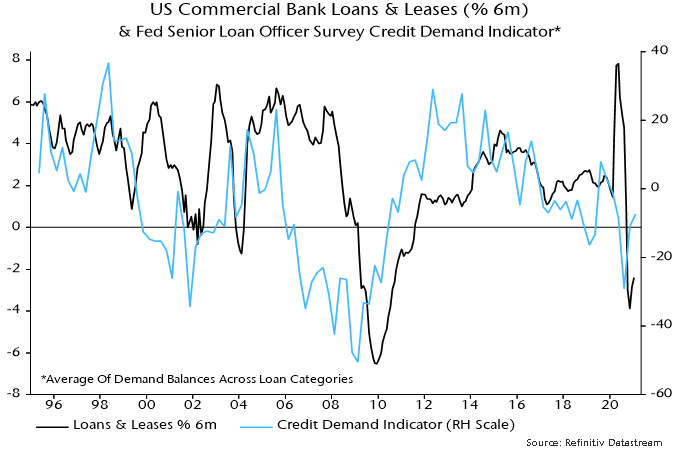
Will a contraction in commercial bank lending pull down broad money growth, as it did after the GFC recession? The latest Fed senior loan officer survey reported a reduction in credit tightening along with a modest recovery in demand – chart 6. Bank lending may make little contribution to money growth in 2021 but is unlikely to be a major drag.

Chart 6

Fed purchases of agency MBS are running at $40 bn per month, suggesting a 2 pp contribution to broad money growth over a year. Other credit counterparts could conceivably have a negative impact (e.g. banks’ net external lending if capital were to flow out of the US in scale) but a reasonable base case is money growth of at least 5% during 2021 and probably significantly higher.

A similar argument applies in other G7 economies. Monetary deficit financing accounts for the bulk of recent UK broad money growth and has also been a key influence in the Eurozone. Fiscal deficits may show an earlier decline than in the US but bank lending to the private sector could make a larger contribution, reflecting official subsidy and guarantee schemes.
*M2 plus large time deposits at commercial banks plus institutional money funds.
Global industrial momentum appears to have peaked and is forecast to move lower into Q2. This poses a risk to reflation-positioned markets.

The global manufacturing PMI new orders index – a timely summary measure of economic momentum – declined for a second month in January. The January fall was cushioned by a jump higher in the US component, possibly reflecting optimism engendered by the Biden administration’s fiscal plans. New orders in the alternative ISM manufacturing survey eased last month.

The forecast of a slowdown in industrial momentum is based on a decline in global (i.e. G7 plus E7) six-month real narrow money growth from a July 2020 peak. Full December monetary data confirm a further fall – see chart 1. Real money growth has led turning points in global manufacturing PMI new orders by 6-7 months on average historically, suggesting that the latter will move lower into mid-year. (Caveat: the lead time at the recent peak was four months, assuming that a November top in manufacturing PMI new orders is confirmed.)

Chart 1

Feb04_2021_Chart-1_Global_Manufacturing_PMI_New_Orders

Monetary trends had suggested that China would lead an early 2021 economic slowdown. Chinese money growth picked up relatively modestly last year and slowed later on as the PBoC allowed money rates to rise sharply. Chinese manufacturing PMI new orders fell significantly in January in both the Markit survey (incorporated in the global PMI) and the NBS alternative. The surveys also reported a rise in in finished goods inventories. The differential between NBS new orders and inventories correlates with and often leads global manufacturing PMI new orders – chart 2.

Chart 2

Feb04_2021_Chart-2_Global_Manufacturing_PMI_New_Orders

The expectation here had been that the PBoC would recognise downside economic risks and engineer a reversal lower in money rates. This seemed to be playing out, with three-month SHIBOR falling through December and most of January. The PBoC, however, appears to have regarded the decline as excessive and restricted liquidity supply around month-end, causing very short-term rates to spike temporarily. This risks extending the monetary slowdown.

The OECD’s leading indicators support the suggestion that global economic momentum is peaking. The OECD altered the calculation method for its indicators at the start of the pandemic without making this explicit in official documentation. This caused a break in the data that clouds interpretation. Chart 3 shows six-month growth of the G7 indicator calculated on the “old” basis, as well as a Chinese indicator that attempts to replicate the components of the OECD’s US leading indicator. The G7 indicator seems to be confirming an earlier growth peak in the Chinese series.

Chart 3

Feb04_2021_Chart-3_G7+China_Leading_Indicators

The V-shaped recovery in global industrial output during H2 2020 partly reflected a diversion of consumer spending from services to goods. G7 plus E7 real retail sales, however, fell back in late 2020 – chart 4.

Chart 4

Feb04_2021_Chart-4_G7+E7_Industrial_Output_Real_Retail_Sales

Forecasters argue that strong industrial output growth will be sustained by a rebound in stockbuilding as firms replenish depleted inventories. The view here has been that the stockbuilding cycle bottomed in Q2 2020 and is unlikely to peak before early 2022. Cycle upswings, however, typically play out in an a-b-c pattern and the initial upthrust (a) may already be complete, suggesting a near-term pause (b) before strength resumes later in the year (c).

The central case here is a modest near-term economic slowdown, with global manufacturing PMI new orders remaining above 50, followed by a reacceleration in H2 2021. This reflects a view that key investment cycles (stockbuilding / business investment / housing) are fundamentally supportive, as well as incorporating the consensus assumption of economic reopening from Q2.

A H2 reacceleration scenario, however, requires an early stabilisation and recovery in global six-month real narrow money growth. A Chinese pick-up had seemed the most likely driver of this but, as noted, appears to have been deferred. US money numbers could be boosted as new stimulus checks are sent out but this is unlikely before late March.

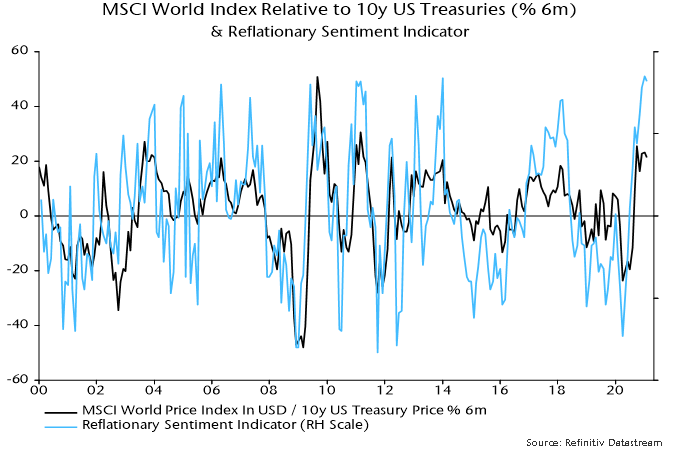
The risk of markets reacting negatively to disappointing near-term economic data is heightened by a strong reflationary bias in current investor positioning. Chart 5 shows a reflationary sentiment indicator derived by combining bullish sentiment data (from Consensus Inc) for various markets that have correlated with global economic momentum historically. An extreme low in the indicator in late March 2020 marked the bottom in equity markets – could the current extreme high mark a short-term top?

Global money trends continue to suggest a near-term economic slowdown, with the caveat that interpretation of US monetary statistics is complicated by recent regulatory changes.

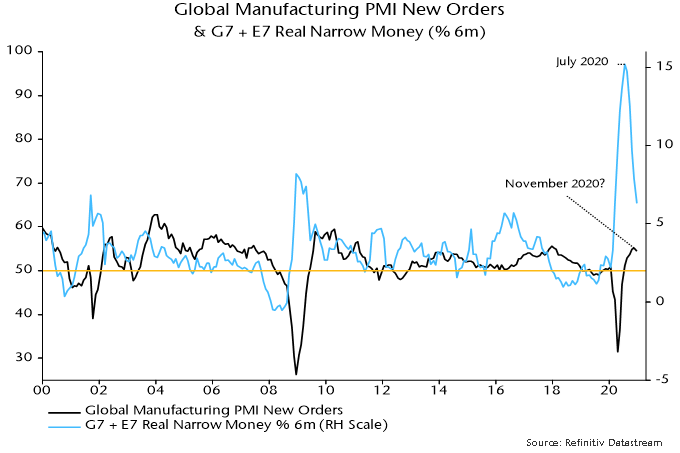
The key global monetary indicator followed here – six-month growth of real narrow money in the G7 economies and seven large emerging economies – is estimated to have fallen further in December, based on monetary data covering 70% of the aggregate. Real money growth has led the global manufacturing PMI new orders index by 6-7 months on average historically, so the continued decline from a July 2020 peak suggests that this PMI measure will move lower into Q2 – see chart 1. 

Chart 1

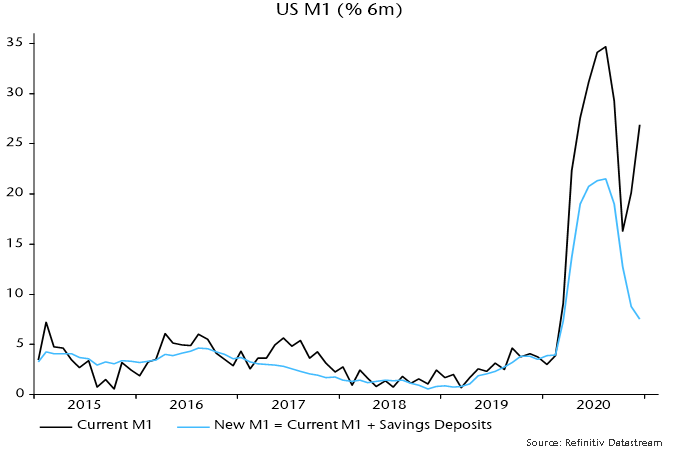
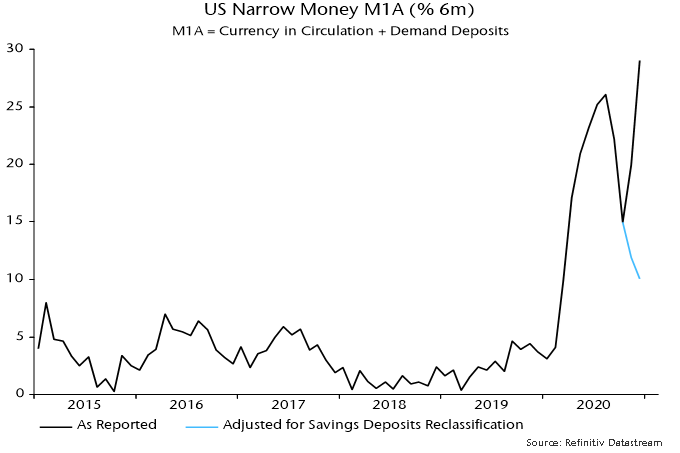
An important qualification is that the G7 plus E7 money numbers for November / December incorporate an adjustment to US data to correct for an apparent upward distortion due to some banks reclassifying savings deposits (excluded from M1 and related measures) as demand deposits (included).

Excluding this adjustment, six-month growth of US narrow money rose to a new high at year-end – see chart 2. Some monetary observers ignore or are unaware of the reclassification distortion, arguing that the narrow money surge presages a super-strong economy and sharply higher inflation.

Chart 2

Fed statisticians haven’t responded to a request for confirmation of a reclassification effect on the data. The view that the strong November / December numbers are explained by such an effect – rather than a genuine flow of money out of « inert » savings deposits into “high velocity” demand deposits – rests on three considerations. 

First, the Fed indicated that deposit reclassifications would occur following its decisions to cut reserve requirements on transactions deposits to zero and remove restrictions on withdrawals from savings deposits last spring. 

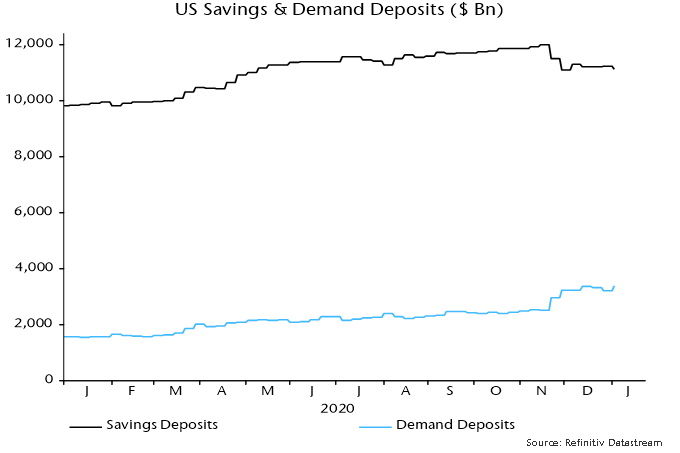
Secondly, the big fall in savings deposits and corresponding rise in demand deposits occurred between the weeks ending 16 November and 30 November – see chart 3. Movements outside this two-week window were “normal”. The weekly numbers are averages of daily data, so the reclassification is likely to have occurred during the week ending 23 November, with the effect carrying over into the following week. (The alternative view is that US election results triggered a big movement of money.) 

Chart 3

Thirdly, the Fed implicitly acknowledged that the M1 data have become distorted in its decision to redefine the aggregate to include savings deposits from next month. Six-month growth of the new M1 measure continued to slide in November / December – see chart 4. 

Chart 4

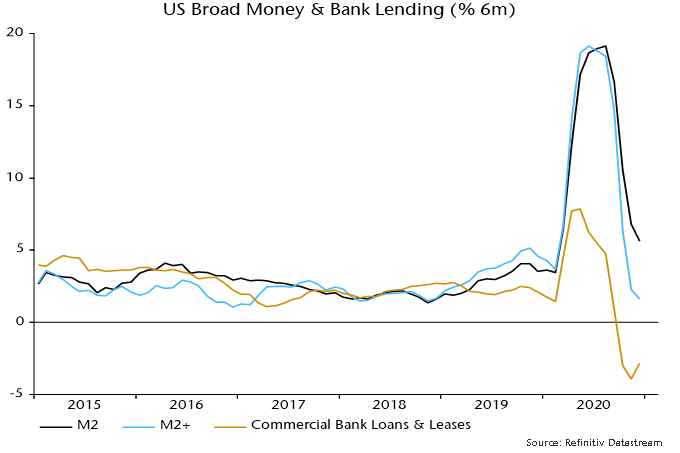
The suggestion that US monetary conditions have become less expansionary is supported by broad money trends, while bank lending continued to contract into year-end (with weakness not due to PPP loan forgiveness, which has yet to kick in) – see chart 5. 

Chart 5

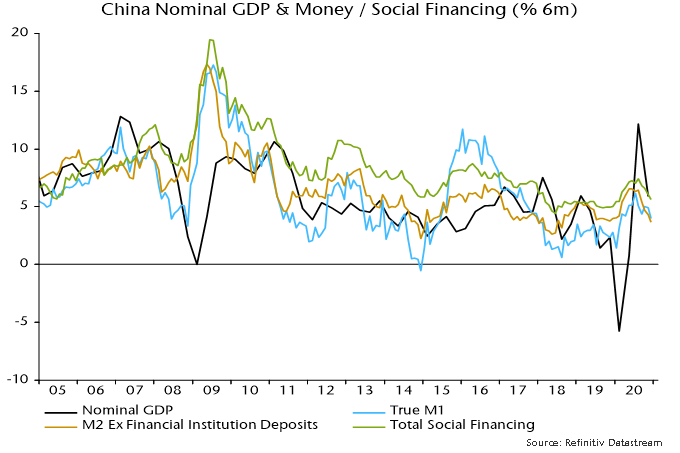
The fall in global six-month real narrow money growth in December also reflected declines in China, Japan and Brazil. The further slowdown in China – extending to broad money and credit, as shown in chart 6 – is consistent with the view here that PBoC policy is too tight and Chinese economic news is likely to disappoint in early 2021. A dovish PBoC policy shift may be needed to trigger the next leg of the global reflation trade but isn’t expected by the consensus and could be conditional on a prior market setback.