Eurozone monetary trends were arguing against ECB policy tightening before the negative shock of Russia’s invasion of Ukraine.
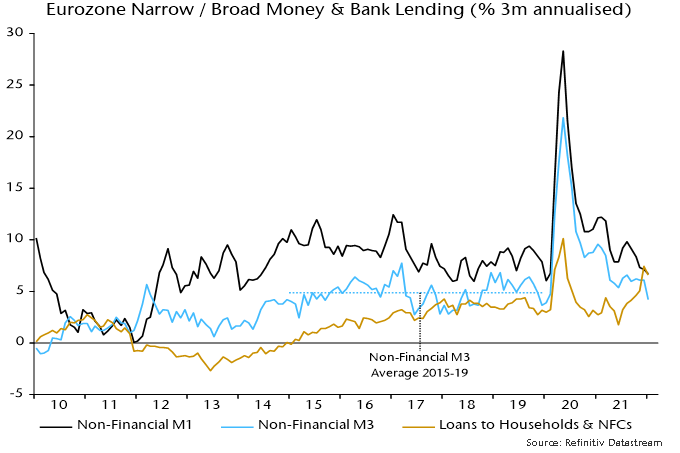
Three-month growth of non-financial M3* – the preferred broad money aggregate here – slowed further to 4.2% annualised in January, the lowest since January 2020 and below a mean of 4.9% over 2015-19, when CPI inflation averaged 1.0% – see chart 1.
Chart 1
Current high inflation reflects excessive money growth in 2020-21 and supply side disruption. It is too late for an ECB response. Any second-round effects will swiftly burn out if money growth maintains its recent subdued pace.
The broad money slowdown has occurred despite ongoing QE, raising the prospect of outright weakness when it stops. The hope is that money growth will be supported by private credit expansion, which has strengthened recently – chart 1. The suspicion here is that corporate loan demand has been boosted by restocking and will fade as this slows.
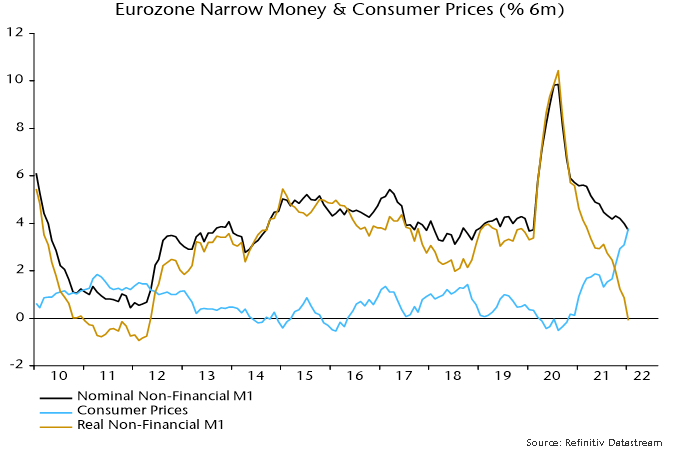
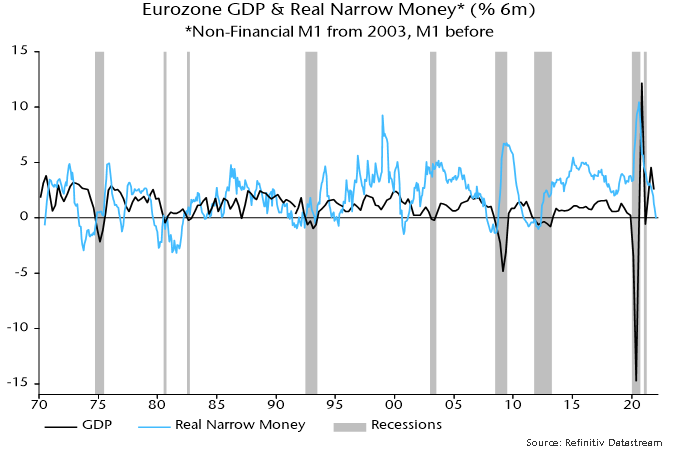
Growth of narrow money (non-financial M1) has also normalised while high inflation has pushed the six-month rate of change in real terms marginally into negative territory – chart 2. Negative readings preceded every recession over 1970-2019, although there were several false signals (e.g. 1994-95) – chart 3.
Chart 2
Chart 3
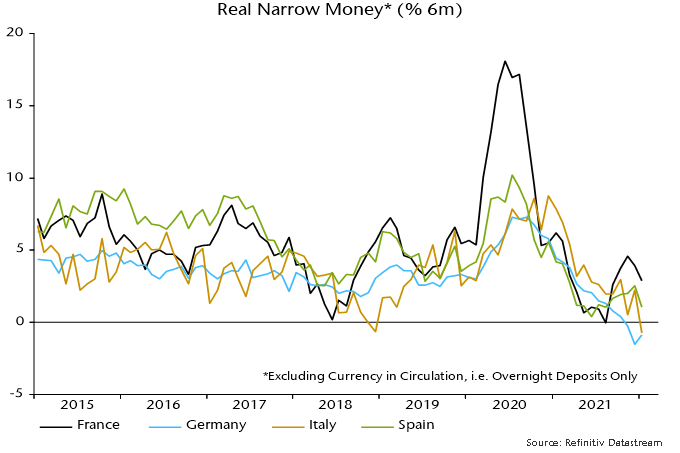
The six-month rate of change of real narrow money deposits is now negative in Italy as well as Germany, with France still showing relative resilience – chart 4.
Chart 4
*M3 holdings of households and non-financial corporations.
Recent market weakness reflects an unfavourable monetary backdrop as well as negative geopolitical developments.
The monetarist view is that asset prices respond to imbalances between the supply of money and the demand to hold it. “Excess” money growth is associated with increased demand for financial assets and upward pressure on their prices, assuming no change in supply.
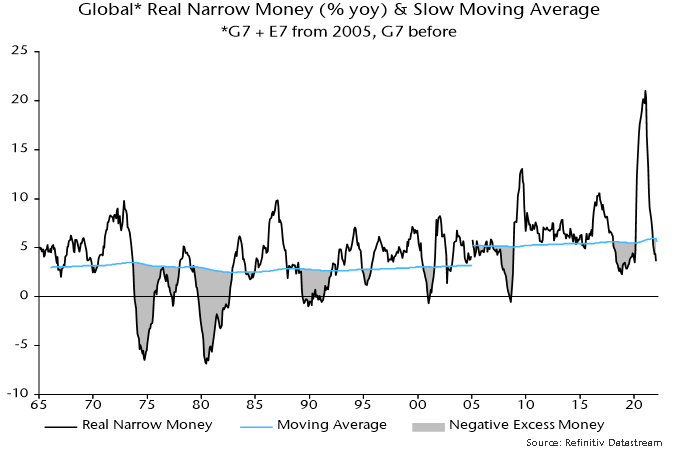
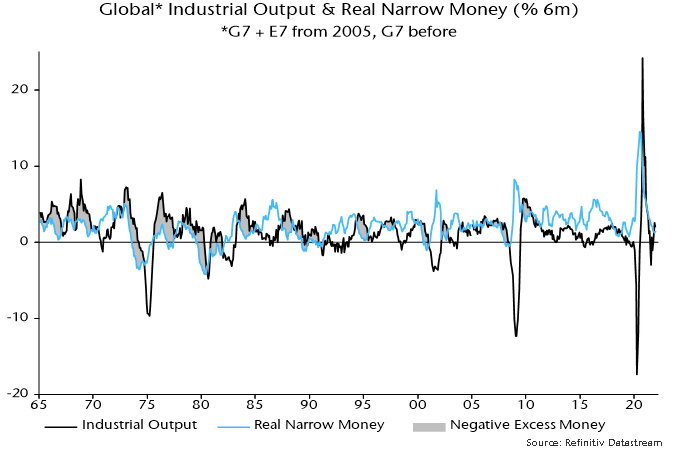
Excess money growth can’t be measured directly because the demand to hold money – based on current economic conditions and prices – is unobservable. Two proxy measures of global excess money are tracked here: the difference between six-month growth rates of real (i.e. CPI-deflated) narrow money and industrial output; and the deviation of 12-month real money growth from a slow moving average.
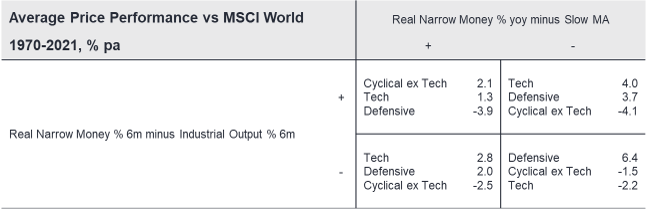
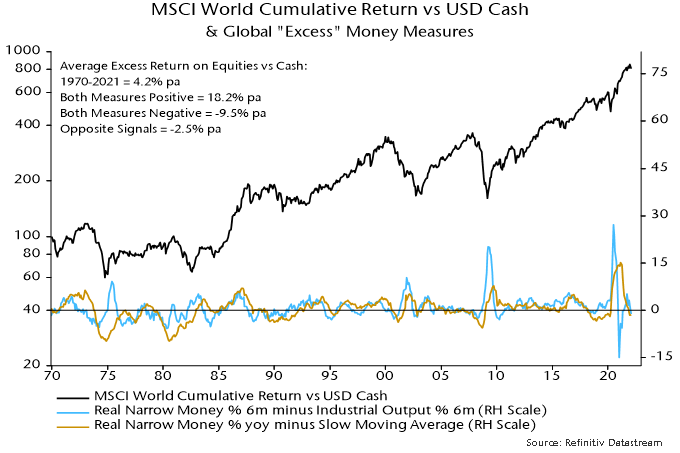
Historically, global equities outperformed cash significantly on average when both measures were positive but underperformed significantly when both were negative. Mixed signals were associated with a small return shortfall, i.e. no reward for assuming equity risk – see table 1.
Table 1
A post in early January noted that the second measure had turned negative in October while the first appeared to have followed in November, based on partial data. This “double negative” signal was confirmed later in January.
A January estimate of global real narrow money is now available, along with a firm data point for December industrial output. Both excess money measures remain negative.
12-month growth of global real money is estimated to have fallen further below its moving average in January – chart 1. An early reconvergence seems unlikely – CPI inflation is probably peaking but a decline may be offset by a further slowdown in nominal money growth as large monthly increases a year ago drop out of the 12-month comparison.
Chart 1
Meanwhile, six-month real narrow money growth was little changed in January and below December industrial output growth – chart 2. Six-month output growth may stay at or above the December level through March: a temporary production catch-up is in progress as supply constraints ease, US output rose solidly in January and base effects are favourable (output fell between June and September 2021).
Chart 2
The excess money measures have also been correlated with sector relative performance historically, with double negative signals associated with strong outperformance of the defensive sectors basket (which includes energy) and underperformance of cyclicals, including tech (IT and communication services) – table 2.
Table 2
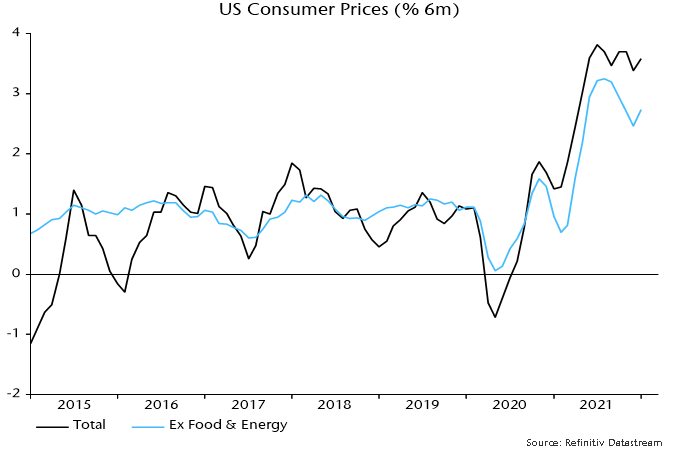
Year-on-year headline and core CPI inflation rates rose further in January, to 7.5% and 6.0% respectively, but six-month momentum remained below peaks reached in July-August – see chart 1.
Chart 1
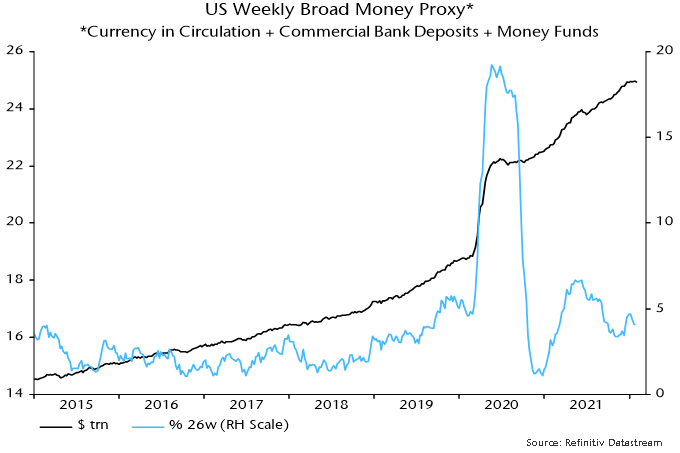
The fundamental cause of current high inflation is excessive monetary expansion in 2020-21 but six-month growth of broad money has returned to its pre-pandemic pace – chart 2. Weekly numbers have stagnated since December, when tapering started.
Chart 2
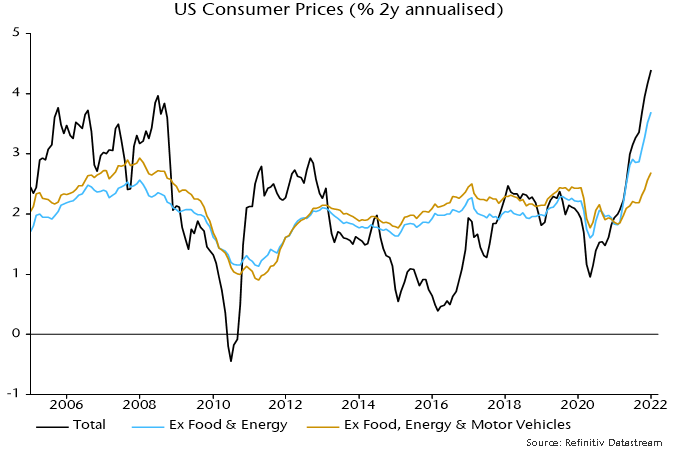
The year-on-year core rate of 6.0% overstates underlying inflation because of base effects and a one-off surge in vehicle prices. Year-on-year was only 1.4% in January 2021 so core prices have risen at an average rate of 3.7% pa over the last two years.
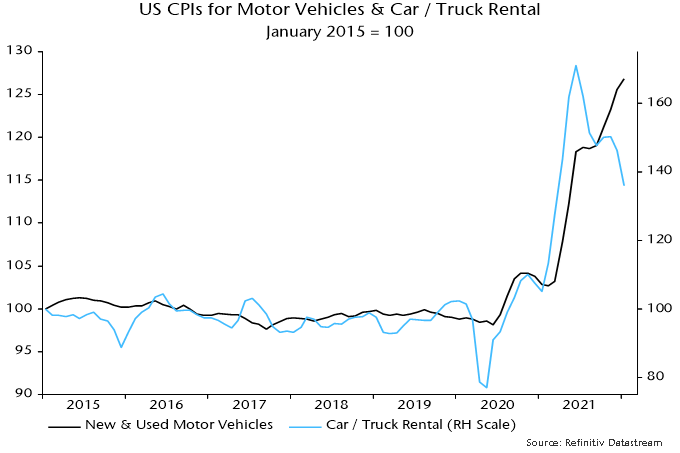
The CPI component for new and used vehicles soared by 28.1% between January 2020 and January 2022, boosting core CPI by 2.5 pp – vehicles had a 9.1% weight in the core basket in January 2020.
Stripping out vehicles, core CPI rose by “only” 2.7% pa in the two years to January. Two-year inflation on this measure reached a higher peak in the 2000s – chart 3.
Chart 3
Vehicle prices should correct as supply constraints ease and high fuel prices depress demand. A recent fall in car / truck rental rates may be a harbinger – chart 4.
Chart 4
Suppose that core CPI ex. vehicles rises by 3.5% over the coming 12 months, above its two-year rate of increase of 2.7% pa. If vehicle prices were to correct by 10% over this period, the conventional core rate would fall to 1.9% in January 2023.
Actual and imputed rents are widely expected to exert upward pressure on core inflation. However, year-on-year rental inflation would have to rise from the current 4.4% to 8% to offset a 10% fall in vehicle prices. Rental inflation hasn’t breached 6% since the mid 1980s.
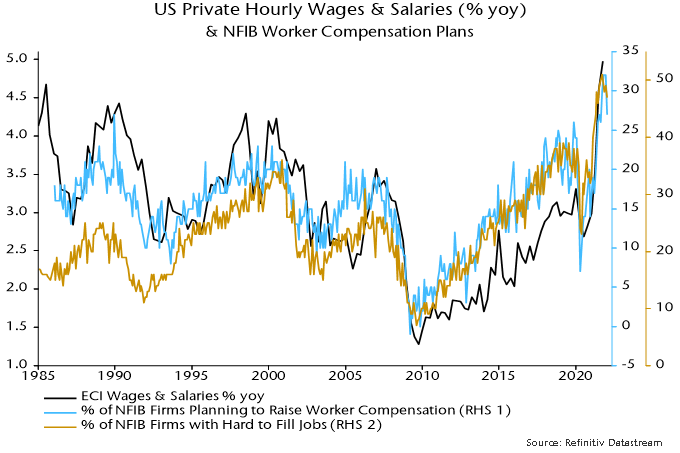
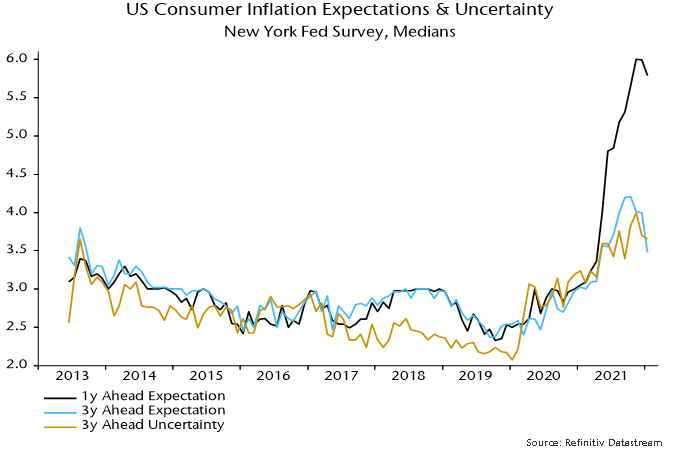
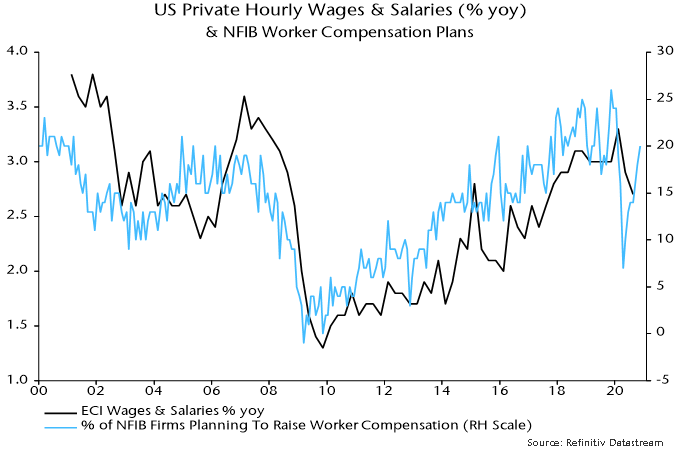
The Fed and other central banks are focused on backward-looking inflation indicators, including wage growth and (adaptive) inflation expectations, rather than money trends. Even these are showing signs of peaking: NFIB small firm worker compensation plans eased in January while New York Fed consumer expected inflation measures fell – charts 5 and 6.
Chart 5
Chart 6
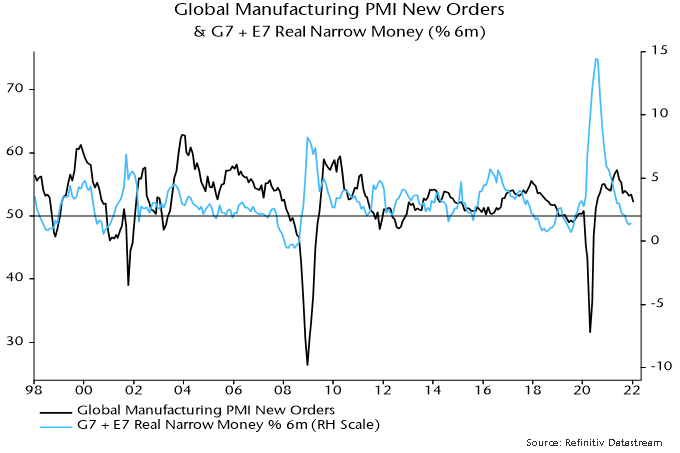
The global economic slowdown signalled by monetary trends appears to be playing out. The global manufacturing PMI new orders index fell to an 18-month low in January and is now 5.1 points below a May peak – see chart 1.
Chart 1
A decline in global six-month real narrow money growth into November suggests a further PMI fall into mid-year, at least, allowing for a typical 6-7 month lead. Real money growth recovered marginally in December but could weaken again in January – a provisional number will be available by early next week. Eurozone growth is likely to have turned negative based on last week’s CPI data, showing a further spike in six-month momentum.
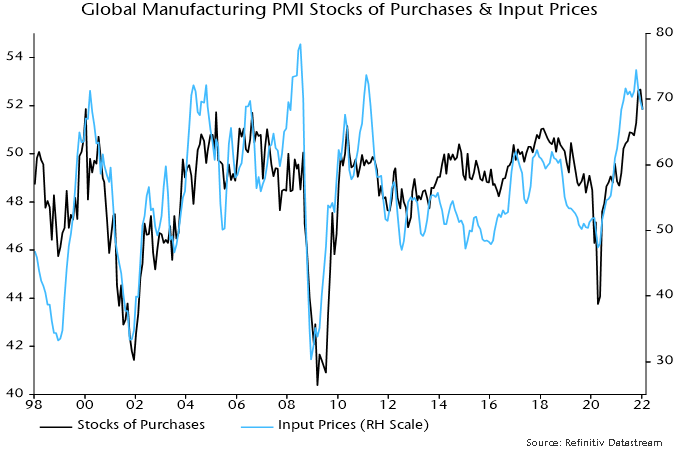
The manufacturing PMI stocks of purchases index reached a record level in December but fell back in January, consistent with the view here that the stockbuilding cycle has peaked and is about to enter a 12-18 month downswing phase. The coming inventory slowdown (and eventual liquidation) is likely, as usual, to be associated with a significant weakening of goods price pressures – chart 2.
Chart 2
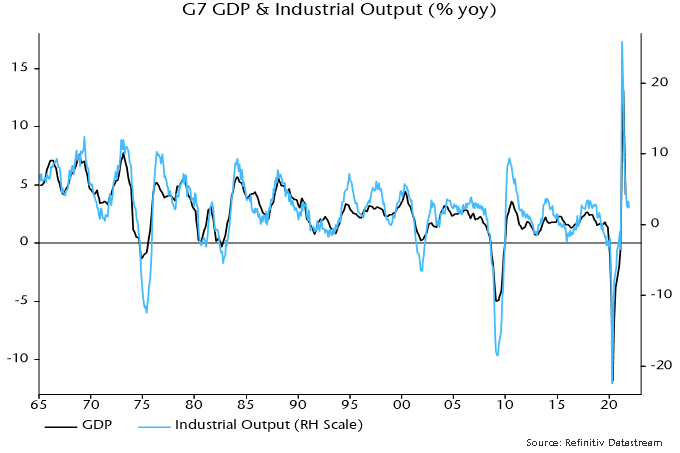
Optimists argue that services strength as pandemic disruption ends will outweigh any industrial slowdown. The (Keynesian) understanding here is that economic fluctuations are driven by goods spending and investment in particular. GDP growth swings mirror those in industrial output: the correlation coefficient of year-on-year changes was +0.89 over 1965-2020 – chart 3. There is no independent cycle in services demand. A services rebound as conditions normalise is likely to burn out swiftly if the industrial slowdown deepens.
Chart 3
The supposedly “blow-out” US jobs report has no implication for the assessment here, except to increase the likelihood of a Fed policy mistake. Labour market data are not forward-looking and the details of the report were much less impressive than the headlines.
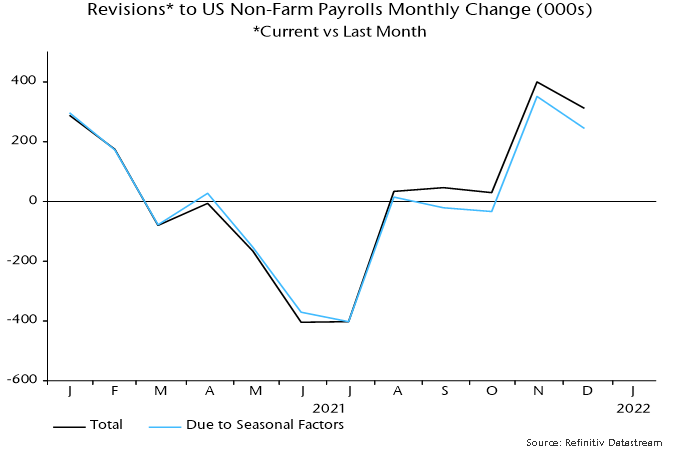
Huge upward revisions to November / December payrolls growth reflected new seasonal factors, with offsetting downgrades to June / July numbers – chart 4
Chart 4
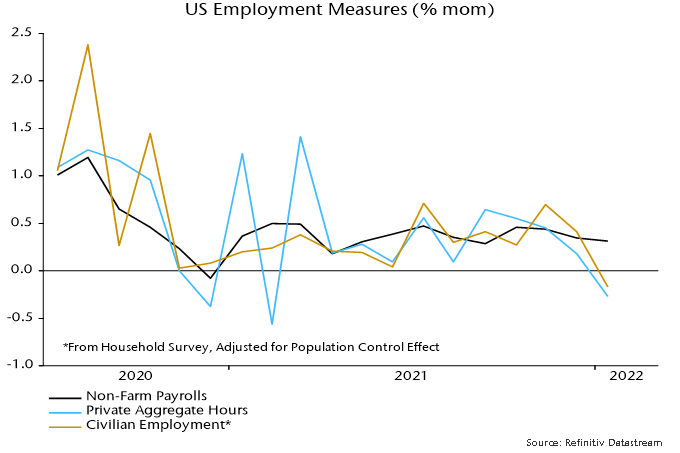
Payrolls rose solidly in January (with a boost from the new seasonal factor) but pandemic disruption showed up in falls in aggregate hours and the household survey employment measure – chart 5.
Chart 5
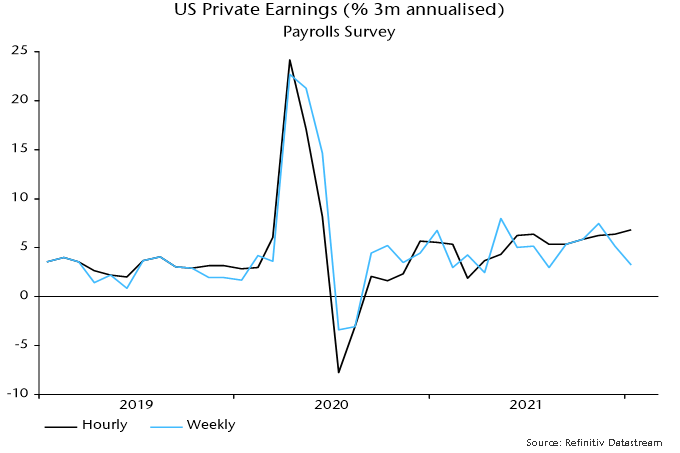
The drop in weekly hours may explain the larger-than-expected hourly earnings increase, assuming that lower-earners were more likely to have their hours cut. Weekly earnings growth remains range-bound – chart 6.
Chart 6
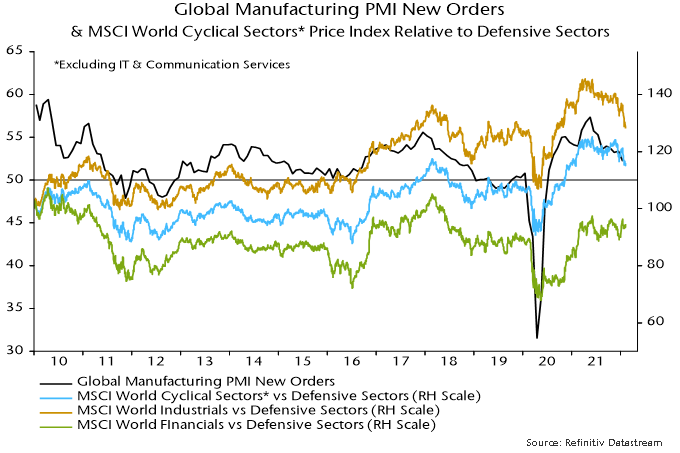
The PMI fall has been reflected in underperformance of MSCI-defined cyclical sectors versus defensive sectors but there is significant variation within the groupings, most notably the continued strength of financials – chart 7.
Chart 7
This resilience, of course, reflects rising bond yields and is likely to fade if waning economic momentum and easing price pressures pull these lower.
The view here remains that the rise in bond yields – like the outperformance of value versus growth – reflects a less favourable monetary backdrop for markets rather than a reprise of the “reflation trade”. Both “excess” money measures tracked here remain negative – chart 8.
Chart 8
The “monetarist” view is that central banks should conduct policy with the aim of stabilising growth of (broad) money at a non-inflationary rate.
Major central banks – the Fed and Bank of England in particular – trashed this principle in 2020-21, pursuing policies that caused money growth to explode, with the inflationary consequences still playing out.
The MPC’s decision in November 2020 to launch a further £150 bn of QE when annual broad money growth – as measured by non-financial M4* – was already at 12% was one of the worst in its 25-year history.
So what is the monetarist policy recommendation now?
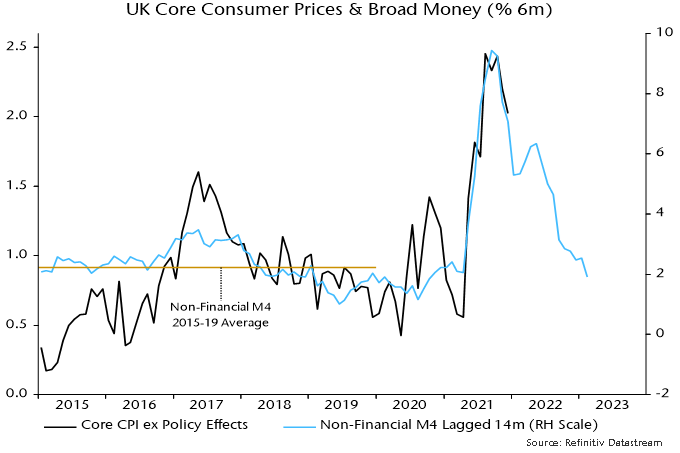
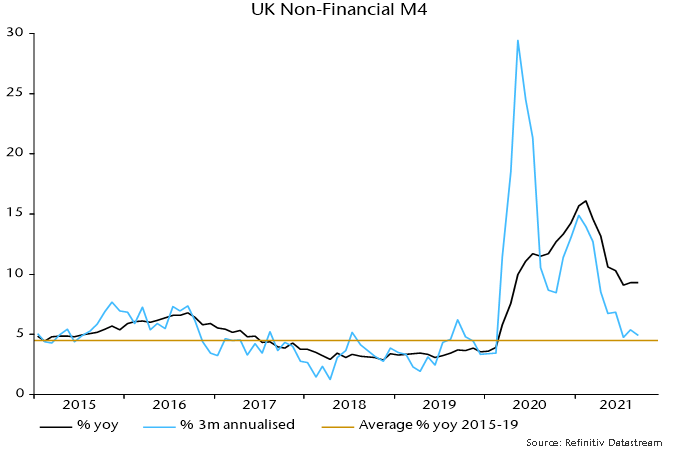
In the UK, it is to do nothing. Broad money momentum slowed sharply during 2021, with non-financial M4 rising by 1.9% or 3.9% at an annualised rate in the six months to December. This is close to the average in the five years preceding the pandemic and, if sustained, would be consistent with core CPI inflation returning to around target over the medium term – see chart 1.
Chart 1
The H2 broad money slowdown occurred despite QE continuing until November. Monthly growth of non-financial M4 fell to just 0.1% in December.
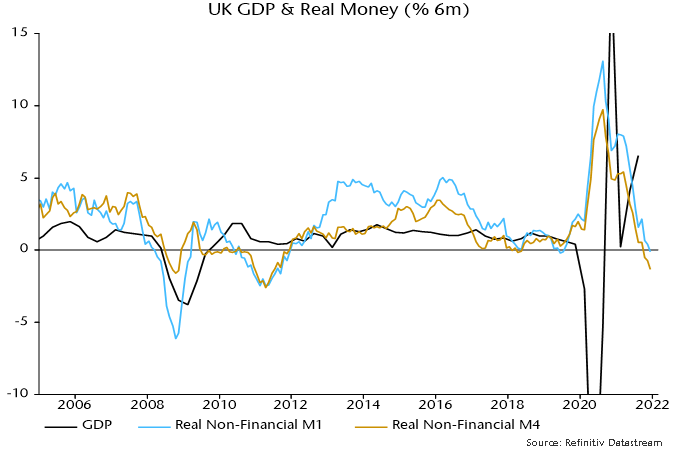
The combination of high inflation due to 2020-21 policy mistakes and the recent monetary slowdown has resulted in a contraction of real money balances, suggesting already-weak economic prospects – chart 2. Policy tightening into such a contraction risks pushing the economy into a recession.
Chart 2
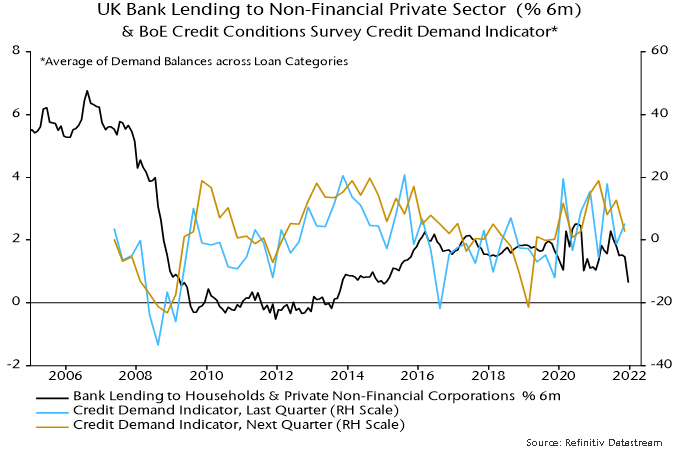
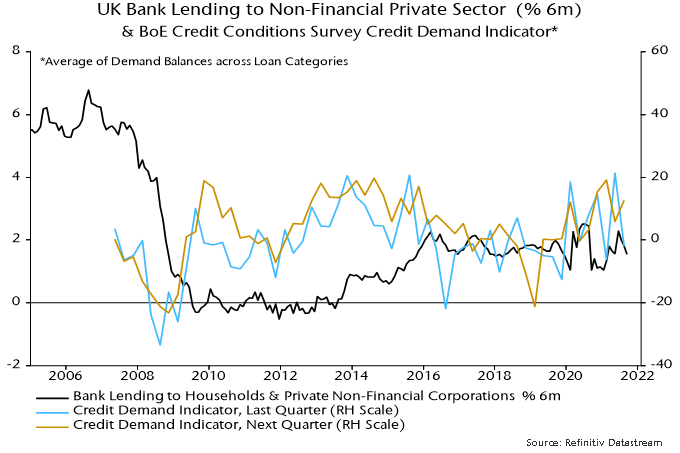
The MPC, on the view here, should wait for a rebound in money growth before raising rates and starting to reduce its gilts portfolio. Such a rebound is likely to depend on a pick-up in private sector credit growth, of which there is no sign in recent lending data or the Bank of England’s credit conditions survey – chart 3.
Chart 3
A consensus view is that the MPC needs to tighten to prevent high inflation becoming embedded in expectations. The best way of anchoring inflation expectations is to maintain low, stable money growth.
Another argument is that a period of weak money growth is warranted to offset excess expansion in 2020-21. Such attempts at monetary fine-tuning are hazardous and liable to create more volatility. The suspicion here is that “excess” money balances have already been largely absorbed by asset price / wealth gains (and an associated rise in the portfolio demand for money) and the current inflation surge.
*M4 holdings of the household sector and private non-financial corporations.
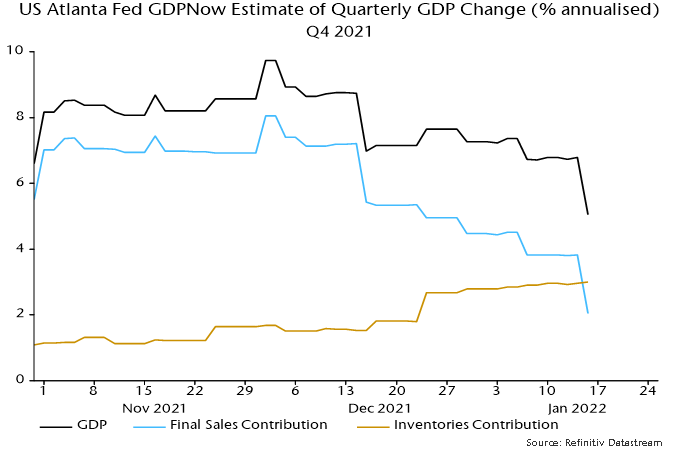
Recent US economic news has surprised negatively when properly weighted for significance. The Atlanta Fed’s nowcast of the contribution of final sales to Q4 annualised GDP growth has been slashed from 8.1 percentage points at the start of December to just 2.0 pp currently – see chart 1.
Chart 1
The most recent lurch down was driven by shockingly bad December retail sales – inflation-adjusted sales have now dropped 10% from their stimulus-inflated March peak.
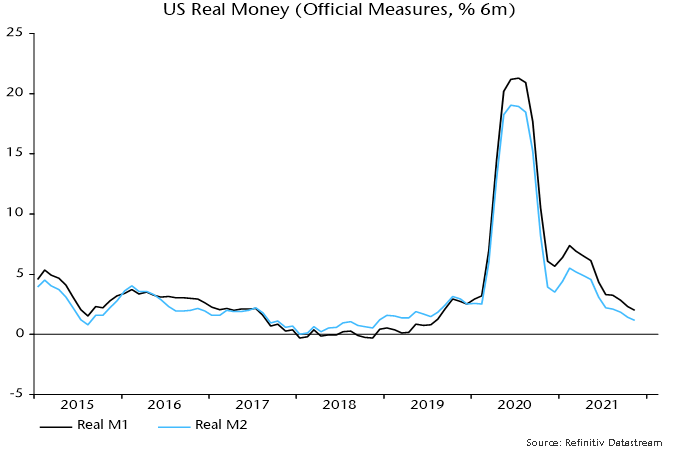
The consensus is discounting weakness as temporary and due to the omicron wave. The “monetarist” forecast is that a cyclical slowdown is under way related to a big fall in real money growth since 2020 – chart 2.
Chart 2
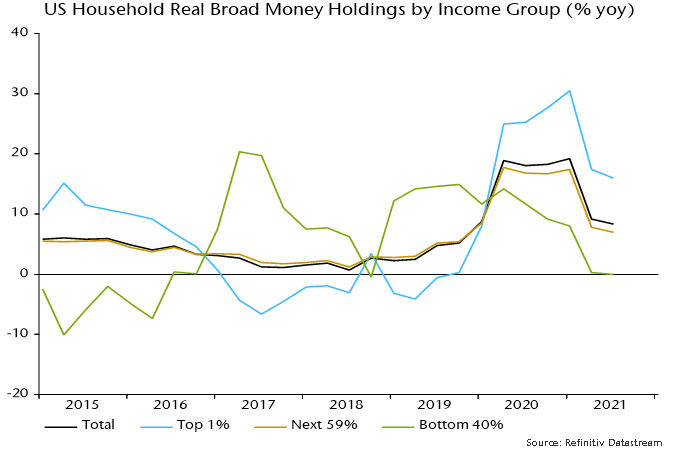
The distribution of money growth, moreover, looks unfavourable for demand growth. Broad money balances have risen fastest for high-income households with a lower propensity to consume. Money holdings of the bottom 40% of earners were stagnant in real terms in the year to end-Q3 – chart 3.
Chart 3
The Atlanta Fed’s Q4 GDP growth nowcast is still up at 5.0% but this reflects a whopping 3.0 pp contribution from inventories – consistent with the view here that the stockbuilding cycle is peaking.
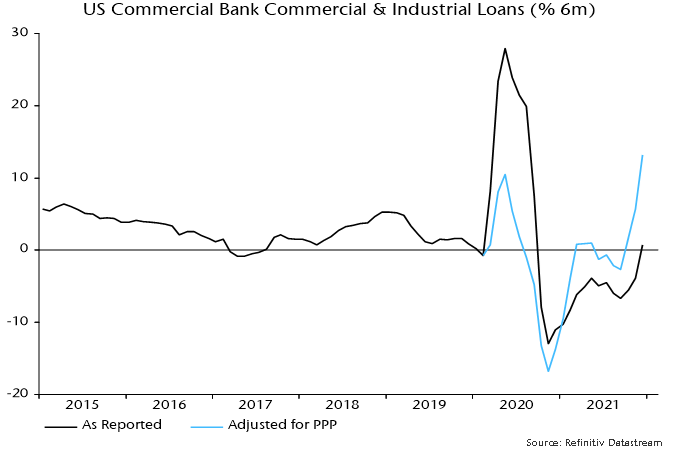
The latter estimate is based on inventory data through November but the December retail sales slump suggests further stockpiling. So does another bumper monthly rise in commercial and industrial loans, which are strongly influenced by inventory financing needs – chart 4.
Chart 4
The Fed’s “hawkish pivot” was predicated on a strong economy* but the Fed is often facing the wrong way at turning points. Officials are likely to row back if activity data continue to disappoint, even if inflation news remains unfavourable.
*From Chair Powell’s testimony to the Senate Banking Committee on 11 January: ”Today the economy is expanding at its fastest pace in many years, and the labor market is strong.”
Bank of England Governor Andrew Bailey is under fire for miscommunication in the run-up to this week’s MPC meeting. A much bigger error was the Committee’s decision a year ago to boost QE by a further £150 billion at a time when annual broad money growth – as measured by non-financial M4 – was running at 11.7%.
The extra QE contributed to annual money growth rising further to a peak of 16.1% in February 2021, with the additional monetary excess to be reflected in a higher inflation peak in 2022 and a slower subsequent decline than would otherwise have occurred.
So should the MPC have hiked this week? Annual non-financial M4 growth was still 9.3% in September but the three-month pace of expansion has moderated to an annualised 4.9%, not far above a 2015-19 average of 4.5% – see chart 1.
Chart 1
The view here has been that the MPC should move rates back to 0.5-0.75% to reinforce the recent monetary slowdown and then wait for guidance from the numbers. Sustained sub-5% expansion would be consistent with (core) inflation returning to target, though probably not before H2 2023.
Higher rates would be needed in the event of a credit-driven rebound in money growth. Bank lending expansion has weakened recently, partly reflecting the ending of the stamp duty holiday, but expected loan demand balances mostly improved in the latest Bank of England credit conditions survey – chart 2.
Chart 2
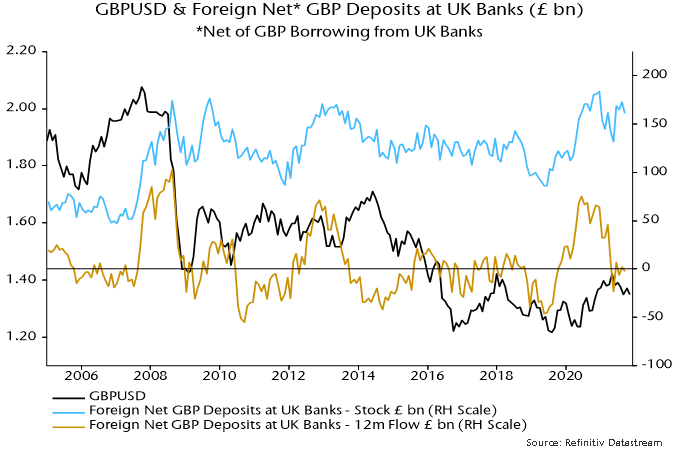
The MPC’s miscommunication / delay risks triggering a fall in sterling, which would magnify near-term inflation difficulties. The exchange rate appears to have been boosted in 2019-20 by overseas investors increasing their net sterling deposits at UK banks – chart 3. These inflows stopped in 2021 but a large stock position could be liquidated if investors lose faith in UK policy-making.
Chart 3
The forecasting approach employed here – relying on monetary and cycle analysis – turned positive on the global economy and risk markets in early Q2 2020 but is giving a more cautionary message at the start of 2021. The suggestion is that underlying economic momentum will slow temporarily while monetary support for markets has diminished, together raising the risk of a correction. The central view remains that global growth will be strong over the course of 2021 as a whole but with the adverse corollary of a significant pick-up in inflation into 2022.
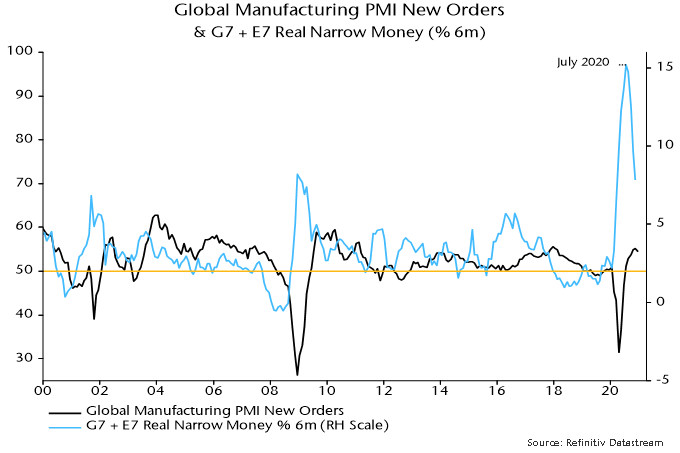
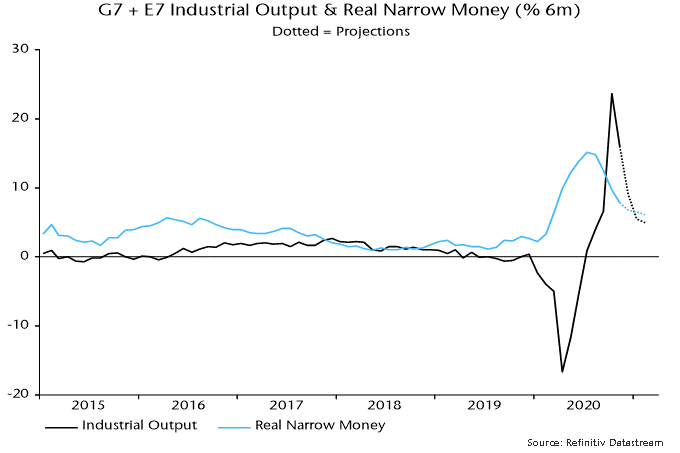
The monetary aspect of the forecasting approach can be summarised as “real money leads the economy while excess money drives markets”. Six-month growth of real (i.e. inflation-adjusted) narrow money in the G7 economies and seven large emerging economies (the “E7”) was weak at the start of 2020 but surged from March, correctly signalling a strong rebound in global economic activity during H2.
Real money growth, however, peaked in July, falling steadily through November, the latest data point – see chart 1. Turning points in real money growth have led turning points in the global manufacturing PMI new orders index – a key coincident indicator – by 6-7 months on average historically, suggesting that the PMI will move lower in early 2021. The level of money growth remains high, arguing against economic weakness (except due to “lockdowns”), but a directional shift in activity momentum could act as a near-term drag on cyclical assets.
Chart 1
“Excess” money refers to an environment in which actual real money growth exceeds the level required to support economic expansion, with the surplus likely to be invested in markets. Two gauges of excess money are monitored here: the gap between six-month growth rates of G7 plus E7 real narrow money and industrial output, and the deviation of year-on-year real money growth from a long-run moving average. Historically, global equities performed best on average when both measures were positive, worst when they were negative, and were lacklustre when they gave conflicting signals.
Following a joint positive signal (allowing for data release lags) at end-April 2020, the measures became conflicting again at end-December – year-on-year real money growth remains well above its long-run average but six-month growth fell below that of industrial output in October / November. Markets, therefore, may no longer enjoy a monetary “cushion” against unfavourable news, including the expected PMI roll-over.
The expectation here is that markets will become more volatile but risk assets are unlikely to be outright weak – any sizeable set-back would probably represent another buying opportunity. As noted, real money growth remains at an expansionary level and may stabilise soon, while the cycle analysis is giving a positive economic message for the next 12+ months, as explained below.
The cross-over of six-month real narrow money growth below industrial output growth, moreover, could prove short-lived, with output momentum about to fall back sharply as positive base effects fade. Assuming a stabilisation of monthly money growth, a positive differential could be restored as early as January – see chart 2 – in which case the assessment of the monetary backdrop for markets would shift back to favourable from Q2.
Chart 2
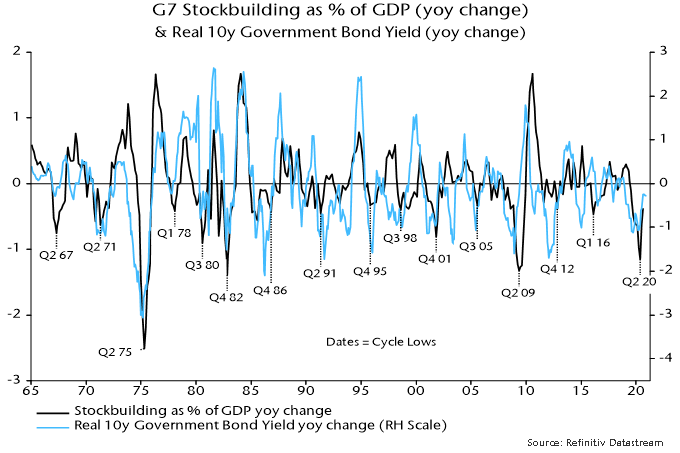
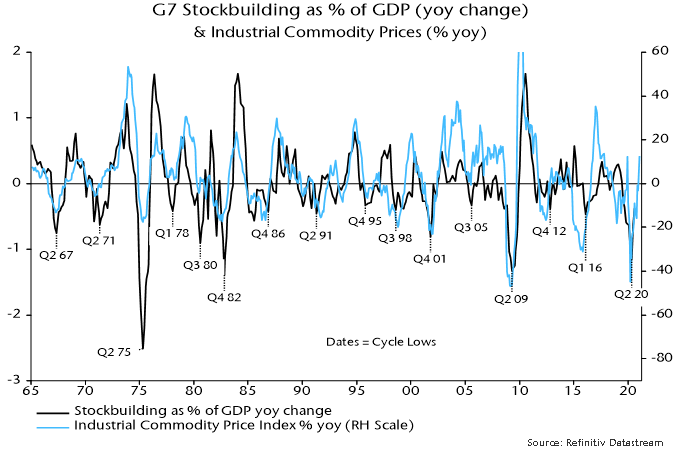
The cycle analysis provides a medium-term perspective and acts as a cross-check of the monetary analysis. There are three key economic activity cycles: the stockbuilding or inventory cycle, which averages 3.5 years (i.e. from low to low); a 9-year business investment cycle; and a longer-term housing cycle averaging 18 years. These cycles are essentially global in nature although housing cycles in individual countries can sometimes become desynchronised.
The cycle analysis was cautionary at the start of 2020, reflecting a judgement that the stockbuilding and business investment cycles were in downswings that might not complete until mid-year. The covid shock magnified but ended these downswings, with both cycles bottoming in Q2 and entering a recovery phase in H2. With the housing cycle still in an upswing from a 2009 low, all three cycles are now acting to lift global economic momentum.
The next scheduled cycle trough is a low in the stockbuilding cycle, due to be reached in late 2023 if the current cycle conforms to the average 3.5 year length. The downswing into this low would probably start about 18 months earlier, i.e. around Q2 2022. The cycle analysis, therefore, is giving an “all-clear” signal for the global economy for the next 15-18 months, implying that any data weakness – such as suggested by monetary trends for early 2021 – is likely to be minor and temporary.
Financial market behaviour is strongly correlated with the stockbuilding cycle in particular. Cycle upswings are usually associated with rising real government bond yields and strong commodity markets – see charts 3 and 4 – as well as low / falling credit spreads and outperformance of cyclical equity sectors. The latter three of these trends, of course, were in place during H2 2020 and may extend during 2021 after a possible Q1 correction. A surprise to the consensus in 2021 could be a rebound in real bond yields, which would challenge current equity market valuations and could favour “value”.
Chart 3
Chart 4
To sum up, monetary data in early 2021 will be important for the strategy assessment here. The current monetary backdrop and possible weaker near-term economic data suggest reducing cyclical exposure relative to H2 2020 but a stabilisation or revival in real money growth would support the positive message from the cycle analysis, arguing for using any setback in cyclical markets to rebuild positions in anticipation of a strong H2.
Consumer price inflation rates are widely expected to rise during H1 2021, reflecting recent commodity price strength, a reversal of temporary tax cuts (Germany / UK) or subsidies (Japan), and base effects. The policy-maker and market consensus is that this will represent a temporary “cyclical” move of the sort experienced regularly in recent decades. The suspicion here is that it will prove more lasting and significant, because the monetary backdrop is much more expansionary / inflationary than before those prior run-ups.
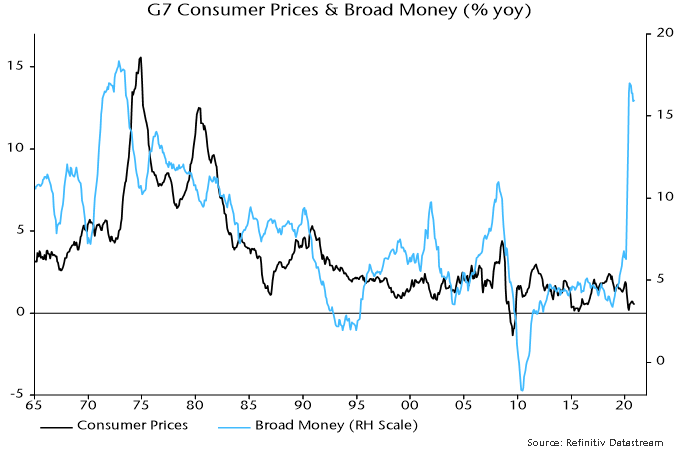
Broad rather than narrow money trends are key for assessing medium-term inflation prospects. This is illustrated by Japan’s post-bubble experience: narrow money has grown strongly on occasions but annual broad money expansion never rose above 5% over 1992-2019, averaging just 2.1% – the monetary basis for sustained low inflation / mild deflation. Similarly, G7 annual broad money growth averaged only 3.7% in the post-GFC decade (i.e. 2010-19).
2020 may have marked a transformational break in monetary trends. G7 annual broad money growth peaked at 17.0% in June, the fastest since 1973 – see chart 5. Monthly growth has subsided but there has been no “payback” of the H1 surge. At the very least, this suggests a larger-than-normal “cyclical” upswing in inflation in 2021-22. Ongoing monetary financing of large fiscal deficits may sustain broad money growth at well above its levels of recent decades, embedding the inflation shift.
Chart 5
The consensus view that an inflation pick-up will prove temporary rests on weak labour markets bearing down on wage growth. Unemployment rates adjusted for short-time working / furlough schemes, however, fell sharply as the global economy rebounded in H2 2020 and structural rates have probably risen – labour market “slack”, therefore, may be less than widely thought and much lower than after the 2008-09 recession. The slowdown in wages to date has been modest and some business surveys are already hinting at a rebound – see chart 6.
Chart 6
Commentators who take seriously the prospect of a sustained inflation rise often argue that real bond yields would take the strain by moving deeper into negative territory, the view being that central banks will cap nominal yields. Such a scenario would be bullish for risk assets but probably overstates the power of the policy emperors. Pegged official rates and a QE flow currently running at about 10% of the (rapidly rising) outstanding stock of G7 government bonds per annum could prove insufficient to offset selling by existing holders in the event of an unexpected inflation surge.
While the focus of inflation is typically centered on rising raw material costs and wage increases, we are seeing transportation costs become an additional and significant part of the inflation problem, and one that is not as easily passed on to consumers.
Transportation affects every aspect of a company’s supply chain and the rising costs are unavoidable. Further, it has been a recent topic of conversation for our own holdings, as well as some of the largest companies in the world. At a recent conference, Molson Coors, the fifth largest brewer in the world, said transportation costs are the main contributing factor to inflation, while Proctor and Gamble warned that an announced price increase will not be enough to offset higher commodity and transportation costs due to not only the size, but the speed of the increases. Multinational conglomerate 3M is a good barometer, as it is seeing “a lot of pressure on logistics costs.” Dollar Tree is one of the largest retail importers in the United States (US) and at their recent quarterly earnings presentation, they spent a considerable amount of time discussing the global supply chain and higher freight costs, saying they were “not counting on material improvements in 2022, especially in the first portion of the year.”
The recovery from the pandemic has seen a huge increase in demand, but with continued quarantine controls, distancing measures at ports and labour shortages are causing severe backlogs. The Suez Canal blockage and summer typhoons off the Chinese coast did little to ease the problem. Another consideration is the consolidation of ocean shipping lines’ key shipping routes being dominated by a handful of companies, causing fewer vessels in general to be travelling between ports.
The ocean carriers have responded to the high demand by increasing container capacity by 22%, but this does not solve the problem of logjams and the waiting lines reaching record levels at some of the ports.[1]The order book for container ships has doubled in 2021, but the majority won’t be delivered until 2023.
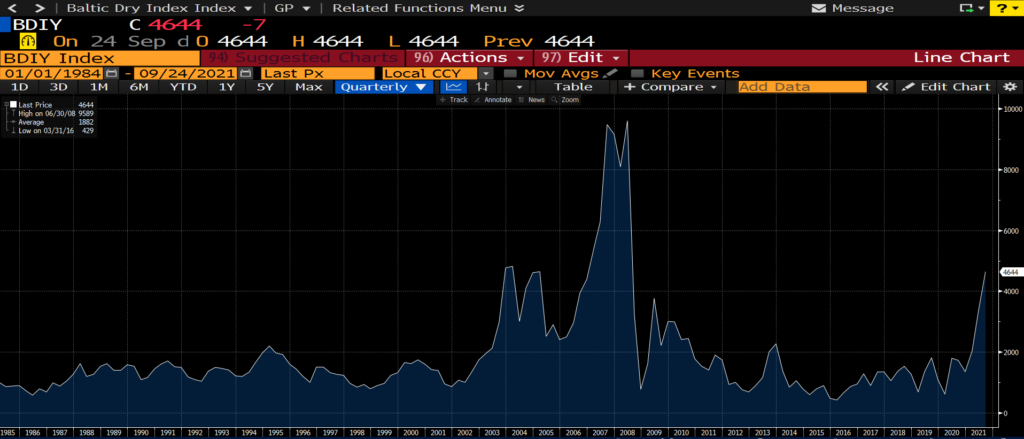
So what does all this mean? Container rates seem to be stabilizing, yet remain extremely elevated. Freightos, a digital booking platform for international shipping, published containerized freight rates. The cost of a container from Asia to the US East Coast is over $20,000, an increase of 415% compared to last year. Shipping from Asia to the US West Coast is slightly less, but the cost is up 452% in comparison to a year ago. Shipping from Asia to North Europe has seen the largest year-over-year increase, up 714% to $13,855. Freight rates from Northern Europe to the US East Coast have been the least affected, up “only” 238% from the period last year to $5,929. In view of these rates, shipping companies are focusing on the most profitable trade routes, meaning reduced volumes crossing the Atlantic. The Baltic Dry Index is a benchmark for the price of shipping major raw materials by sea and is at its highest level since before the Great Financial Crisis.
Source: Bloomberg
The majority of companies are struggling to solve this logistical headache, but our portfolios contain two names that have been natural beneficiaries.
Clipper Logistics (CLG.LN) is a leading provider of value-added logistics solutions, e-fulfilment, and returns management services to the retail sector, primarily in the United Kingdom (UK), but with an expanding presence in Europe. Sales are comprised of the following: 60% of sales come from e-fulfilment and returns management, supporting the online activities of customers; 28% of sales come from non e-fulfilment businesses, supporting traditional brick and mortar customers; and the remaining 12% of sales comes from commercial vehicles sales. Of the logistics related revenues, 85% comes from the UK. Over 90% of Clipper’s contracts are on an open book basis (i.e. cost plus), or hybrid contract, protecting them from increasing costs. However, they are not immune to labour shortages, as they recently flagged the impact that a shortage of HGV drivers is having.
Kerry Logistics (636.HK) is a third-party logistics service provider based in Hong Kong with global exposure. The company provides many supply chain solutions, including integrated logistics, international freight forwarding (air, ocean, road, rail, and multimodal), industrial project logistics, cross-border e-commerce, last-mile fulfilment, and infrastructure investment. Revenue mainly comes from Asia-Pacific, which accounts for 74% of sales (Mainland China 32%, Hong Kong 13%, Taiwan 7%, and other Asia 21%). The Americas accounts for 16% and Europe about 10%. Their customers are mainly big multinational companies, across many industries, including fashion, electronics, food and beverages, FMCG, industrial, automotive, and pharmaceutical.
Perhaps the best advice we could give readers is that with supply chain and transportation issues showing little signs of abating, you would be wise to start your holiday shopping sooner, rather than later.
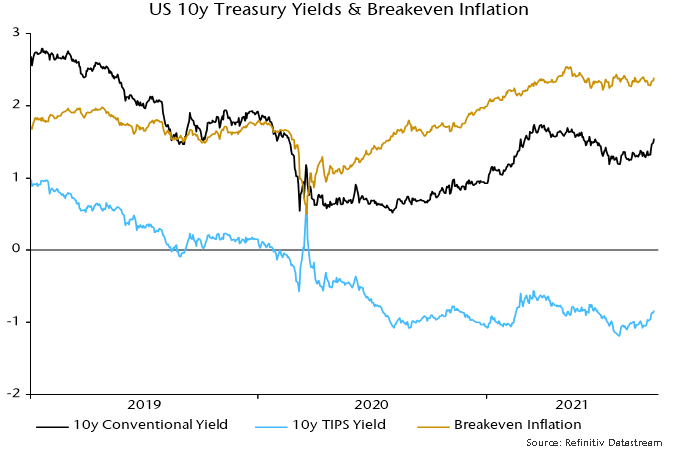
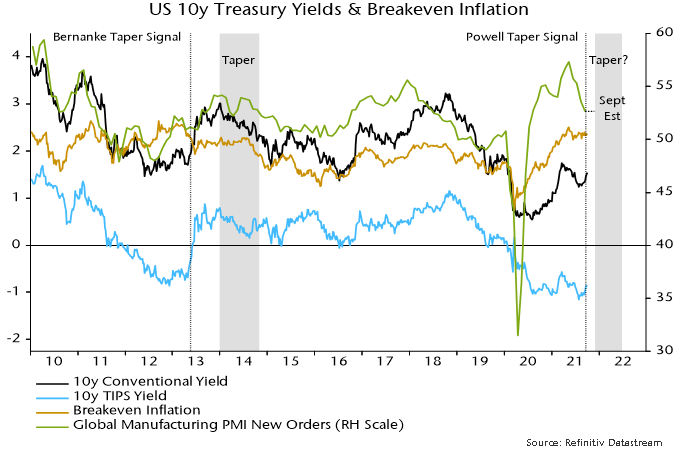
US Treasury yields have risen sharply since Fed Chair Powell’s signal last week of a likely tapering decision at the November or December FOMC meeting. The move higher mainly reflects an increase in real yields, with inflation break-evens range-bound – see chart 1.
Chart 1
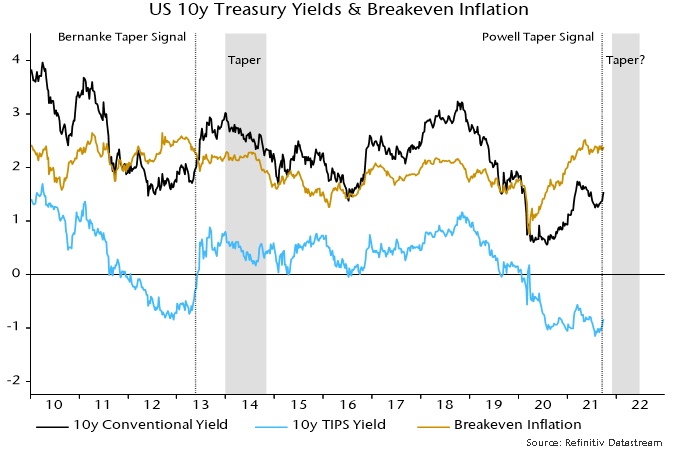
The reaction recalls a surge in nominal and real yields when former Chair Bernanke signalled that the Fed was considering tapering in Congressional testimony on 21 May 2013. Inflation breakevens, which had been falling into the announcement, declined further before recovering – chart 2.
Chart 2
Bernanke’s signal was a catalyst for real yields – which had reached negative levels similar to recently – to return to positive territory. The yield surge triggered a short-lived “risk-off” move in markets, focused on emerging markets and credit (the “taper tantrum”).
The market response spooked the Fed, causing the taper decision to be delayed until December 2013. When tapering finally started in January 2014, nominal and real yields embarked on a sustained decline. Inflation breakevens moved sideways but also fell later in 2014.
Cyclical sectors of equity markets outperformed defensive sectors between Bernanke’s May announcement and the start of tapering in January.
The view here, though, is that investors should be cautious about drawing parallels between 2013-14 and now.
The economic backdrop is a key difference. The global manufacturing PMI new orders index was about to embark on a significant rise as Bernanke gave his taper signal in May 2013 – chart 3. So it is difficult to disentangle the taper effect on yields from the usual correlation with cyclical momentum.
Chart 3
Economic momentum is slowing currently, with money trends suggesting a further PMI decline into early 2022.
This suggests that 1) the yield increase won’t mirror 2013 because the taper announcement effect is offset by a weakening cyclical backdrop, and 2) any rise in real yields could be dangerous for cyclical assets because – in contrast to 2013 – a higher discount rate is unlikely to be balanced by positive economic / earnings news.