Les investisseurs canadiens privilégient depuis longtemps les actions canadiennes et y consacrent une plus grande part de leurs portefeuilles que ne le laissent croire les indices de référence des actions mondiales. Malgré la solide performance du marché boursier canadien en 2025, la récente remontée des marchés américains (alimentée par la progression des géants des technologies de l’information ou « sept magnifiques ») a incité certains investisseurs à repenser cette approche. Les investisseurs canadiens affichent une préférence semblable pour leurs titres nationaux à celle de leurs homologues à l’échelle mondiale. Même si certains investisseurs misent entièrement sur les actions mondiales, il y a plusieurs avantages à privilégier les actions canadiennes.
Biais domestique
Le biais domestique consiste à construire un portefeuille de placement qui privilégie instinctivement les actions de votre propre pays, une tendance commune chez les investisseurs à l’échelle mondiale. Même si les actions canadiennes ne représentent que 3 % à 4 % des marchés boursiers mondiaux, le confort de ce qui est connu fait qu’une place beaucoup plus importante leur est accordée dans les portefeuilles d’actions. Il est courant pour les investisseurs canadiens de consacrer entre 20 % et 40 % de leur exposition totale aux actions canadiennes.
De nombreux investisseurs surpondèrent largement les actions de leur marché domestique par rapport au poids réel de leur pays dans le marché mondial. Selon l’étude Global Pension Assets Study 2025 du Thinking Ahead Institute de WTW sur les actifs des régimes de retraite mondiaux, cette préférence est particulièrement forte du côté des investisseurs dans les caisses de retraite australiennes, japonaises et britanniques, qui investissent entre 20 % et 45 % de leur exposition totale en actions dans des sociétés de leur pays d’origine. Bien que les investisseurs des régimes de retraite américains affichent généralement la plus forte allocation domestique, celle-ci reflète en grande partie le poids important du marché américain au sein du marché mondial.
Les arguments en faveur d’une approche axée sur le pays d’origine plutôt que sur la capitalisation boursière mondiale viennent aussi avec leurs propres défis, notamment une certaine concentration sectorielle. Toutefois, chaque approche offre une perspective unique sur la façon de gérer le risque et les occasions.
Caractéristiques des différentes approches
Le tableau suivant présente les caractéristiques des différentes approches de gestion du total des actifs en actions.
|
Préférence pour les actions canadiennes |
Actions mondiales seulement |
| Monnaie |
Investir dans des actifs libellés en dollars canadiens permet aux investisseurs institutionnels, comme les caisses de retraite, les fonds de dotation et les fondations, de contourner le risque de change. Ainsi, la valeur des actifs suit l’évolution des éléments de passif, ce qui élimine les fluctuations de valorisation causées par les écarts de change. |
Investir à l’échelle mondiale n’est pas seulement une question de géographie; c’est aussi une question de monnaie. Les actions mondiales offrent une exposition à plusieurs devises, offrant une protection naturelle si le dollar canadien subit un choc lors d’un repli mondial ou d’une chute des prix des produits de base. |
| Caractéristiques des indices |
Le marché boursier canadien se démarque à l’échelle mondiale grâce à sa concentration dans les secteurs des ressources et de la finance, ce qui façonne son profil risque-rendement unique. Pendant les périodes de forte hausse des prix des produits de base, par exemple, les actions canadiennes peuvent offrir des avantages sur le plan de la diversification par rapport aux marchés mondiaux. |
Sur le plan sectoriel, le marché mondial est davantage axé sur les occasions de croissance, comme les secteurs des technologies de l’information et de la santé, comparativement au Canada. |
| Diversification |
Bien que le marché canadien soit plus petit et plus concentré, ce qui accroît la volatilité des rendements, il peut consolider les rendements totaux des actions lorsqu’il est jumelé aux actions mondiales dans une stratégie misant sur une certaine diversification. |
La diversification à l’échelle mondiale évite aux investisseurs de mettre tous leurs œufs dans le même panier d’actions. Selon l’indice mondial adopté, elle donne accès à de nombreux pays développés et émergents. |
| Potentiel d’alpha |
Le potentiel de valeur ajoutée provenant de la gestion active a été plus constant pour les actions canadiennes que pour les actions mondiales et a constitué une importante source de rendement supplémentaire. |
La gestion active dans les portefeuilles d’actions mondiales a généré de la valeur ajoutée, malgré les récents obstacles attribuables à la solide performance des sociétés technologiques. |
Pourquoi privilégier les actions canadiennes?
Les portefeuilles qui privilégient les actions canadiennes offrent la possibilité d’obtenir de meilleurs rendements boursiers globaux ajustés au risque que les portefeuilles exclusivement mondiaux. Ils présentent l’avantage d’un potentiel de valeur ajoutée plus constant grâce à une gestion active, ainsi qu’à un contexte économique favorable au Canada qui amplifie leur potentiel de croissance.
Perspective de rendement
L’analyse du rendement historique relatif des actions canadiennes (indice S&P/TSX) par rapport aux principaux indices boursiers mondiaux (indice MSCI Monde tous pays et indice MSCI Monde) met en évidence la résilience et les avantages que peuvent procurer une préférence pour les actions canadiennes. Même si les indices mondiaux se retrouvent souvent à l’avant-plan, on ne peut désigner un seul gagnant clair et constant. À l’exception de la dernière décennie, les actions canadiennes ont surpassé les actions mondiales pendant de longues périodes, selon leurs rendements sur des périodes mobiles de quatre ans, en dollars canadiens, par rapport aux indices mondiaux (Figure 1). Bien que les manchettes mettent l’accent sur les sept magnifiques qui alimentent les gains des actions américaines et mondiales, les actions canadiennes ont discrètement suivi le rendement des actions mondiales au cours des dernières périodes mobiles de quatre ans.
Figure 1 – Rendements des indices boursiers mondiaux par rapport à ceux des indices boursiers canadiens
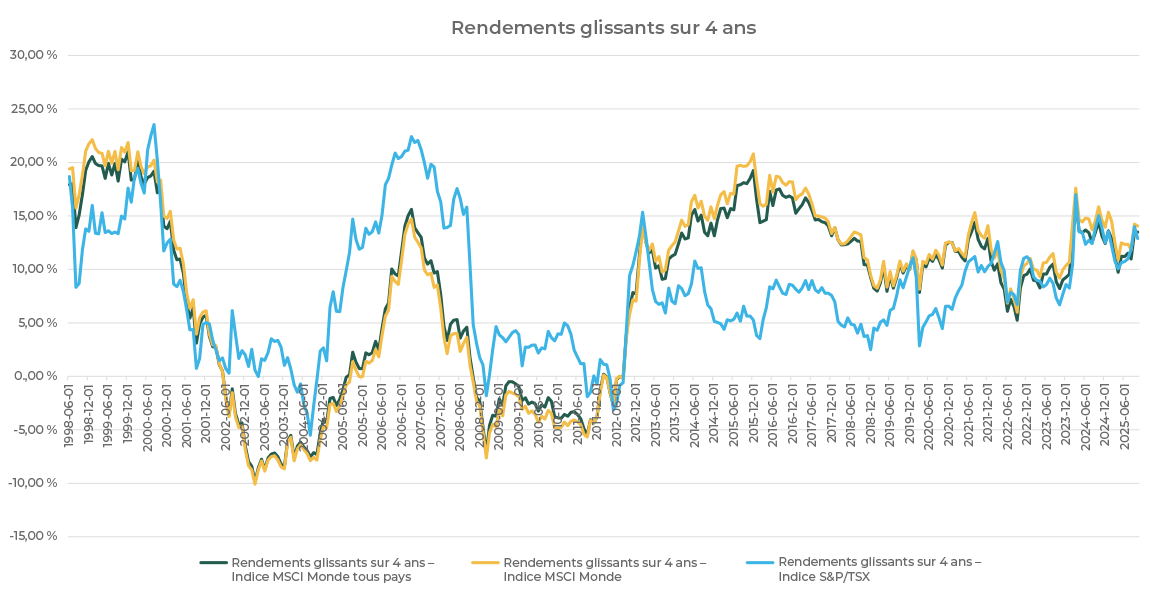
Sources : MSCI, FTSE et Bloomberg
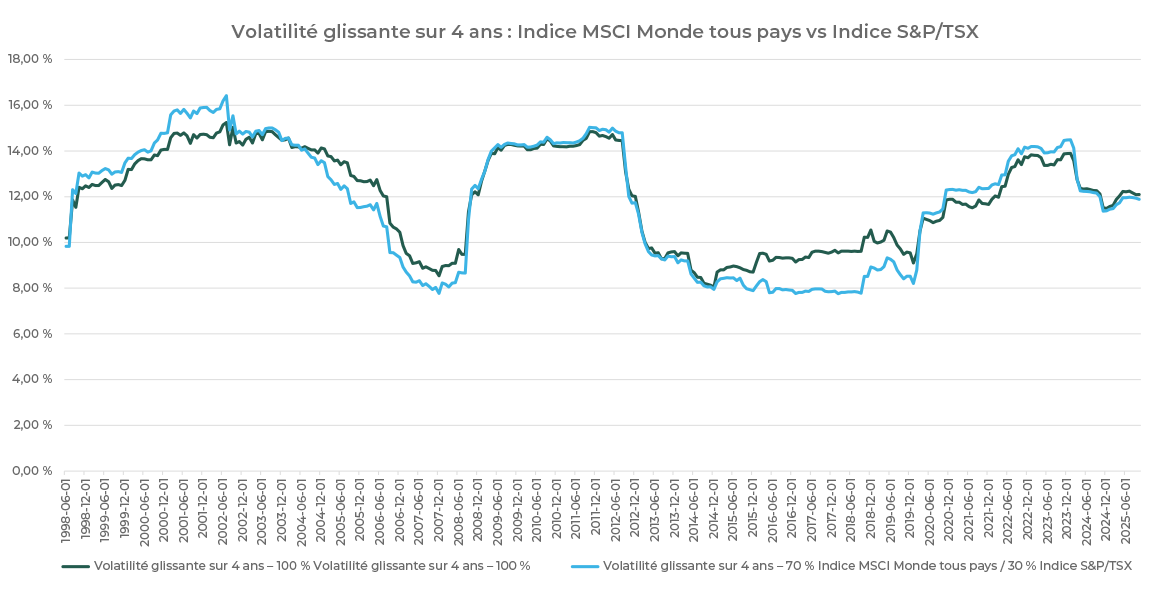
Lorsque l’on analyse la volatilité des indices boursiers canadiens et mondiaux, le portrait se précise, car les actions canadiennes sont généralement plus volatiles que les actions mondiales non couvertes (Figure 2). Cet état de fait concorde avec la concentration plus élevée du marché canadien par rapport au marché boursier mondial.
Figure 2 – Volatilité des rendements des indices boursiers mondiaux et canadiens
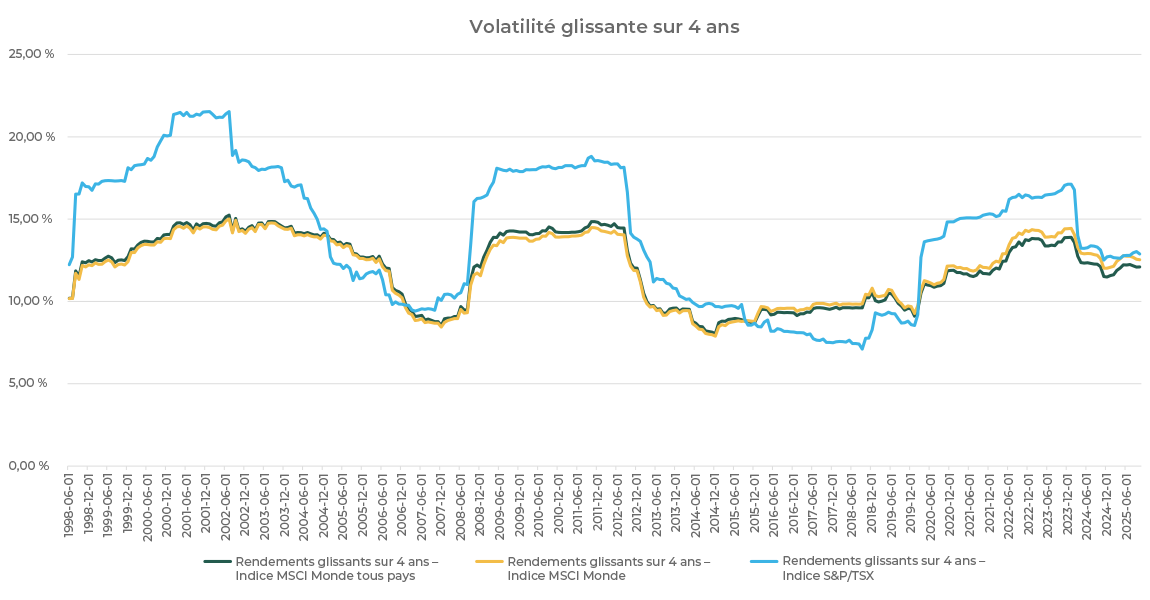
Sources : MSCI, FTSE et Bloomberg
Fait surprenant : les portefeuilles qui privilégient les actions canadiennes, plus que la capitalisation boursière de celles-ci, ont généralement connu une volatilité globale inférieure à celle d’un portefeuille strictement mondial, comme l’illustre un portefeuille composé à 70 % d’actions mondiales (indice MSCI Monde tous pays) et à 30 % d’actions canadiennes (Figure 3). Si l’on tient également compte du rendement sur une période mobile de quatre ans (Figure 4), cela signifie que les rendements ajustés au risque sont plus élevés dans une stratégie centrée sue le pays d’origine.
Figure 3 – Volatilité des rendements des indices boursiers mondiaux et canadiens
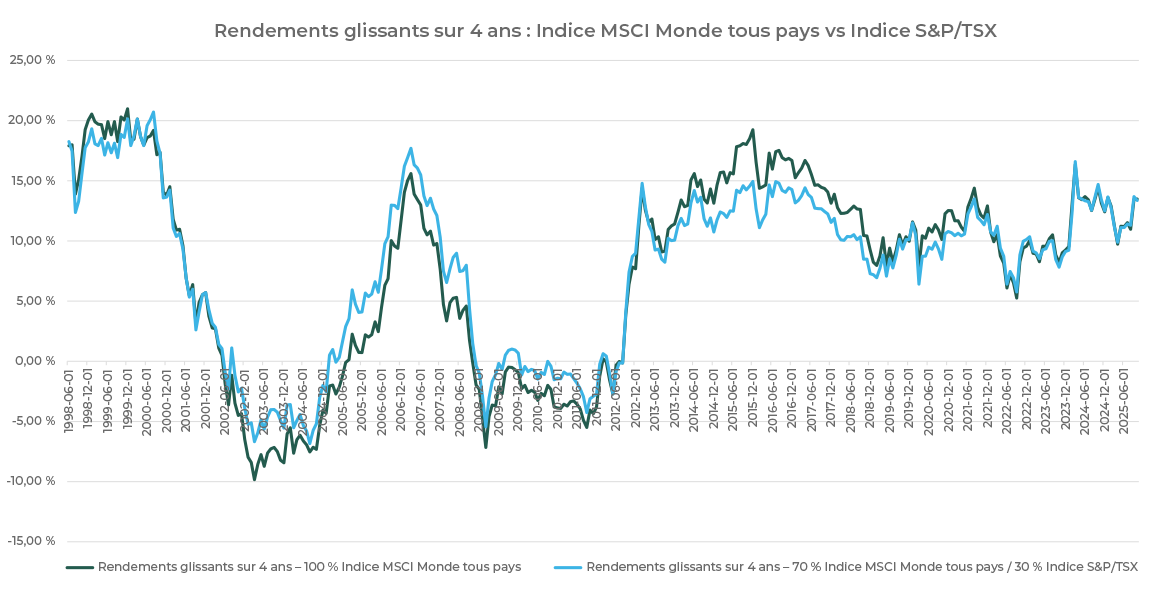
Sources : MSCI, FTSE et Bloomberg
Figure 4 – Rendements des indices boursiers mondiaux et nationaux
Sources : MSCI, FTSE et Bloomberg
Potentiel d’alpha
La gestion active offre la possibilité d’obtenir un rendement supplémentaire. Même si l’influence des actions liées aux technologies de l’information a récemment laissé entrevoir des difficultés pour les gestionnaires actifs en général, les gestionnaires d’actions canadiennes ont en moyenne dégagé une valeur ajoutée plus constante au fil du temps que les gestionnaires d’actions mondiales (Figure 5).
Figure 5 – Valeur ajoutée médiane des actions canadiennes par rapport aux actions mondiales
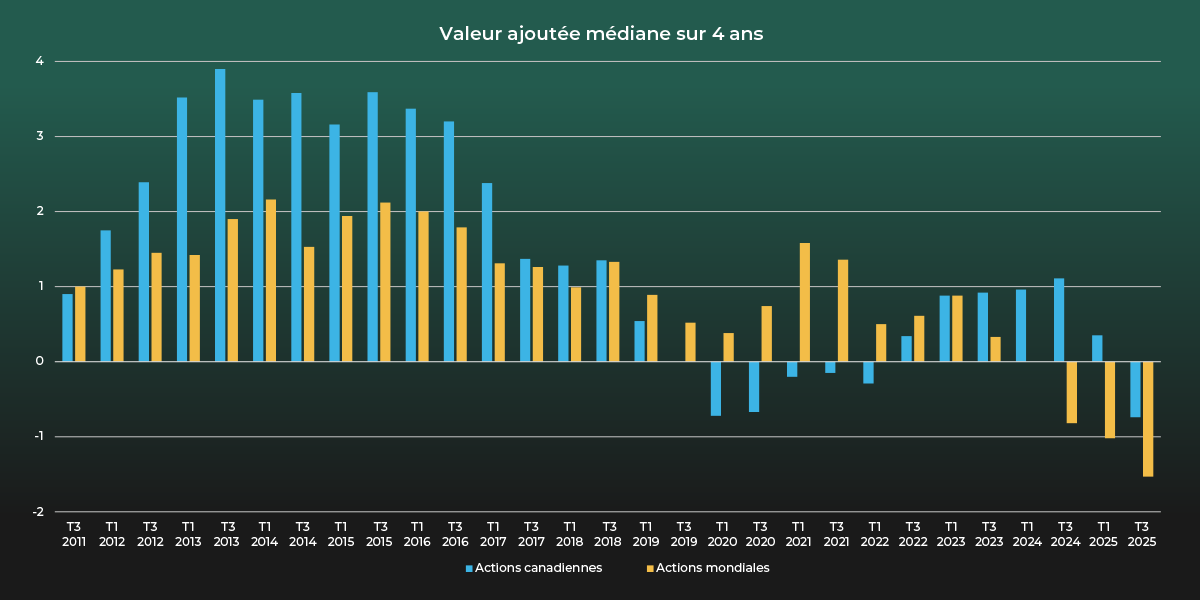
Remarque : Selon l’univers de gestion et l’indice MSCI Monde tous pays pour les actions mondiales.
Sources : eVestment, Groupe financier Connor, Clark & Lunn
Contexte économique actuel
Le Canada est bien placé pour offrir à la fois de la valeur et de la croissance aux investisseurs. Le pays entre avec confiance dans une nouvelle ère de croissance économique, stimulée par un programme favorable aux entreprises. Sous la direction du premier ministre Mark Carney, le pays adopte des réformes qui éliminent les barrières commerciales interprovinciales, simplifient la réglementation et accélèrent le développement des ressources et des infrastructures. Les mesures politiques, comme l’assouplissement de la taxe sur le carbone, témoignent d’un engagement plus large à faire du Canada un pays plus attrayant pour les entreprises. Parallèlement, les réductions vigoureuses des taux d’intérêt décrétées par la Banque du Canada et l’accent que met le gouvernement sur les mesures de relance budgétaire contribuent à stimuler la croissance intérieure.
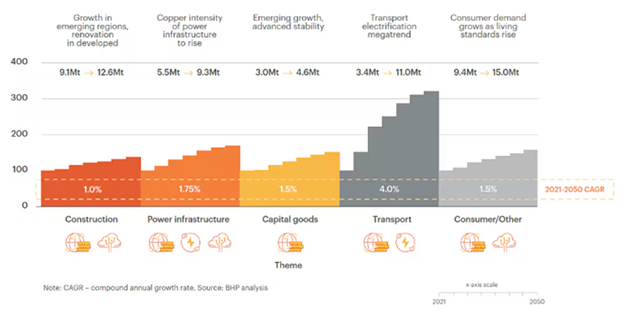
Les riches réserves canadiennes de matières premières qui seront essentielles dans le futur, comme le cuivre, l’uranium, l’or, les terres rares et le gaz naturel, devraient jouer un rôle crucial dans la transition énergétique mondiale. Par exemple, l’installation de nouveaux terminaux d’exportation de gaz naturel liquéfié sur la côte Ouest ouvre les portes aux marchés asiatiques. Le secteur bancaire du pays, réputé pour sa stabilité et sa réglementation rigoureuse, est un autre atout résilient dans un monde imprévisible.
Tirer parti des forces locales et des occasions mondiales
Bien que les actions mondiales offrent de nombreuses occasions de placement, une préférence accordée aux actions canadiennes dans la répartition totale des actions offre des avantages stratégiques, en particulier pour les investisseurs qui recherchent une stabilité en matière de devises, une exposition à un marché unique, une plus grande part de gestion active ainsi qu’une gestion plus efficace du risque. Une approche optimale pour la structure d’ensemble d’un portefeuille d’actions est une combinaison réfléchie d’actions canadiennes et d’actions mondiales qui affiche une préférence pour le pays d’origine.