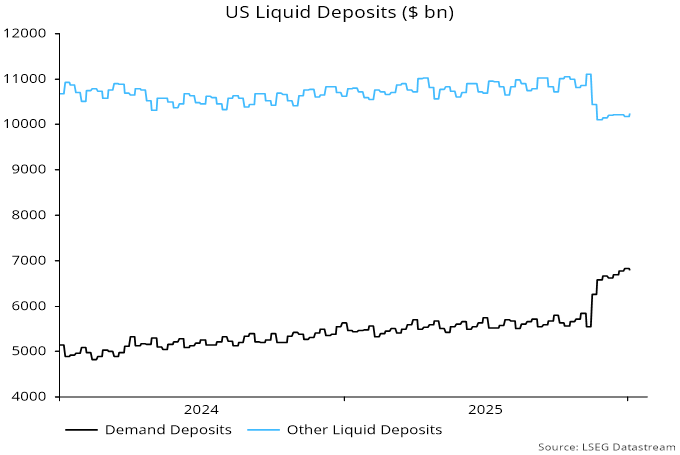
US demand deposits surged by 17% between October and December. A previous post argued that this was likely to reflect a reporting change, rather than a flow of money between accounts. The Fed’s Public Affairs office has confirmed this interpretation in response to a query:

“The large swings in demand deposits and other liquid deposits in November and December 2025 on the H.6 were due to a reclassification of deposits.”

The reclassification has not affected the official M1 and M2 aggregates, which include both deposit categories. It has, however, distorted the M1A measure tracked here – comprising currency in circulation and demand deposits – as well as narrow money indicators constructed by other analysts.

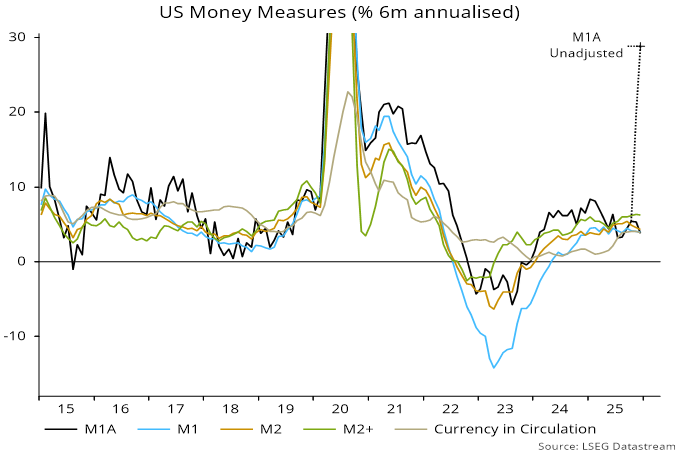
The procedure adopted here has been to “correct” the M1A numbers by assuming that growth of demand deposits in November and December would have equalled that of total liquid deposits in the absence of the distortion. Chart 1 compares annual growth rates of the unadjusted and adjusted series.

Chart 1

110226c1

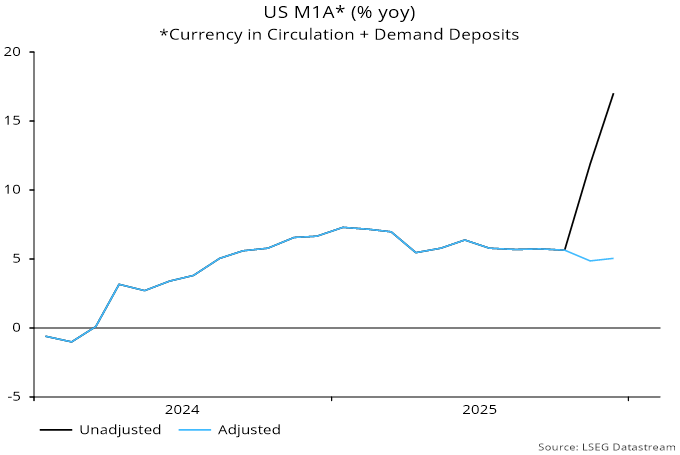
Claims have been circulating that US narrow money growth surged into end-2025, feeding narratives of excess liquidity and dollar debasement. Such claims appear not to account for the deposit data distortion and should be discounted.

Sunset aerial view of the Prophet's Mosque in Medina, Saudi Arabia.

MENA equity markets ended the fourth quarter of 2025 with a return of -4.3%, as measured by the S&P Pan Arab Composite (TR) Net Index, compared with a 4.3% gain for the MSCI Emerging Markets Index over the same period. For the year-to-date period ending December 31, MENA markets returned 4.1%, versus 30.6% for emerging markets (EM).

The region’s long US dollar and long oil exposure, combined with its under-representation in the AI theme, resulted in meaningful underperformance relative to MSCI EM Index in 2025. As regional specialists, we are not required to make allocation trade-offs between MENA and other EMs; however, we acknowledge that the bar for regional outperformance will remain high. The outlook for 2026 suggests a continuation of a weaker US dollar, lower oil prices and sustained capital flows toward AI-linked assets.

From our vantage point, we see a healthy opportunity set developing for the strategy as we enter 2026, driven by the following factors:

  • Following last year’s underperformance, MENA equity markets lost valuation premium relative to EM, and expectations heading into 2026 have been reset lower. As a result, valuation risk is limited, and we are seeing opportunities to select high-quality stocks that were caught up in broad market corrections – opportunities that have been scarce in recent years.
  • The region’s socioeconomic reform agenda remains one of the strongest structural investment themes across EM. These reforms should support non-linear profit pool growth in select industries, including financial services, technology, energy, infrastructure and real estate.
  • The recalibration of ambitious giga-projects in Saudi Arabia signals a more pragmatic approach to capital spending and resource allocation. This shift enhances policy credibility, which we view as essential for building investor confidence and ensuring sustainable public finances.
  • Capital market relevance continues to be a priority for regional governments. We believe this should translate into a broadly supportive market environment, characterized by investor-friendly policies and improved market investability.
  • Return dispersion across MENA markets – a theme we have discussed previously – remains pronounced. In 2025, the performance gap between Kuwait (the best-performing market) and Saudi Arabia (the weakest) reached a striking 34%. We continue to see sufficient idiosyncratic country-level drivers and market dynamics for dispersion to persist in 2026 and beyond. In addition, smaller markets such as Egypt, Oman and Morocco are experiencing a resurgence, positioning the strategy well to capitalize on these developments.

Entering 2026, the portfolio’s largest country overweights are Qatar and Egypt, where we favour the combination of attractive valuations, low investor positioning and visible growth. In Egypt, growth is already evident, while in Qatar we expect momentum to build later in the year as the country approaches its LNG windfall in 2027.

Conversely, we are underweight Kuwait and the UAE, having reduced exposure to financials in both markets due to valuation considerations and, in Kuwait’s case, lower confidence in policy support. In the UAE, we remain committed to our view that late-cycle opportunities in infrastructure and energy will outperform more cyclical segments such as financials and real estate, while acknowledging that this positioning did not perform as expected in 2025. In Saudi Arabia, the strategy remains modestly underweight; however, we retain strong bottom-up conviction in select opportunities across financial services, insurance and industrials.

We look forward to updating you on the strategy in our next letter.

Photo de TJ Sutter.

Dans une entrevue publiée par Benefits and Pensions Monitor, TJ Sutter de Gestion de placements CC&L, présente une analyse approfondie des stratégies permettant aux investisseurs d’évoluer dans le contexte complexe actuel des titres à revenu fixe.

« Les gens sont encore un peu marqués par 2022. Ils ne considèrent plus la duration comme le bastion de la résilience du portefeuille qu’elle était auparavant », a déclaré TJ Sutter, gestionnaire de portefeuille et chef de l’équipe des titres à revenu fixe de Gestion de placements CC&L, soulignant une remise en question des stratégies par les investisseurs institutionnels. « Les gens adoptent une approche plus créative », a-t-il ajouté, précisant qu’ils recherchent également des indices de crédit à court terme, une duration couverte et des flux de rendement non corrélés.

TJ commente également le rôle des gestionnaires de placements dans le secteur des titres à revenu fixe :

« Le gestionnaire médian des titres à revenu fixe surperforme le marché, contrairement aux actions. Cela me démontre qu’il existe des preuves de compétences sur le marché des titres à revenu fixe », a-t-il dit, ajoutant que trop souvent, les investisseurs se concentrent aux rendements sans examiner ce qui les génère réellement.
 
Lire l’article complet

A January post noted the possibility that global six-month real narrow money momentum had crossed below industrial output growth in December, suggesting less favourable monetary conditions for markets. Recent dramatic sell-offs in some speculative assets could reflect such a shift.

The suggestion is still tentative: additional – but not yet complete – December data indicate that the two series converged rather than intersected – see chart 1.

Chart 1

060226c1

Will a cross-over be confirmed soon? Monetary prospects are uncertain but stronger January manufacturing PMI results suggest a rise in six-month industrial output momentum in early 2026.

In data since 1970, global equities outperformed US dollar cash significantly on average in months following a positive reading of the gap between real money and output momentum (by 12.0% annualised). (The calculation allows for reporting lags.)

By contrast, negative gaps were associated with average underperformance in the following month (of 5.5%).

Needless to say, these averages conceal frequent “misses” in both directions.

The six-month real money / output momentum gap was positive in most months in 2025. It was, however, negative in 2023 and much of 2024, when equities rallied strongly.

As previously discussed, the six-month gap was a misleading guide to “excess” money over this period because of a large monetary overhang from the money growth surge in 2020-21.

A simple way of illustrating this overhang is to compare five-year growth rates of real money and industrial output. Real money growth was still much higher in 2023 – chart 2.

Chart 2

060226c2

The five-year gap turned negative last year. It last closed in the early stages of the GFC bear market.

Back then, the six-month gap had been negative for more than a year. The closing of the five-year gap was followed by an acceleration of the market decline.

With the five-year gap already negative, a negative shift in the six-month gap could be reflected in more immediate market weakness than in 2007-08.

Global manufacturing PMI new orders recovered strongly in January following a November / December relapse. Both the fall and revival had been signalled by money trends: global six-month real narrow money momentum declined sharply in April / May 2025 but rebounded into November. The seven-month interval between a (revised) May low in real money momentum and the December PMI trough matches the lead time at the prior two turning points – see chart 1.

Chart 1

030226c1

The rise in real narrow money momentum into November suggests that the PMI upswing will extend into Q2. As foreshadowed in a previous post, however, real money momentum declined sharply in December, retracing most of its May-November gain. Accordingly, the manufacturing bounce is expected to fizzle out in Q2, with renewed weakness into Q3.

Real narrow money momentum has slowed across most major economies, though to varying degrees. China and India have contributed most to the global decline, although the Indian number remains strong – chart 2.

Chart 2

030226c2

The US series shown incorporates an adjustment for a suggested distortion to demand deposit data affecting the M1A measure used here. However, substituting the official M1 measure – unaffected by the mooted distortion – for M1A would give the same current reading.

Eurozone momentum remains above the US level while the UK has recovered from significant weakness in mid-2025, suggesting improving relative economic prospects. Still, both series have stalled at modest levels, cautioning against optimism.

Japanese real narrow money contraction continues to flag a policy mistake, while a faster decline in Brazil argues for urgent rate cuts. (The Brazil manufacturing PMI was the weakest in the global stable in January.)

Elsewhere, prior strength in Australian real narrow money momentum is consistent with recent upbeat economic news but a slowdown since September suggests that prospects were cooling before this week’s rate hike.

Eurozone and UK money trends have shown disappointingly small responses to policy easing, suggesting that rates remain in restrictive territory and casting doubt on hopes of stronger economic growth.

The preferred monetary aggregates here are “non-financial”, covering households and non-financial corporations. Money holdings of financial institutions are volatile and less informative about near-term economic prospects.

A recovery in six-month growth rates of Eurozone narrow and broad money stalled in early 2025 despite the ECB continuing to cut rates through June, with both well below pre-pandemic averages – see chart 1.

Chart 1

300126c1

The UK profile is different. The laggardly pace of rate cuts appears to have contributed to a relapse in growth rates in H1 2025 but these recovered into November, moving sideways in December – chart 2.

Chart 2

300126c2

While suggesting UK relative improvement, narrow money expansion remains beneath its pre-pandemic average (and the Eurozone level), with annual broad money growth a below-par 3.8% (versus 2.7% in the Eurozone).

One reason for the disappointing responses is that policy rate cuts have yet to translate into a decline in longer-term yields. Relatedly, UK QT has been a significant and unnecessary drag.

A hopeful scenario is that low inflation implied by weak broad money trends will allow longer-term yields to subside. Still, additional policy adjustment will likely also be required to generate a monetary response sufficient to warrant economic optimism.

Sergels Square, Stockholm, Sweden.

Retail brokers have benefited immensely from the impact of retail investors on financial markets since the onset of COVID. Robinhood is now a familiar name to most Americans, but virtually all the brokerages globally have benefited from the rising tide of retail investors’ enthusiasm for investing and trading. In this note, we examine some of the mega-trends that have helped European brokerages outperform the market since COVID emerged in 2020.

1. Retail participation and retail financial product availability.

Since the 2008 recession, retail investors have gained access to a multitude of new products like index ETFs, crypto, fractional shares, robo-advisors, IPOs and even private markets. This led to an explosive growth in retail investment, especially since 2020 and the dawn of COVID. Digital and mobile platforms, along with significantly reduced commission costs, have made it easier than ever for a younger demographic to access the markets. The vast majority of onboarded customers over the last decade have not lived through the trauma of the 2008 recession and see any market pullback as an opportunity to double down on their favourite stocks.

2. Increase in cross-border trading.

It is well documented that investors, including retail, have historically had a strong home bias in their asset allocations. But the US stock market outperformance since 2009, along with the disproportionate share of tech mega-cap attention, has led to consistent inflows into the US market. It has also created a larger level of familiarity with US companies that are more covered/discussed by pundits. All this has led to a higher level of cross-border trading in non-US brokerages that is typically much more lucrative as they usually pocket a large spread on foreign exchange transactions.

3. Digitalization and banks losing market share.

Over the last decade, brokerages have been able to consistently gain market share from large banks, thanks to a less-bloated corporate structure and a tech stack that could be built from scratch and not built on legacy bank structures. This has allowed them to be in a position to compete more aggressively on fees, transaction costs and overall value proposition as retail brokerage fees remain a minuscule proportion of mega-banks’ revenue and don’t garner a lot of attention from a strategic perspective.

4. Increase in share of income from NII.

Although net interest income (NII) has been declining for European brokers since the end of 2023, decreasing with the ECB rates, it remains at a more attractive level than pre-COVID and is expected to remain as such for the foreseeable future. Additionally, most brokers have been able to increase NII since 2023 thanks to client gains and account cash balance more than compensating for the lower rates.

Brokers have also been more efficient at increasing the spread between the amount they pay on deposit and the amount they get paid (known as net interest margin or NIM). Having managed deposit pass-through well on the way up and down, brokers are now better structurally positioned to benefit from deposit growth.

5. Benefit from macro volatility.

A key feature of brokerages’ stocks in a portfolio is their positive skew to market volatility. Because they make money from the number of trades, they are agnostic to market direction, as long as it causes participants to trade more. Just over the last year or so, events such as the US election, Liberation Day, the French budget and now the Venezuela situation have all been positive tailwinds mentioned by various brokerage CEOs.

It’s worth noting, however, that brokerages are not immune to long periods or volatility or market drawdown, all of which would lead customers to reduce their equity exposure.

We gained exposure to the retail brokerage space in one of our strategies through Nordnet (SAVE SS), a Swedish brokerage firm with a banking licence. It has exposure primarily to the Nordics with a top-two position in all markets and is slowly working on building a presence in Germany. It derives a bit more than half its revenue from commission and the rest from interest income.

Sweden is one of the countries with the highest savings rate globally, and financial literacy is also higher than the Europe average. Finland, Norway and Denmark also rank highly but are less penetrated and less competitive than Sweden. All have been a strong source of growth for Nordnet, which has consistently been among the top names in the space for customer satisfaction.

Given its diversified product offerings that include a full suite of investments, savings, pension and banking products, as well as its best-in-class technology platform (releases an update every 2.5 days on average and with a 99.9% platform uptime), Nordnet is able to maintain a customer acquisition cost of SEK790 – which is below the vast majority of peers – and its small social media platform has been able to generate a strong media presence and customer engagement.

Here is where Nordnet stands on the brokers mega-trends:

  1. Financialization: Sweden is one of the countries in Europe with high financial literacy. Other Nordic countries rank above average as well.
  2. Cross-border trading: Between 2022 and 2025, share of cross-border trading increased from 27% to 31.5% and is one of the primary contributors to the increase in income per transaction increasing from SEK31 to SEK39 over that same period.
  3. Digitalization and market share gains: Both Nordnet and its close competitor, Avanza, have gained tremendous market share over the last decade and now rank second and first respectively by trading activity. This is despite still being behind Sweden’s largest four banks on savings capital. They both rank top of their class on user experience surveys.
  4. Net interest income: NII was as low as 20% of overall revenue in 2021 and is now steadying at 42% of total revenue after peaking at 58% in 2023. We expect the share of NII to remain structurally higher than pre-COVID.
  5. Macro volatility: Nordnet benefited from large macro events such as the US election and Liberation Day. In Q2 2025, following Liberation Day, Nordnet reported a 22% year-over-year (YoY) increase in trading volume. As for the US election in 2024, it saw a 14% YoY increase in trading volume.

Despite the volatility of their operational performance, brokerage firms provide a unique type of exposure to a diversified portfolio, one that is very different to how you would think of typical insurance and bank financials. There are reasons to believe brokers will continue to outperform the overall market and will continue to look for opportunities to participate.

Extérieur d'un magasin d'alimentation Sobeys ; extérieur de l'immeuble de bureaux situé au 145 Wellington Street West à Toronto, en Ontario.

Investissements immobiliers Crestpoint Ltée (Crestpoint) a annoncé aujourd’hui avoir acquis un portefeuille composé de 22 immeubles de commerciauxet de deux immeubles de bureaux.

Le portefeuille comprend environ 1 million de pieds carrés répartis dans 22 immeubles commerciaux bien situés, y compris 15 sites à locataire unique et 7 centres articulés autour d’épiceries et de pharmacies. Comptant des actifs au Manitoba, au Québec et, surtout, en Ontario, le portefeuille donne accès à une vaste diversification géographique et une exposition à certains des marchés de détail les plus résilients au Canada. Le portefeuille est entièrement loué à des détaillants offrant des services essentiels dans les segments de l’épicerie, de la pharmacie et de la rénovation résidentielle, et compte des locataires reconnus à l’échelle nationale comme Pharmaprix, Sobeys, Walmart, Metro et RONA, et s’articule autour de ceux-ci.

Le portefeuille comprend deux immeubles de bureaux, le premier étant un immeuble de catégorie A, situé au 145 Wellington St. W., dans le centre financier de Toronto, à proximité du métro. L’immeuble est occupé par un éventail diversifié de locataires, notamment des entités du gouvernement fédéral, des organismes à but non lucratif, des sociétés d’ingénierie et des compagnies d’assurance, ce qui lui confère une exposition à la fois au secteur public et à des locataires privés de grande qualité.Les taux de location actuels demeurent inférieurs au niveau du marché, offrant un potentiel de hausse important et soutenant une forte croissance des revenus au fil du temps. Le deuxième immeuble de bureaux est situé à Markham, en Ontario, et compte un locataire unique occupant la totalité de ses 75 000 pieds carrés sur un terrain de 3,5 acres, situé à proximité de l’avenue Warden, de l’autoroute 407 et de commodités commerciales.

Crestpoint acquiert une participation de 100 % dans ce portefeuille au nom de la Stratégie immobilière opportuniste Crestpoint (son fonds à capital fixe).

Il s’agit de la quatrième acquisition de la Stratégie immobilière opportuniste Crestpoint, qui a pris fin le 19 décembre 2025 et qui a déjà déployé plus de 70 % de ses engagements en actions.

Photo de Michael Mortimore

Dans le cadre d’un article intitulé « ‘We need to take Trump seriously’: Investors brace for a ‘multipolar world’ of fragmented trade deals », Michael Mortimore a discuté avec Benefits and Pensions Monitor des raisons pour lesquelles les investisseurs doivent prendre au sérieux la transition actuelle vers un monde multipolaire, alors que les politiques tarifaires dictées par Donald Trump et la dynamique commerciale fragmentée transforment les marchés mondiaux.

« Nous devons prendre Donald Trump au sérieux, en ce sens qu’il est absolument déterminé à réorganiser le commerce mondial et à se pencher sur ce qu’il considère comme des déséquilibres », a prévenu M. Mortimore, ajoutant que les replis périodiques face aux véritables menaces tarifaires reflètent des préoccupations à l’égard de conséquences fortuites plutôt qu’un changement d’humeur fondamental.

Il souligne également que la faiblesse du dollar et l’évolution des réactions des marchés créent de nouvelles occasions pour les marchés émergents.

« Je pense qu’il est un peu préoccupant que les taux augmentent par suite de ces annonces pendant que le dollar se déprécie, mais nous y sommes maintenant habitués, que ce soit sur les marchés émergents ou les marchés en général. Si cette variation est relativement limitée, cela pourrait être particulièrement positif pour les actifs qui ne sont pas libellés en dollars », a-t-il reconnu.

Lire l’article complet ici (en anglais).

US narrow money is growing slowly, casting doubt on expectations of economic strength. Broad money growth is faster but still within a normal range (and has been less informative about near-term economic prospects historically).

December numbers support the contention in a previous post that the Fed series for demand deposits has been distorted by the inclusion in mid-November of accounts previously classified as savings deposits. Weekly figures show a large jump over two weeks*, with a corresponding drop in “other liquid deposits”, which includes savings deposits. Demand deposits have since returned to weak expansion – see chart 1.

Chart 1

280126c1

The distortion has affected the M1A narrow money measure calculated here, comprising currency in circulation and demand deposits. Similar reclassifications appear to have occurred in several months over 2020-22, following removal of reserve requirements in March 2020, which effectively equalised the treatment of demand and savings deposits. The procedure adopted then was to assume that monthly growth of demand deposits would have matched that of total liquid deposits in the absence of the distortion.

Applying the same adjustment now suggests “true” six-month growth of M1A of 3.8% annualised in December, down from 5.3% in November. This is very similar to growth rates of the official M1 and M2 measures, as well as currency in circulation (3.9%, 4.3% and 3.9% respectively) – chart 2.

Chart 2

280126c2i

A broader “M2+” aggregate rose by 6.2% annualised over the same period, reflecting strong expansion of institutional money funds. (Official M2 includes retail but not institutional money funds.) Still, this growth rate is within an acceptable range of a suggested 5% pa “target” – the average over 2015-19, a period of moderate economic growth and inflation quiescence.

*The inclusion would have occurred on a single day but weekly numbers are averages, so the impact of a mid-week change would be spread over two weeks.