A look at the potential impact of President Trump’s policies on emerging markets, the risks of rising trade tensions with China and the resilience of China’s domestic market
US politics has shifted to the right with an unexpected red sweep of the presidency, Senate and House. Gloomy prognostications for emerging markets abound on expectations for a stronger dollar, stickier inflation and a less dovish Fed. Yet there is very little to go on in terms of hard policy. For example, would President Trump risk a tit-for-tat tariff spiral with China and the EU, or will he pursue deals which incentivise foreign exporters to build manufacturing assets in the US to secure exemptions or reductions? The EU has done something similar with Chinese carmakers.
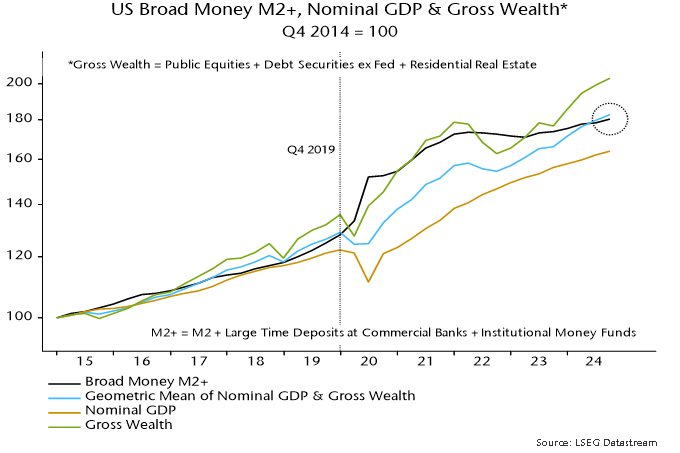
On inflation, increased deficit spending may be inflationary from 2026 onwards, but our broad money signals suggest the current backdrop is still disinflationary and likely to force a flat-footed US Fed into playing catch-up in its cutting cycle in the short term. This should be weighed against the assumption that Trump means a strong dollar. Further out, with mid-term elections occurring in November 2026, the re-election of the House and a third of the Senate could provide a check on the fiscal agenda.
Should risks of rising trade tensions materialise, this may make EM countries with large domestic markets (i.e., China and India) relatively more attractive versus smaller, open, trading economies in ASEAN.
Overall, our instinct is to avoid knee-jerk repositioning on speculation, at the risk of being whipsawed down the road should events differ from expectations. The reality is that the anti-tyranny checks embedded in the US constitution mean that the president has less power than we commonly think. Our view is that it will pay to remain focused on the cyclical and structural factors at play in shaping return prospects across equities and other asset classes.
Stock picking in a China bull market
Chinese equities took off in the final week of September, rising around 25% in USD terms as announcements of incoming and meaningful monetary and fiscal stimulus blew away traders shorting H-shares and sparked significant domestic inflows. Foreign investors remained on the sidelines.
China equities flows: Domestic vs. foreign investors
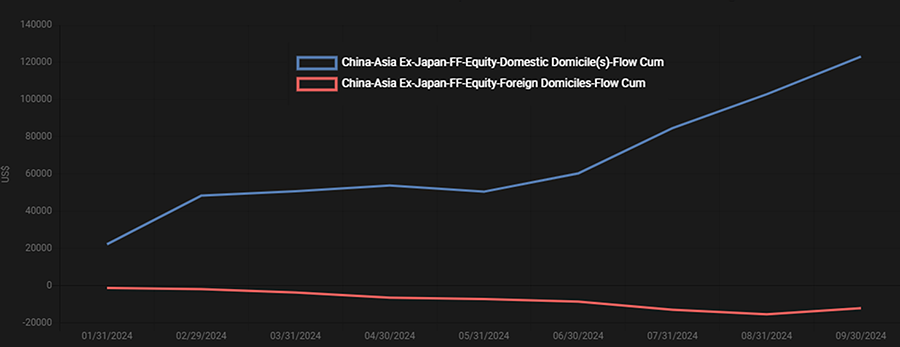
Source: EPFR
The rally was so big that Chinese stocks are virtually level-pegging US equities as at the end of October.
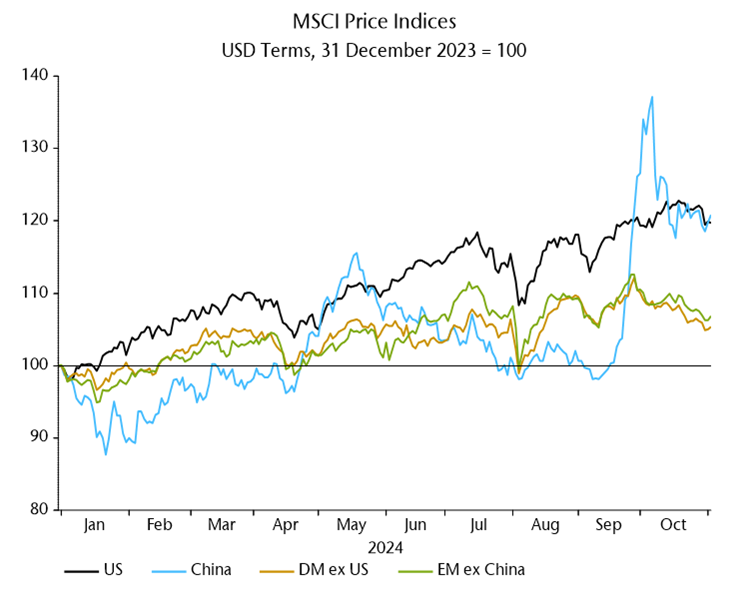
Source: NS Partners; LSEG Datastream
This spurt, led by beaten-down names including property developers and domestic insurers (with high property exposure), is likely the first leg of this rally. We see the pullback in recent weeks as an opportunity to reposition more aggressively at the margins (from a defensive equal weight). While stimulus won’t be a bazooka on the level of 2008-09, the imprimatur for the measures from Xi Jinping himself suggests they will keep coming until we see at least stabilisation in the Chinese economy.
While the threat of tariffs looms for exporters, China has a huge domestic economy with a deep equities market. Direct exports of goods to the US account for only 2.6% of Chinese GDP, less than for Japan and Germany.
With stocks still trading only slightly above their lows of around 10x CAPE, there is an opportunity for deep fundamental analysis to unearth high quality and growing names that have been knocked by investor revulsion for Chinese equities.
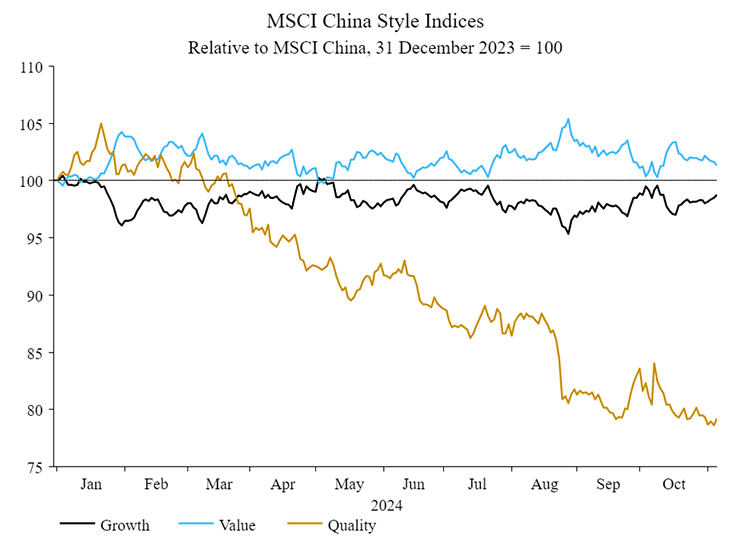
Source: NS Partners; LSEG Datastream
For those interested, a short primer on our stock picking approach below – skip ahead for our coverage of current stock opportunities in China.
Our approach to stock picking – focus on economic value added (EVA)
Made famous by Stern Stewart & Co., the approach homes in on the spread between the rate of return on a company’s invested capital and its cost of capital; economic value added, or EVA for short.
Why? We know that over the medium to long term, EVA is directly tied to the intrinsic value of any company and the fuel that fires up a company’s stock price.
Stock prices reflect how successfully a company has invested capital in the past and how successful it is likely to be at investing new capital in the future. EVA is the best methodology to measure the value that management has added to, or subtracted from, the capital it has employed over time.
How can management create value?
Bennett Stewart in his book The Quest for Value boils it down to three drivers:
- The rate of return earned on the existing base of capital improves; that is, more operating profits are generated without tying up more funds in the business.
- Additional capital is invested in projects that return more than the cost of obtaining new capital.
- Capital is liquidated from, or further investment is curtailed in, substandard operations where inadequate returns are being earned.
We are looking for companies that can be expected to generate high or improving returns on the capital employed in their businesses. These are companies run by management teams laser-focused on making investments that earn more than the cost of capital, and undertaking all positive net present value projects, while rejecting or withdrawing from all negative ones.
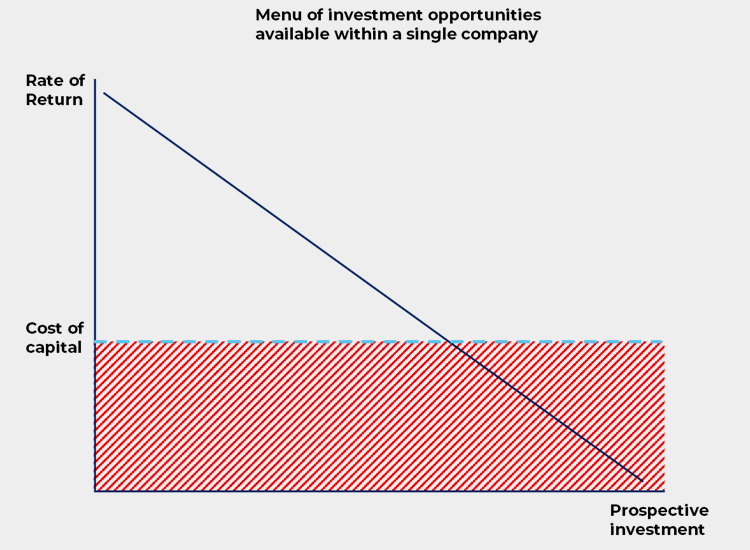
Source: Bennett Stewart (1991), The Quest for Value
Understand what drives returns
Value creation is not enough for long run success. We need to know whether it can be sustained. Our process is focused on identifying the drivers of these returns and assessing:
- whether there are historic changes or potential catalysts for improved value creation that are yet to be reflected in market prices; and
- the sustainability of those returns – are there enduring competitive moats that will protect excellent returns on invested capital?
Our approach identifies highly productive and capital-efficient companies pursuing value creation in a variety of ways. It also focuses on whether that value creation is sustained via competitive moats.
Moats can take a number of forms, from differentiation via proprietary tech, brands or prime locations, to high switching costs, network effects, cost leadership, economies of scale or minimum efficient scale.
Investment edge
This strategy got its start just as the Asian Financial crisis of 1997 unleashed havoc across the region before spilling over into Latin America and Eastern Europe. We know firsthand through several cycles that emerging markets expose investors to both great opportunity but also the potential for downside shocks. Investors have endured a torrid decade in EM equities, but the signals we track suggest an improving outlook. We aim to capture that opportunity through a combination of identifying robust and growing companies compounding ROICs coupled with liquidity and macro analysis – the heart of an all-weather approach that has delivered outperformance over the long run.
Eastroc – The domestic energy drink champion
The potential for China’s economy to stabilise on stimulus efforts could feed the next bull market in China. While China looks cheap across the board, our view is that laggard quality growth names look particularly attractive.
Source: NS Partners; LSEG Datastream
Eastroc Beverage fits the bill as a fast growing, highly profitable and yet attractively valued domestic energy drink champion.

P/E has drifted lower while earnings have held up
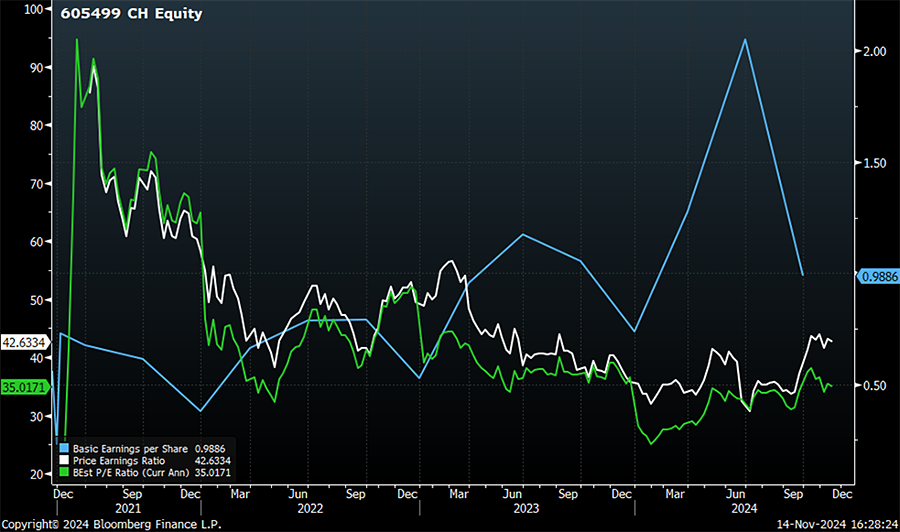
Source: Bloomberg
There is plenty of headroom for growth in the segment, with energy drink consumption by volume in China at only 58% of Japan, 32% of the US, and 23% of the UK (Source: Bank of America). Growth drivers include the expansion of the gig economy, along with new consumption channels in music concerts, e-sports and parties. While major cities are posting healthy consumption growth of c.10% CAGR, peripheral markets are growing rapidly at c.35-40%.
Red Bull stumbles
Eastroc is mounting a fierce challenge to incumbent Red Bull, growing market share from 5% in 2012 (with Red Bull at 80%) to nearly 30% in 2023. Not only has Eastroc been effective in building its distribution network out from its Guangdong home base in Southern China, it has also been able to capitalise on strategic missteps from the incumbent. A fallout over a lapsed distribution agreement between Red Bull’s Thai and Chinese operators has spiralled into open warfare over the market. The bickering sister companies are fighting each other in provincial courts, launching rival marketing campaigns and even different pricing strategies. Eastroc offers distributors higher margins and pricing stability, making them more willing to stock the challenger’s inventory. In addition, Eastroc offers value at around half the price per 500 ml of Red Bull, so benefiting from consumers trading down in a weak economy.
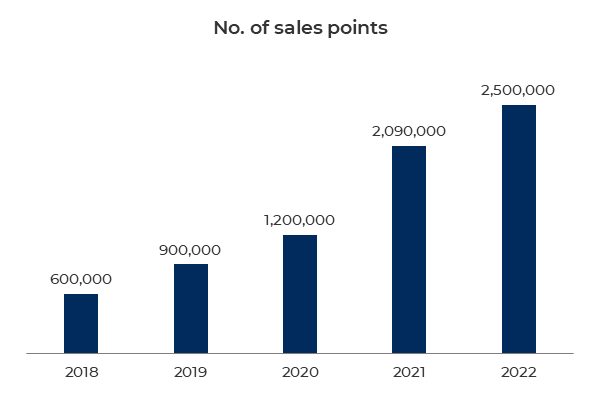
Source: Eastroc Beverages 2022
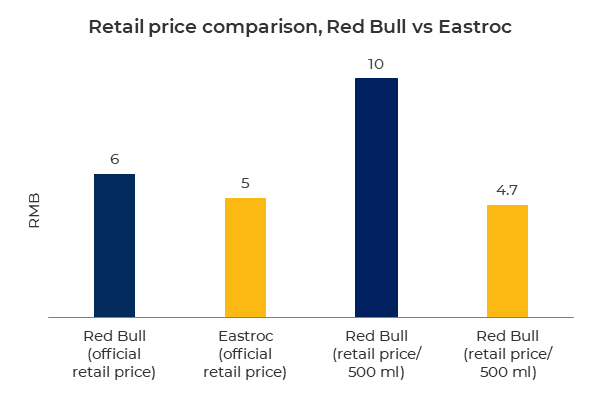
Source: Eastroc Beverages 2022
Optionality through new product lines
What we find particularly interesting is the potential for new growth drivers outside its flagship energy drink. Healthier and plant-based energy drinks targeted at women, electrolyte drinks targeted at sporting activity and sugar-free teas can are all large and fast growing segments.

Source: Eastroc Beverages 2024
Eastroc already has a strong distribution network to sell these new lines into, meaning the investment to drive this growth will be relatively small, boosting returns on capital.
Our kind of business – EVA, cash flow and Du Pont tests (charts and data below from Bloomberg)
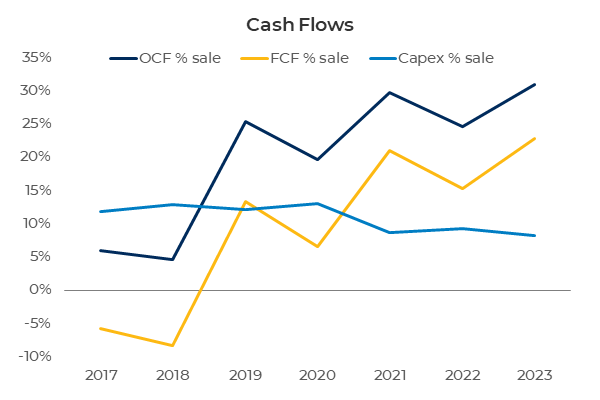
Growth requires capex to build out the distribution network, and yet Eastroc looks like a cash machine.
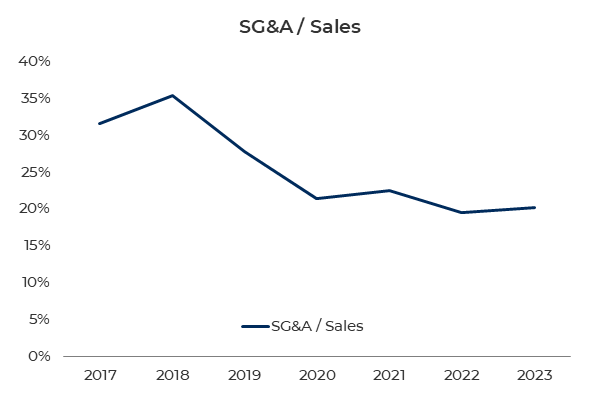
Overheads look contained as it expands.
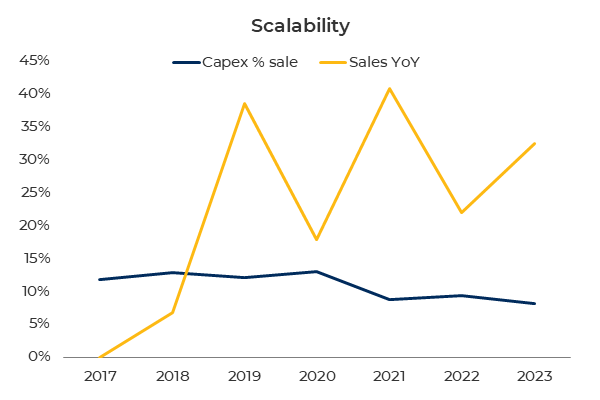
This business scales well.
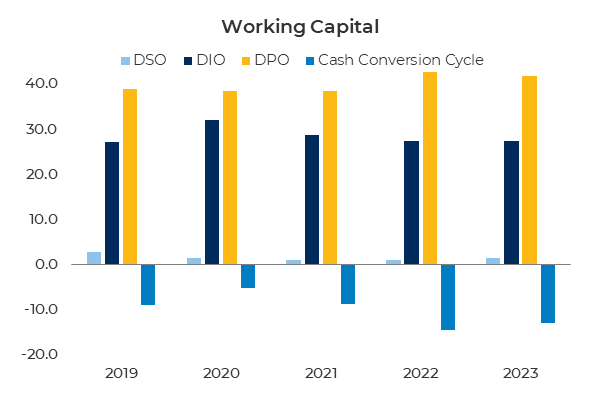
Paid by customers early while pushing out payables.
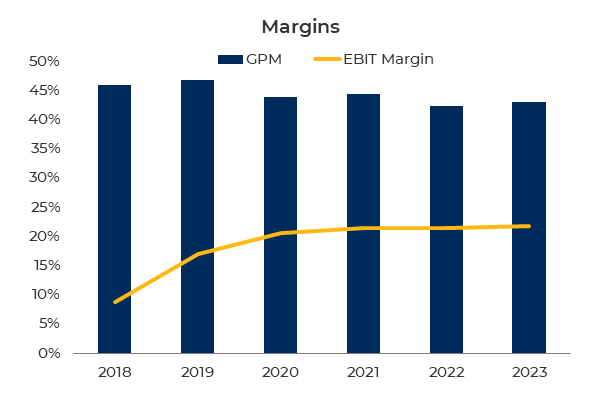
Margins are resilient.
Unsurprisingly, the EVA (ROIC/WACC spread) is high and set to rise over the next 2-3 years.
Opportunity among the quality names in China
Eastroc is the fast-rising challenger to Red Bull in China and enjoying strong growth tailwinds in the energy drink segment. The company is able to squeeze more value from its established network in Guangdong without tying up significant capital. The capital that it does invest is used to expand carefully into new territories that promise returns that far exceed the cost of capital.
Eastroc is the type of stock we would expect to outperform should this upward move in Chinese equities mature into a wider bull market. CCP stimulus efforts are not yet enough to shift consumer sentiment meaningfully, but valuations are compelling and the growth is there for companies like Eastroc to perform regardless.