The MPC’s slowness to cut rates risks aggravating a recent loss of economic momentum and prolonging an inflation undershoot.

The expected 25 bp cut in November would be insufficient to catch up with reductions to date in the Eurozone, Sweden, Switzerland and Canada – see chart 1.

Chart 1

20241023_NSP_MMM_C1_MainPolicyRates

UK annual headline consumer price inflation is as low or lower than in all these jurisdictions except Switzerland – chart 2.

Chart 2

20241023_NSP_MMM_C2_HeadlineConsumerPrices

The MPC’s focus on the « core services » third of the inflation basket is misplaced. Monetary conditions determine aggregate inflation, with the component breakdown partly shaped by “exogenous” factors. A fall in energy prices and slowdown in food costs have suppressed headline inflation while allowing consumers to spend more on other items, delaying price deceleration in these areas.

This suggested that services disinflation would speed up as commodity prices stabilised or recovered, a development that appears to be playing out – chart 3.

Chart 3

20241023_NSP_MMM_C3_UKCoreServicesexRentsCPI

Six-month consumer price momentum continues to mirror the profile of broad money growth two years earlier, a relationship suggesting a further decline and extended undershoot of the 2% target. A recovery in six-month broad money momentum has stalled below the 4.5% pa level historically consistent with 2% inflation – chart 4.

Chart 4

20241023_NSP_MMM_C4_UKConsumerPricesBroadMoney

UK six-month real narrow money momentum is negative and similar to levels in the Eurozone, Sweden and Switzerland, suggesting equally poor economic prospects – chart 5.

Chart 5

20241023_NSP_MMM_C5_RealNarrowMoney

The double dip mooted in an earlier post could be under way. Recent signs of a loss of momentum include a faster rate of decline of job vacancies and an increase in small firm earnings downgrades – chart 6.

Chart 6

20241023_NSP_MMM_C6_UKGDPVacanciesFTSmallCapEarningsRevisionsRatio

The previous government’s fiscal plans implied significant tightening in 2024 and 2025, according to the OBR – chart 7. Changes to the fiscal rules to be announced by Chancellor Reeves will allow for additional medium-term borrowing but are unlikely to alleviate near-term restriction.

Chart 7

20241023_NSP_MMM_C7_UKPublicSectorCyclicallyAdjustedNetBorrowing

It might be expected that the MPC would be especially sensitive to downside risks, following its mistake of responding too late in the opposite scenario in 2021-22 when inflation was starting to rip. Could confirmation of economic weakness and a restrictive Budget yet put a warranted 50 bp on the table for November?

post last month suggested that Chinese money growth was bottoming, based on year-to-date policy easing and the space for additional stimulus opened up by a stabilisation of the currency. September money numbers and recent policy announcements bolster this assessment but the scale of monetary acceleration is uncertain.

As previously discussed, narrow money measures have been distorted by regulatory changes in April that reduced the attractiveness of demand deposits, arguing for giving greater weight to broader aggregates. Six-month growth of the preferred broad measure here – M2 excluding deposits of non-bank financial institutions – bottomed in June, edging up further in September. Broad money has led nominal GDP by around six months at momentum turning points historically, suggesting that two-quarter nominal GDP expansion will bottom by year-end – see chart 1.

Chart 1

20241018_NSP_MMM_C1_ChinaNominalGDPMoneySocialFinancing

Narrative about the insufficiency of the latest initiatives may underestimate policy stimulus already in the pipeline. Government net securities issuance reached CNY10.8 trillion or 8.3% of GDP in the 12 months to September, the highest proportion since 2017 and up by 2.6 pp from the prior 12 months. A further increase is likely. The banking system buys the bulk of securities so increased issuance usually boosts broad money growth (unless funds are used to repay other bank lending or increase system capital) – chart 2*.

Chart 2

20241018_NSP_MMM_C2_ChinaNetIssuanceofGovernmentSecuritiesBankingSystemNetLendingtoGovernment

Stimulus packages in 2008-09 and 2015-16 succeeded in reflating nominal GDP growth; smaller-scale initiatives in 2012-13 and 2019-20 resulted in stabilisation but little increase – chart 3. The extent of a recovery in money growth will signal which scenario is more likely. Markets appear to be discounting the latter: the yield curve (10s-2s) has steepened but less than in 2009 and 2015, while the rally in MSCI China still leaves it on a significant forward P / E discount to the rest of EM – chart 4.

Chart 3

20241018_NSP_MMM_C3_ChinaNominalGDPStimulusEpisodes

Chart 4

20241018_NSP_MMM_C4_ChinaEMexChinaForwardPEs

*Increased issuance is reflected initially in a rise in fiscal deposits, excluded from monetary aggregates. The monetary impact occurs when funds are deployed. A rise in fiscal deposits reduced the contribution of banking system net lending to government to annual M2 growth by 0.3 pp in September.

GACM_COMM_2024-10-17_Banner

Recently, we have witnessed one city after another come closer to Day Zero with alarming regularity. Day Zero is the critical point at which a city’s water supply goes completely dry. Earlier this year it was Mexico City and Bogota. In 2018, it was Cape Town, and in 2015, wells in central California went dry. Water scarcity does not distinguish between rich or poor countries. With population growth and climate change further straining water resources, expect to see more Day Zero headlines in the near future.

Sadly, until the taps run dry, water scarcity is not at the top of most people’s minds. Most people take a running tap for granted. But it’s worth highlighting that 97% of Earth’s water is salty. That means only 3% of all water available on earth is fresh water, and 2% is locked up in permafrost. That leaves a measly 1% to go around for all of humanity. As seen in the chart below, this precious resource is not distributed evenly. And its extraction around the world – as seen in the second chart – is clearly not correlated to availability.

GACM_COMM_2024-10-17_Chart01
Source – National Geographic, UNICEF
GACM_COMM_2024-10-17_Chart02
Source: Food and Agriculture Organization of the United Nations


Take the world’s most populous country – India. According to Central Water Commission of India, water availability in India has from 6,042 cubic metres per capita in 1947 (the year of Independence) to just 1,486 cubic metres per capita by the end of 2021. Water scarcity in most regions is the result of simple supply and demand dynamics. Supply of safe, usable water comes from surface water sources like lakes and rivers and from groundwater through aquifers. On the demand side, 70% of the demand comes from agriculture, 19% from industrial use and the remaining 11% from domestic needs like drinking and sanitation.

And demand is growing for several reasons. Besides population growth, water-intensive crops like cotton and sugarcane can be more profitable for farmers. A change in diet as populations grow more affluent means more consumption of water-hungry food items like nuts (walnuts, pistachios and almonds) and more consumption of meat. Creating a pound of beef requires more than 8,000 litres of water which is around eight times as much as vegetables and 20 times as much as wheat and corn.

While climate change is exacerbating water shortages, we ironically need more water (via lithium mining) to meet our climate change goals via electrification. According to the UN, the demand for fresh water is expected to outstrip supply by 40% by the end of this decade. As Mark Twain once famously said – “Whiskey is for drinking and water is for fighting.” Many countries depend on water supply originating from their neighbours. Managing and conserving water resources as a global common good might be the only way to avoid future conflicts.

A holding in our emerging market portfolio that is looking to address this issue is VA Tech Wabag (VATW IN). With a 100-year operating history, Wabag is one of the global leaders in water treatment solutions operating in India, the EU, the Middle East and Africa. Wabag works with both municipalities and industries on wastewater treatment and desalination projects. It has completed 1,450 plants around the world while developing its proprietary technology in this field with more than 125 patents and trademarks.

We like the company for its strong execution track record, technical expertise in delivering custom solutions and strong order book. We also like its discipline and selectiveness when it comes to bidding opportunities around the world. Three years ago, the company decided to deemphasize the “C” aspect of the EPC (Engineering, Procuring & Construction) model and generate more annuity revenues from operations and maintenance contracts. This shift to an asset-light model and focus on deleveraging should lead to strong value generation in the coming years.

GACM_COMM_2024-10-17_Banner

Chinese equities rallied 24% in USD terms through September, much of this in the final week of the month following the announcement of significant monetary and fiscal easing by the PBoC and Politburo respectively. Leading the move were the prime victims of China’s deflationary slump, including online securities broking company East Money (up 90%), property developer Vanke (82%), consumer laggards such as JD.com (57%) and Meituan (46%), along with names in banking, insurance and construction.

Our more cash generative and growing holdings surged, just not as much as the wider market. This included pan-Asian life insurer AIA Group (27%), energy drink beverage maker Eastroc (20%), Spring Airlines (24%), and tech giant Tencent (17%).

The majority of GEM investors, who have been significantly underweight Chinese equities for years, were caught out by the vertiginous rally fuelled by hopes the policy measures signalled a shift from the CCP towards domestic reflation.

GEM investors have maintained underweight positioning in China
NSP_COMM_2024-10-15_Chart01
Source: EPFR October 2024

We flagged in our Q2 commentary that despite the risks of institutional quality deteriorating under Xi Jinping, the market was incredibly cheap and positive earnings revisions were beginning to come through:

Instead of allowing a market clearing to resolve supply and demand imbalances in Chinese property, Beijing is attempting a “managed” deleveraging. The issue is that a long and drawn out unwind threatens to entrench deflationary forces that undermine efforts to rebalance the financial system. Further complicating this is that efforts to prevent capital outflows through currency management limit Beijing’s monetary policy flexibility. We wrote in Q1 that a CAPE of 10x for Chinese equities likely signals the build-up of risks that prompts a shift in policy priorities to prevent a bust. While the shift to reflationary policy may indeed be a positive catalyst for unloved Chinese equities, the timing is uncertain.

Hence, we decided to stick with a defensive equal weight exposure in China, on a view that a policy pivot could come at any time and spark a sharp rally.

Our chief economist Simon Ward flagged in Money Moves Markets a few days before the rally that monetary growth was potentially bottoming, and that a falling USD/strengthening yen was opening up space for Chinese policymakers to act:

A key reason for expecting money / credit reacceleration is that the yen rally has relieved pressure on the RMB, easing monetary conditions directly and opening up space for further PBoC policy action. The balance of payments turnaround is confirmed by a swing in the banking system’s net f/x transactions, including forwards, from sales of $58 billion in July to purchases of $10 billion in August. This series captures covert intervention via state banks (h/t Brad Setser) and an August reversal had been suggested by a sharp narrowing of the forward discount on the offshore RMB, which has remained lower so far in September.

A line graph showing China net f/x settlement by banks adjusted for forwards ($ bn) & forward premium/ Discount on offshore RMB (%).
Source: LSEG Datastream

The stage was set for the largest rally in Chinese equities since 2008.

The rally reflects the significance of the monetary and fiscal policy announcements, which signal a shift in the way Xi Jinping views the state of China’s economy and the approach needed to break the malaise. How far is he willing to go?

Structural policy shift the fuel for a rally

Our view is that to break deflation, and for this rally to be anything more than just a liquidity driven trading opportunity, monetary and fiscal measures must be truly forceful. This would represent a structural shift in policy, and even the abandonment of a managed exchange rate in order to free up more room to stimulate. We aren’t so sure how likely this is. Although a falling USD and Fed rate cuts will certainly make a shift easier.

The signals from Beijing are certainly positive and indicate that a new approach is being embraced. Notably, the government is preparing to inject liquidity into the commercial banking system to expand balance sheets and boost money growth. In addition, the Politburo has pledged to deploy the fiscal bazooka to support local governments, small businesses, property and families (and not infrastructure).

Perhaps what is most significant is that Xi himself acknowledged the severity of China’s deflationary spiral and has taken up responsibility for fixing it. Will consumers and entrepreneurs respond, or will the stimulus be more pushing on a string? If the response is weak, Xi may feel compelled to do more lest he look incompetent.

Overall, the relative attraction for Chinese equities has increased. The rally has been short and currently looks overbought. We expect pullbacks to provide opportunities to add to China exposure and become less defensive, while favouring A-shares which should pick up some of the running from here.

Monetary prospects and cycle considerations suggest global economic strength in H2 2025 / 2026 but a “hard landing” – or at least a scare of one – may be necessary first.

Commentary here at mid-year proposed the following baseline scenario:

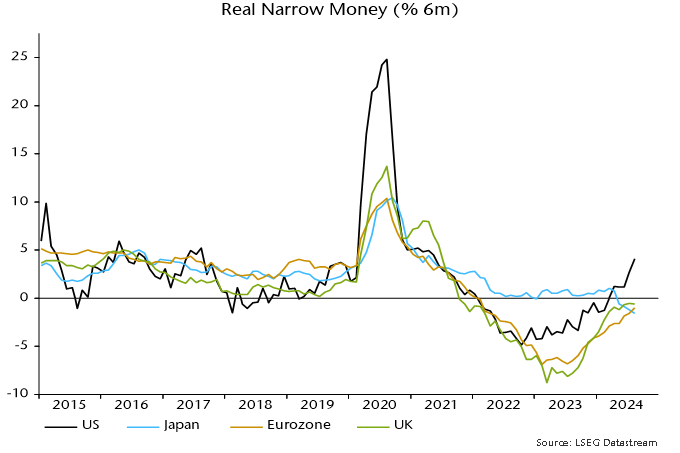
  • A “double dip” in global industrial momentum in H2 2024 with limited recovery in early 2025, reflecting the profile of real narrow money momentum with a roughly one-year lag.
  • Pass-through of industrial weakness to the services sector and – crucially – employment, the latter contrasting with experience during the first “dip” in 2022 when labour markets were in excess demand and unaffected.
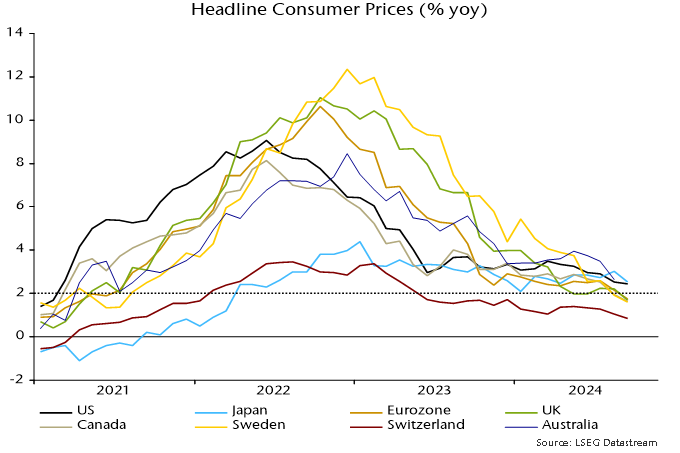
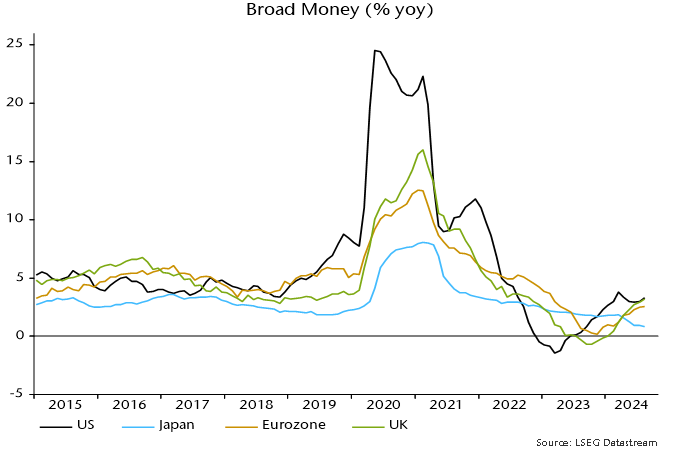
  • A further decline in consumer price inflation rates to below target in H1 2025, echoing a fall in broad money growth to very low levels in H1 2023, assuming a typical two-year lag.
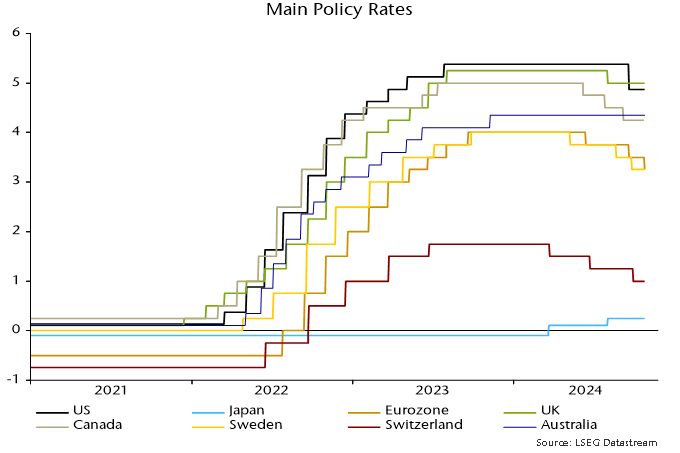
  • A rapid response of monetary policy-makers to downside labour market and inflation surprises, resulting in official rates falling by more by spring 2025 than markets expected in mid-2024.
  • A consequent strong pick-up in real narrow money momentum by spring 2025, laying the foundation for an economic boom starting in late 2025, consistent with the cyclical framework suggesting joint strength in the stockbuilding, business investment and housing cycles.

The near-term hard – or hard-ish – landing in this scenario is necessary to elicit policy easing sufficient to drive the later boom. Without it, the global economy could remain stuck in a slow-growth equilibrium into 2026, with policy rates kept above a neutral level despite low inflation.

Incoming news has been consistent with several elements of the baseline scenario but others require confirmation:

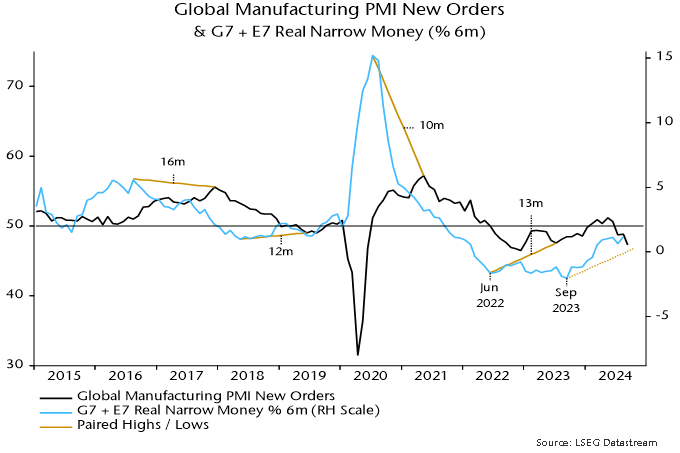
  • The global manufacturing PMI new orders index fell to a 21-month low in September. Global six-month real narrow money momentum bottomed in September 2023, signalling a likely PMI trough by end-2024 – see chart 1.

Chart 1

20241011_NSP_MMM_C1_GlobalManufacturingPMINewOrdersG7E7RealNarrowMoney

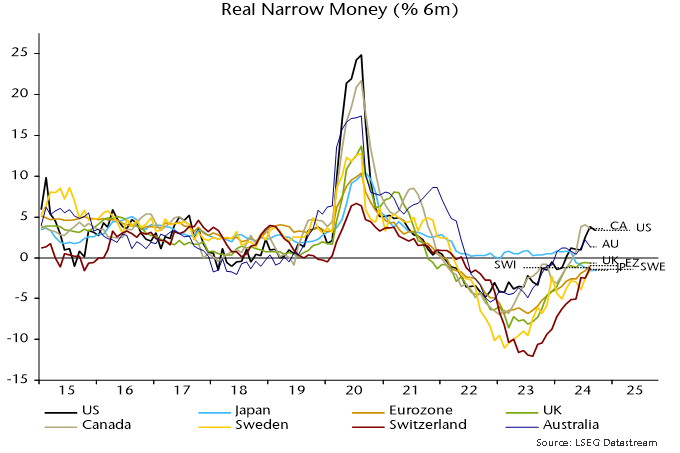
  • Real narrow money momentum has been moving sideways since the spring at a low level by historical standards, consistent with industrial momentum remaining weak in early 2025.
  • Manufacturing weakness appears to be transferring to services. The global services PMI new business index remained at an expansion-consistent level in September but output expectations fell sharply to a 23-month low – chart 2.

Chart 2

20241011_NSP_MMM_C2_GlobalServicesPMINewBusinessFutureOutput

  • Employment weakness has yet to crystallise. The global composite PMI employment index is below a low reached during the first dip in 2022 but not yet in contraction territory (50.0 in September). The US economy has continued to add jobs, although payrolls numbers are probably still overstating growth and average weekly hours have fallen.
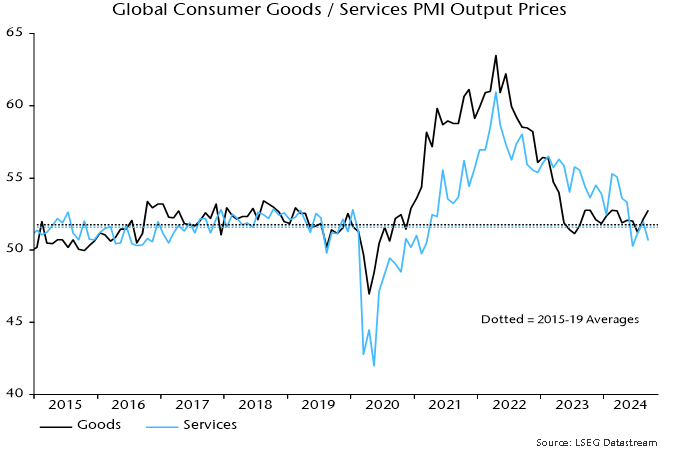
  • Inflation news has been favourable. Six-month headline / core consumer price momentum in the US and Eurozone has moved lower since mid-2024, while global PMI output price indices for consumer goods and services have stabilised close to their 2015-19 averages, when G7 annual core CPI inflation averaged 1.6% – chart 3.

Chart 3

20241011_NSP_MMM_C3_GlobalConsumerGoodsServicesPMIOutputPrices

  • Monetary authorities have in most cases shifted dovishly since mid-year. A major Chinese policy pivot at quarter-end could lead to a strong rebound in narrow money growth, supporting the expectation of global acceleration.

To summarise, the baseline scenario is still on track but requires confirmation from early further deterioration in labour market news as well as continued inflation progress.

The stabilisation of global six-month real narrow money momentum at a weak level conceals significant geographical dispersion. A strong pick-up in the US has been offset by falls in China and Japan, while a slow recovery in the Eurozone has caught up with a stalling UK – chart 4.

Chart 4

20241011_NSP_MMM_C4_RealNarrowMoney

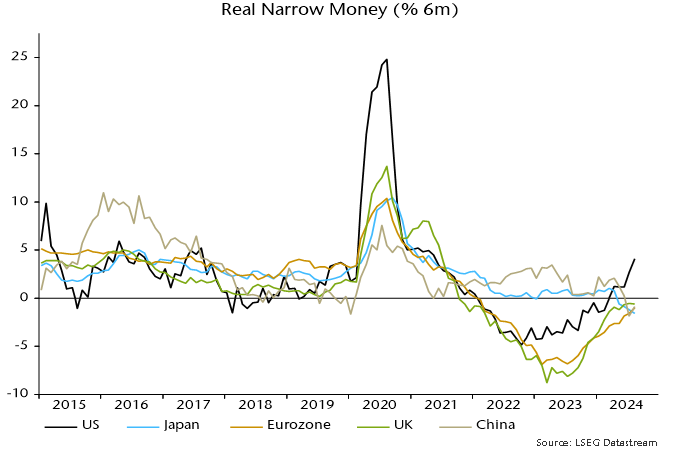
The rise in US momentum is puzzling and challenges the expected scenario of economic weakness and labour market deterioration into H1 2025. A near-term stall or reversal would reduce this tension and is plausible, with large monthly rises in March / April about to drop out of the six-month comparison.

Momentum remains negative across Europe but – except in the UK – has continued to recover, with a further acceleration expected as a pattern of rate cuts at successive policy meetings is established. UK-Eurozone monetary convergence is at odds with market themes of UK relative economic resilience and inflation stickiness, and incoming data could force the MPC to shift dovishly soon.

Interpretation of Chinese monetary trends has been clouded recent regulatory changes that have reduced the attractiveness of demand deposits, resulting in a switch into time deposits and money substitutes. The narrow money measure shown in chart 4 incorporates an adjustment but the “true” picture could be stronger or weaker. Previous large stimulus packages have fed rapidly through to monetary acceleration but – even if this occurs – economic momentum is likely to remain weak through Q2 2025, at least.

The cyclical framework used here judges current global economic weakness to reflect mid-cycle corrections in stockbuilding and business investment upswings, rather than new downswings in either cycle. The stockbuilding cycle (3-5 years) bottomed in Q1 2023 but an initial recovery due to an ending of destocking has fizzled as final demand has remained weak. The assumption is that policy easing will generate a second leg up in 2025, with a cycle peak possibly delayed until 2026.

The primary trend in the business investment cycle (7-11 years, last low 2020) is also still up, with the current correction probably attributable to a combination of restrictive interest rates, a profits slowdown and heightened uncertainty. Corporate financial balances (retained earnings minus capex) are in surplus in the US, Japan and Eurozone and a recovery in global economic momentum in 2025 could generate a strong “accelerator” effect on investment as animal spirits revive.

A key assumption is that the long-term housing cycle (average 18 years), which bottomed in 2009, will enjoy a final burst of strength in response to lower rates before peaking, possibly in 2026. One reason for believing that the upswing is incomplete is that peaks were historically associated with mortgage lending booms: annual growth of US residential mortgages reached double-digits before downswings into lows in 1957, 1975, 1991 and 2009. The high so far in the current cycle has been 9% (in 2022), with lower numbers in the Eurozone and UK.

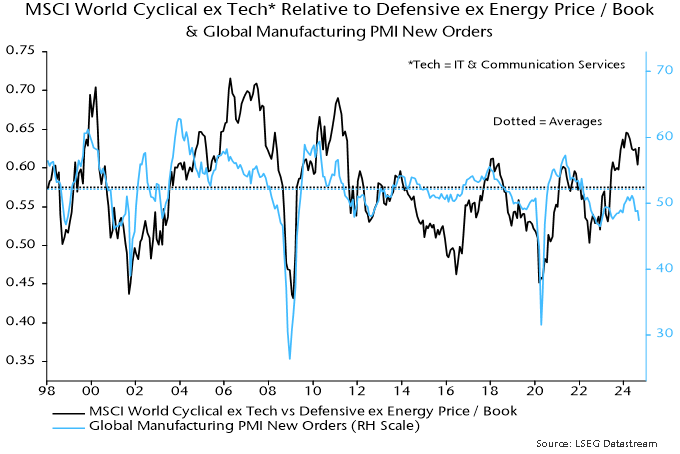
The mid-year commentary suggested that defensive equity market sectors would outperform as a H2 double dip unfolded. They did through early September but cyclical sectors rebounded on hopes of rapid Fed easing and large-scale Chinese stimulus. Even if forthcoming, the economic effects will be delayed and may already be discounted in relative valuations – chart 5.

Chart 5

20241011_NSP_MMM_C5_MSCIWorldCyclicalexTechRelativetoDefensiveexEnergyPrice

Markets have historically correlated with the stockbuilding cycle, so one approach to assessing investment potential is to compare returns so far in the current cycle with an average of prior upswings. As shown in table 1, US equities, cyclical sectors and gold have performed more strongly than the historical average in the 18 months since the cycle trough in Q1 2023, suggesting limited further upside and possible reversals, even assuming a late cycle peak.

Table 1

20241011_NSP_MMM_T1_StockbuildingCycleMarkets

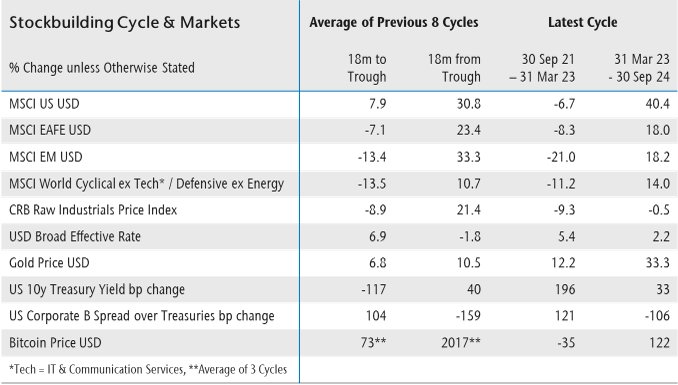
International equities – particularly emerging markets – have, by contrast, underperformed relative to history in the current cycle, while commodity prices have been unusually weak. Though also likely to suffer in any near-term hard landing scare, these areas have catch-up potential in the baseline scenario of global economic acceleration through 2025 driven partly by the stockbuilding cycle upswing entering a second phase.

A container ship passes beneath a suspension bridge as it departs for Europe.

Logistics have become as essential to our daily lives as electricity and water. Operating largely behind the scenes, the growing logistics sector ensures the seamless movement of goods and services across the globe. Just like utilities, we only notice it when things go wrong – be it delays, shortages, or supply chain disruptions – that remind us how indispensable logistics have become to everyone.

Many of us still recall the severe supply chain disruptions during the pandemic, which exposed the vulnerabilities of global logistics networks. While those acute challenges have eased, the industry continues to face headwinds. For example, recent geopolitical tensions in the Red Sea have blocked critical shipping routes, further complicating the already strained system.

Closer to home, the recent port worker strikes on the East and Gulf coasts over wages and automation have impacted roughly half of all containerized imports into the United States. Although a prolonged strike has been avoided with the tentative agreement, the ripple effects might soon be felt. Retailers began moving shipments earlier this year to prepare for potential port strikes, the effects of which can raise freight cost by up to 20% due to the extra warehousing needed to store the larger inventories. The rising cost, along with higher wages, may add pressure to inflation – an indicator the Federal Reserve is closely watching.

These events highlight how reliant businesses and consumers are on the smooth operations of logistics networks. In 2023, the industry was valued at $9.41 trillion, representing 9% of the global GDP. By 2028, it’s projected to grow to $14.08 trillion, at an annual growth rate of 8.4%. The Asia-Pacific region leads the logistics market, contributing $4.6 trillion, as trade routes expand and production shifts to the region. In fact, the container trade flow within Asia is larger than any trade lane globally.

A key segment of the logistics industry is third-party logistics (3PL), which offer a comprehensive suite of services, including warehousing, inventory management and automated shipping. The global 3PL market was valued at over $1 trillion in 2023.

One of our holdings in this space is Kerry Logistics Network (636 HK). The company is an Asia-based 3PL leader with an extensive global portfolio. With its strong presence in Asia, Kerry Logistics supports multinational corporations by providing value added solutions, including integrated logistics, international freight forwarding, e-commerce, industrial and infrastructure project logistics. The company demonstrated resilience during the pandemic, with proven capabilities to move shipments efficiently despite global supply chain disruptions.

Another one of our holdings is  ID Logistics Group (IDL FP), a leader in contract logistics, with over 8% market share in France and a growing presence in Europe and the rest of the world. Contract logistics, a specialized service offered by 3PL providers to manage supply chain operations on behalf of clients, generates high levels of recurring revenue under multi-year contracts. The segment was worth $426 billion in 2023 and is expected to grow at over 7% annually by 2032. Given the recurring nature, the business is not very sensitive to recessions and freight cycles. ID Logistics has been constantly gaining market share in Europe and has entered the US through an acquisition, which opens new growth opportunities for the company.

One of the key issues during the recent port strike was the opposition to automation. However, persistent labour shortages, rising operational costs and the growing complexity of global supply chains are pushing CEOs to adopt automation to boost productivity and reduce human error. The global logistics automation market was valued at $34.6 billion in 2023 and is expected to grow at CAGR of 15% from 2024 to 2030. GXO Logistics (GXO US), a holding, which focuses on contract logistics and provides integrated automation solutions to its blue-chip customer base, which includes about 30% of Fortune 100 companies. Its large-scale automation solutions can lead to 50% reduction invariable costs, 60% reduction in inventory wastage, and 50% improvement in inventory efficiency.

As the logistics industry continues to evolve and expand, it creates many opportunities for innovation and growth. It will remain a key area of focus for our investment strategy.

GACM_COMM_2024-10-03_Banner

« Climate change is the biggest opportunity of our generation. » This is one the key messages that resonated throughout some of the panels, conferences and workshops at Climate Week NYC. Our participation underscored the inevitability of the energy transition. Beyond advocacy, the event offered actionable insights that enhanced our expertise, helped identify investment opportunities and sharpened our understanding of the challenges we face as investors in a rapidly evolving landscape.

Below are 5 key takeaways from Climate Week NYC.

  1. Energy transition is no longer an option – It’s reality
    Global ambitions aligned with the Paris Agreement, aiming to limit warming to 2°C, are becoming increasingly tangible. The momentum from stakeholders, clients and regulatory bodies is driving industries toward cleaner, more sustainable practices. For investors, recognizing this trend is crucial as it opens new avenues for growth and opportunities in transforming sectors. Furthermore, with 2024 being a pivotal election year across many regions, understanding how political shifts will influence climate policies equips us to adapt our strategies proactively.
  2. The regulatory landscape is a game changer
    One of the most significant insights was the increasing impact of climate-related regulations and policies. The Inflation Reduction Act (IRA) has emerged as a pivotal policy, promoting both the energy transition and economic growth. With incentives for renewable energy projects, efficiency upgrades and sustainability initiatives, sectors such as renewable energy, energy storage and green infrastructure present attractive investment opportunities. Understanding these policies enables us to capitalize on emerging trends while mitigating risks.
  3. Technology as a catalyst for change
    Advancements in renewable energy, energy storage and efficiency are accelerating the energy transition. Innovations in areas like geothermal energy, large-scale battery storage and AI-driven energy management are reshaping the competitive landscape across multiple sectors. These technologies enable greater energy resilience, support the integration of renewable sources and drive efficiency improvements. Staying attuned to these technological shifts helps us to identify emerging opportunities and understand how they contribute to a more sustainable and adaptable investment landscape.
  4. Sustainable practices enhance competitiveness
    Sustainable practices are increasingly recognized as a hallmark of sound management and operational excellence. Integrating sustainability into business strategies is seen by many as an indicator of strong leadership, efficient resource management and long-term vision. This alignment not only helps companies reduce risks and adapt to evolving regulations but also enhances their competitiveness by fostering innovation and resilience. By embedding sustainability into their core operations, businesses position themselves for success, signaling to investors that they are well-prepared to navigate future challenges while driving value and growth.
  5. Engagement is key to understanding and investing in resilience
    Engaging with companies on their sustainability practices is an effective way to gauge the quality of their management and approach to risk mitigation. Through active dialogue, we gain deeper insights into how businesses manage climate risks, adapt to changing regulations and integrate sustainability into their operations. This engagement not only helps us assess a company’s long-term resilience and adaptability but also ensures that we identify organizations committed to effective management and strategic thinking. By understanding how they address sustainability challenges, we can better align our investments with businesses that are proactive, forward-thinking and poised for sustained success.

Why this matters to our clients

The insights gained from Climate Week reaffirm our commitment to identifying and investing in companies that are not just resilient but capable of thriving amidst changing global regulatory landscapes and climate transition. By staying informed, engaged and proactive, we continue to position ourselves as investors ready to navigate the complexities of a rapidly changing world.

Monetary trends suggest that UK economic performance will converge down to a weak Eurozone.

post in June argued that Eurozone monetary trends were too weak to support a sustained recovery. The composite PMI output index peaked in May and fell below 50 in September (flash reading of 48.9), confirming an ongoing “double dip”.

The UK economy has outperformed year-to-date: GDP grew by 1.2% between Q4 and Q2 versus a 0.5% rise in the Eurozone, while the composite PMI has moved sideways above 50 (September flash reading of 52.9).

This outperformance, however, follows relative weakness in H2 2023, when GDP contracted in the UK but eked out a small gain in the Eurozone. Q2 year-on-year GDP growth rates are similar, at 0.7% and 0.6% respectively.

This pattern – of UK underperformance in H2 2023 followed by a catch-up in 2024 – had been signalled by monetary trends. Six-month real narrow money momentum was weaker in the UK than the Eurozone in 2022 through Q2 2023 but UK momentum recovered faster last year and had opened up a lead by Q1 2024 – see chart 1.

Chart 1

20241002_NSP_MMM_C1_RealNarrowMoney

The lead, however, has been narrowing since April and almost closed in August, partly reflecting a recent stalling of the UK recovery. With momentum still negative, the suggestion is that UK and Eurozone economic performance will be similarly weak through early 2025.

As well as supposed UK relative economic strength, the expectation that rates will be slower to fall in the UK than the Eurozone incorporates a belief that inflation will prove stickier. This is also at odds with monetary trends.

Inflation rates are tracking the profile of broad money momentum two years earlier, in line with a simplistic monetarist prediction. Annual broad money growth was lower in the UK than the Eurozone in 2022 and 2023, suggesting that an undershoot of UK annual CPI inflation versus the Eurozone over May-July will resume in 2025 – chart 2.

Chart 2

20241002_NSP_MMM_C2_BroadMoney

A UK double dip would be blamed partly on the confidence-sapping impact of the new government’s gloomy fiscal pronouncements. The MPC’s failure to deliver timely easing would carry much greater responsibility.

GACM_COMM_2024-09-26_Banner

The Germans’ reputation for their persistent pessimismus (pessimism in German) is not anything new. Going back as far as the 19th century when the pessimismusstreit (pessimism controversy) was all the rage among German philosophers such as Taubert and Nietzsche. There is a case to be made however that Germany’s woes in the last couple years, especially since the invasion of Ukraine in 2022, are deserving of such emotions. From being dubbed the sick man of Europe in the 90s after the reunification, to being its industrials crown jewel just 15 years ago (even outpacing US growth at various points), it is now again the poster child of the variety of issues that are causing Europe to lag behind its global peers.

Let’s go through the list:

  • Internal politics:
    While France often takes the spotlight for its chaotic politics in Europe, Germany have its own brand of messy fiscally conservative politics. Well-renowned for their high aversion to fiscal deficit, Germany’s government amended its constitution in 2009 to include a debt brake (Schuldenbremse) which limits annual structural deficit to 0.35% of GDP. Although that rule was suspended during COVID and the Russian invasion of Ukraine, it is now back in place and spending cuts must be agreed on to get back to target. Consequently, Germans have been falling behind in allocating funds to meet climate transition targets along with making many necessary investments in infrastructure and new, growth- focused sectors. Furthermore the low government approval rating and weak economic environment has led to a resurgence of the far-right party “Alternative For Germany”. The far-right party won its first parliamentary seat in the most recent regional elections, the first time a far-right party is represented in parliament since WWII. EU elections earlier this Spring also saw a far-right resurgence from German voters, as dissatisfaction with the political and economic environment becomes more pronounced. We find it unlikely that the current divided politics will lead to any meaningful breakthrough in spending in the short term.
  • Dependence on the Chinese economy:
    Of all large Western economies, Germany remains the most exposed to China. Between 2011 and 2022, growth in German exports toward China grew at a CAGR of over 4%, peaking at €107 billion and representing more than 3% of 2022 GDP. This collapsed in 2023 with the Chinese economy reopening after COVID lockdowns, as its consumers spending deteriorated meaningfully. As such, 2023 exports to China were down just short of €10 billion to €97 billion and unlikely to reach new highs anytime soon. Furthermore, the largest export to China, German-made cars, is under considerable threat from Chinese carmakers that are far ahead on EV development and selling at large discounts to European cars, implying large market share losses from German carmakers. When we factor in supply chains moving out of China and reshoring, we do not expect that China exports will contribute to Germany’s growth anytime soon.
  • Energy costs:
    Germany uses twice as much energy in its industrial sector as the next-biggest country in Europe. It was one of the primary beneficiaries of cheap Russian gas exports before the Ukraine invasion that increased natural gas prices tenfold in 2022, before settling back down to more reasonable levels. Nonetheless the more energy-intensive nature of German industrials and chemicals now makes German producers uncompetitive on the global stage thanks to a higher-cost structure. There also does not seem to be a strong willingness to change its mind on turning away from nuclear energy, with insufficient investment in the energy grid. Firms like BASF and ThyssenKrupp have gone through significant restructuring of their German operations in the last 2 years, with a focus on relocating some plants to lower cost areas.
  • Cautious consumers:
    A 6% unemployment rate has been gradually increasing but remains in line with the average of the last 20 years in Germany. Income is rising faster than prices and rates are coming down. So why the pessimism? Germany was one of the few economies contracting in Europe in 2023, and 2024 has not inspired much optimism so far with many pundits projecting stagnation or another slight downturn in the country. Further negative messaging on adverse demographics and underexposure to secular growth themes for the next decade (climate transition, AI, service economy, etc.) have led investor sentiment to reach new lows.

An important question mark remains around how much of this is weakness is structural and how much can be addressed in the shorter term. Consumer sentiment can shift quickly and the balance sheet of German consumers remain solid. However, no level of internal demand growth will compensate for the weakness from China, which is not expected to improvement anytime soon. There are also questions around whether that demand will be redirected toward Chinese companies as reshoring becomes an ever increasingly important geopolitical topic. When Germany was last facing such structural issues in the 90s, it showed a willingness to cut through red tape and embark on painful but necessary reforms, leading to over a decade of outperformance. We have yet to see signs from current leaders that they are willing to repeat this process.

Despite the all the gloominess, we still see pockets of opportunity within German small caps, although we remain highly selective. The downward trajectory of rates, undemanding relative valuation to large caps and declining energy costs are all positives for small caps which represent 14% of its overall equity market. We continue to prefer names with globally diversified exposure and/or a secular theme that will support growth over multiple years. Here are two examples:

Earlier this year we initiated a position in RENK Group AG, a global leader in mission-critical propulsion and drive technology components for the defense industry and a solid example of German industrial and engineering prowess. Founded in 1873, the company was spun off from a Volkswagen division and acquired by private equity. It is globally diversified as a primary provider to most NATO militaries, which are under more pressure to increase their spending to 2% of GDP. RENK is already present in 75% of tracked military vehicles (excluding China and Russia) and 33% of large surface vessels, with an average content per tracked vehicle around 15%, providing plenty of opportunities to increase its share of sales from higher-margin aftermarket content. Given the strong barriers to entry as a NATO supplier, its backlog extending to 2028 and its strong brand reputation, we find RENK to be one of the best quality names Germany has to offer.

We are also shareholders in Aurubis AG, the largest copper smelter and refiner in Europe, with a market share of over 40% in the region and a growing presence in the US. It sources copper and various other metals both from miners directly and from industrial and scrapyard waste. Copper as a commodity is set to see continued high growth in demand over the next decade given its uses across virtually all industrial segments and its central role in the renewable energy landscape. Copper can also be infinitely recycled, so being the first mover and having existing infrastructure provides a tremendous advantage to Aurubis. The materials sector – more specifically the mining industry – is often seen as a sustainability laggard, but Aurubis distinguishes itself nicely as a unique recycling play with multiple growth levers.

Most data points toward Germany facing continued headwinds. Nonetheless, we seek to retain exposure to the second-largest economy in Europe and we believe names such as RENK Group and Aurubis are the right fits for the job.

A pick-up in US narrow money momentum is a hopeful signal for 2025 but requires confirmation and does not preclude near-term economic deterioration.

The measure of narrow money tracked here (M1A, comprising currency in circulation and demand deposits) rose by 0.8% in August, pushing six-month annualised growth up to 10.5% – see chart 1.

Chart 1

20240926_NSP_MMM_C1_USBroadNarrowMoney

The broad M2+ measure (which adds large time deposits at commercial banks and institutional money funds to the official M2 aggregate) also rose solidly in August, by 0.5%, but six-month growth remains subdued and within the recent range, at 3.5% annualised.

Six-month expansion of official M1 is weaker, at 2.1%. M1 is no longer a narrow money measure, following its redefinition in 2020 to include savings accounts.

Narrow money outperforms broad as a leading indicator of economic direction. The recent pick-up suggests that demand and activity will be gaining momentum by mid-2025. It does not, however, preclude – and may be consistent with – current economic deterioration.

Six-month narrow money momentum similarly recovered from negative to 10% annualised in September 2001 and September 2008. In both cases, the economy was within a recession that the NBER had yet to recognise.

Those narrow money rebounds may have partly reflected a rise in liquidity preference associated with an increase in saving, i.e. they may have been a signal of a reduction in current demand. They also, however, implied potential for future economic reacceleration when liquidity preference normalised and money balances were redeployed.

The 2001 / 2008 experiences were atypical: in earlier recessions, six-month narrow money growth rose strongly only at the end of – or after – the period of economic contraction.

A reasonable assessment, therefore, is that a pick-up in narrow money momentum is a neutral or negative signal for current economic momentum but positive for prospects six to 12 months ahead.

The current positive message is tempered by several considerations.

First, six-month momentum is likely to fall back in September / October because of negative base effects: narrow money rose by a whopping 3.1% (20.0% annualised) in March / April combined.

Secondly, the currency and demand deposit components of narrow money have been individually correlated with future activity historically but the recent pick-up has been solely due to the latter, with currency momentum unusually weak – chart 1.

Thirdly, the Fed funds target rate had been cut by 350 bp and 325 bp respectively by the time six-month narrow money momentum reached 10% annualised in 2001 and 2008. The Fed’s tardiness has increased the risk of a monetary relapse.