Image aérienne des éoliennes du projet éolien de Bornish en Ontario, Canada.

Toronto (Ontario), le 29 septembre 2025 – Connor, Clark & Lunn Infrastructure (CC&L Infrastructure) est heureuse d’annoncer l’acquisition d’une participation de 49 % dans un portefeuille de trois projets éoliens en exploitation en Ontario, totalisant environ 235 mégawatts (MW) de la capacité brute de NextEra Energy Resources, LLC (Energy Resources). Grâce à cet investissement, le portefeuille d’énergie renouvelable de CC&L Infrastructure représente maintenant près de 2,4 gigawatts (GW) de capacité brute, y compris plus de 1,2 GW de capacité éolienne sur 10 actifs distincts diversifiés selon le marché, la contrepartie, la juridiction et le régime éolien.

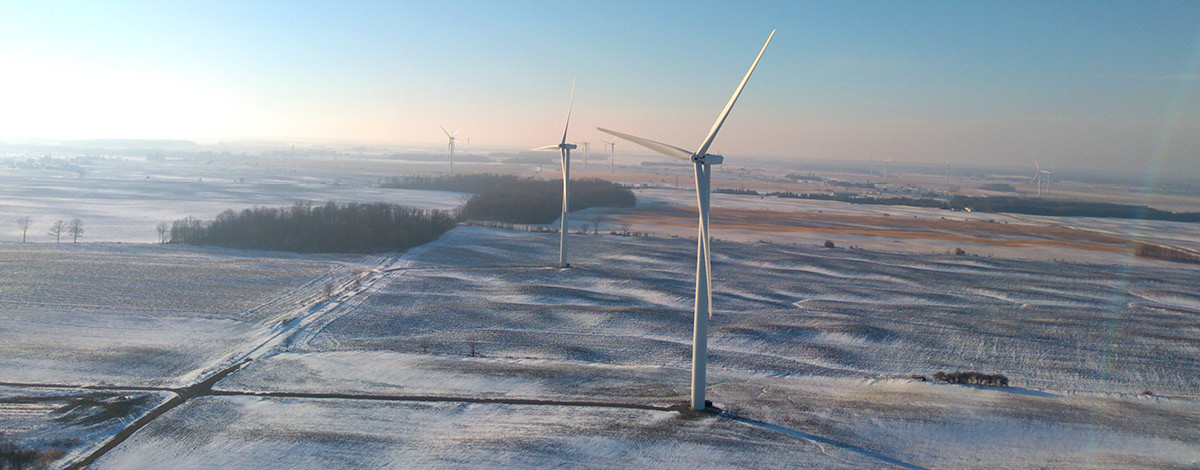
Adelaide Wind, Bornish Wind et Goshen Wind (les projets) sont situés dans le sud de l’Ontario et ont une capacité brute d’environ 60 MW, 73 MW et 102 MW respectivement, produisant ensemble une énergie équivalente à la consommation annuelle de plus de 200 000 ménages ontariens. Toute l’énergie générée par les projets est vendue en vertu de conventions d’achat d’électricité (CAE) d’une durée de 20 ans à la Société indépendante d’exploitation du réseau d’électricité (SIERE) (cotée Aa3 par Moody’s). Energy Resources conservera une participation de 51 % dans les projets et continuera de gérer et d’exploiter les actifs à l’avenir.

« Cette acquisition fait progresser notre stratégie visant à bâtir un portefeuille d’actifs d’infrastructure résilient et à long terme, soutenu par des contreparties solides et des flux de trésorerie stables », a déclaré Matt O’Brien, président de CC&L Infrastructure. Ces projets renforcent notre présence sur le marché des énergies renouvelables de l’Ontario et démontrent notre engagement à investir de façon responsable dans des projets qui offrent des rendements ajustés au risque attrayants. »

Les projets apportent des contributions économiques importantes à long terme aux collectivités dans lesquelles ils sont menés grâce aux impôts fonciers et au financement direct. Les projets sont également à la base d’ententes sur les retombées locales avec plusieurs groupes autochtones locaux.

« Cette transaction reflète à la fois les solides données fondamentales que nous continuons de voir sur le marché canadien des énergies renouvelables et la capacité de notre équipe à réaliser des acquisitions complexes avec des partenaires de premier plan de l’industrie », a déclaré Eric Reidel, directeur général de CC&L Infrastructure. Nous sommes heureux d’avoir travaillé en collaboration avec Energy Resources pour conclure cette transaction, qui met en évidence notre approche axée sur les relations pour trouver des occasions qui ajoutent de la valeur à long terme à notre portefeuille. »

Marchés des capitaux CIBC a agi à titre de conseiller financier de CC&L Infrastructure pour la transaction et Torys LLP a agi à titre de conseiller juridique.

À propos de Connor, Clark & Lunn Infrastructure

CC&L Infrastructure investit dans des actifs d’infrastructure du marché intermédiaire présentant des caractéristiques de risque et de rendement attrayantes, une longue durée de vie et la possibilité de générer des flux de trésorerie stables. À ce jour, CC&L Infrastructure a accumulé environ 7 milliards de dollars d’actifs sous gestion diversifiés dans une variété de régions géographiques, de secteurs et de types d’actifs, avec plus de 100 installations sous-jacentes dans plus de 35 placements individuels. CC&L Infrastructure fait partie de Connor, Clark & Lunn Financial Group Ltd., une société de gestion d’actifs multiboutique dont les sociétés affiliées gèrent collectivement des actifs d’une valeur approximative de 154 milliards de dollars.

Personne-ressource

Kaitlin Blainey
Directrice générale
Connor, Clark & Lunn Infrastructure
(416) 216-8047
[email protected]

Group bicycle ride at dawn.

If you want to go fast, go alone. If you want to go far, go together. – African proverb

At Global Alpha, we truly believe in having strong, connected teams because we’ve seen how it translates into better performance at work. When team members trust each other, we can push boundaries, test new ideas and endure more uncertainty. So, when we’re looking for team-building activities we look for unique activities that feel relevant, challenging and outside of the box.

This year we did a couple of truly extraordinary events that brought our team together in new ways – like a crash course in sailing with future Olympians! – but the real standout was our participation in the Grand défi Pierre Lavoie. It’s an epic annual four-day, 1000 km relay race that unites thousands of cyclists to promote healthy living and fundraise to support research into rare diseases.

No one person completes the défi alone, just as no one person can run a successful investment firm alone. It takes a cohesive group of skilled team members who can trust and count on each other, especially in volatile times – this challenge was not only a test of physical endurance and teamwork, but also a metaphor for the long-haul journeys that define our success as investment professionals.

Building strength through trust and teamwork

Picture the starting line of the Grand défi Pierre Lavoie: the sun rising, nerves jangling, teammates poised for the first pedal stroke of a 1,000 km adventure. It’s daunting. The finish feels distant, almost impossible. But there are steady wheels on all members of this team – the kind of company that makes every bitter wind lighter and every small victory sweeter.

When you’re part of a team, you’re working toward achieving a common goal, whether it be crossing a finish line 1,000 km away or producing positive returns at the end of a volatile year. As with any team, there are different strengths to be found in each of its members. For the Grand défi Pierre Lavoie, some riders were fast on the straightaways, some were strong up the hills, some were daring through the turns. In our investment team, there are curious researchers, strong risk managers, detailed analysts and more, each of whose skills differ from the others.

On the race path or in the office, the Global Alpha team leans into the grind together, trading stories, picking each other up, finding the opportunities in setbacks. Making these journeys together, especially when there are struggles, builds grit. Over time, the team learns how to support the other members and how to play to their strengths.

There are challenges – sore legs, broken chains, missed targets, sour news, a string of rough quarters or market turmoil, but because of the trust within the team, these are not seen as failures. Instead, the team regroups. An injection of humour gives that second wind that pulls the team through a headwind; one rider’s encouragement or a colleague’s fresh perspective is the spark that keeps everyone moving forward.

But in both environments, there’s an important lesson to be learned: real breakthroughs come after being stretched to the limit.

Going the distance together

During a tough market or a rough patch in life, it can be easy to doubt the journey. During the Grand défi Pierre Lavoie, there are long, quiet stretches where progress feels invisible. Despite pedaling hard, the scenery barely changes. In investing, some days are just as sluggish – despite strong investment principles and proven strategies, the returns can still seem lacklustre.

But these stretched-out moments are where the magic actually happens.

Short-term lulls aren’t proof that nothing’s working – they’re part of playing the long game. It’s easy to chase quick wins or get spooked by setbacks. But by trusting the process, working as a team and continuing to move – one kilometre, one quarter, one decision at a time – perseverance and endurance will deliver quiet rewards and lasting success that go well beyond numbers or market cycles.

Endurance is at the heart of long-term investing because the real rewards come to those who stay disciplined through every market storm and quiet patch. Team endurance wins in investing by combining diverse strengths, steady encouragement and a shared commitment – making it possible to persist, adapt and thrive when others might falter or give up.

Here’s the heart of it: the real win isn’t found at the finish line, but in the journey itself.

  • Riding together, sailing together, investing together – it’s never just about the numbers.
  • It’s the camaraderie, shared resilience and group celebration after the slog, when you see how far you’ve come, thanks to each other.
  • Teams carry everyone through the silent, invisible stretches when progress is slow and doubt is loud.

It’s not about quick wins or epic heroics. It’s about the discipline to show up, the courage to trust the team and the humility to lean on each other for a reset. After every breakdown – on the bike, on the water, in a tough portfolio review – the team draws closer. What once felt like a failure becomes a shared memory, a lesson, a source of strength.

Final thoughts and what we’re doing next

Global Alpha Capital Management stands out because the same teamwork, grit and appetite for challenge that drive us in events like the Grand défi Pierre Lavoie also fuel our investment success. Our edge lies in superior stock picking, shaped by deep, bottom-up research and a thematic, fundamental approach to finding quality companies with real growth potential.

We’re equally relentless in risk management, applying robust analytical frameworks to ensure every investment is weighed wisely no matter how uncertain the market gets. Just as our team perseveres together through endurance events – adapting, supporting and trusting the collective process – we do the same for our clients, aiming for long-lasting performance in turbulent times.

What’s up next for Global Alpha team members? A 30 km trail run on Mont Tremblant – another chance for us take on an uphill challenge and cross a finish line, together.

The UK primary fiscal balance is in sizeable deficit, while the effective interest rate on debt is above a trend level of nominal GDP growth consistent with the 2% inflation target. These conditions, if sustained, imply an explosive path for the debt to GDP ratio.

Central government interest payments in the 12 months to August were equivalent to 3.4% of the gross debt stock, according to the latest public finances release.

The Bank of England’s Asset Purchase Facility (APF), however, still owned about a fifth of the debt at the end of the period, so received a significant portion of these payments.

The Bank bought its gilts at much higher prices, so is earning an average interest rate of only 2.0% on the purchase cost of its holdings.

It financed its purchases by creating bank reserves on which it pays Bank rate, currently 4.0%.

Accounting for this carry cost of QE, which the Treasury is obliged to cover, the effective interest rate on government debt over the last 12 months was 4.0%.

This is unexceptional by historical standards but well above an average of 2.7% over 2010-19, when QE was delivering an interest gain – see chart 1.

Chart 1

250925c1

Achievement of the 2% inflation target over the medium term implies nominal GDP growth of no more than about 3.5% pa, assuming trend economic expansion of about 1.5% pa. An effective interest rate above this level requires the government to run a primary surplus to avoid a trend rise in debt to GDP.

The OBR projected a significant decline in the primary deficit in 2025-26 but the 12-month rolling gap has continued to widen – chart 2. A worse starting position, policy retreats and expected changes to the OBR’s economic assumptions cast strong doubt on the previous forecast of a medium-term return to surplus.

Chart 2

250925c2

The effective interest rate is subject to conflicting influences and may remain above trend nominal GDP growth. Cuts in Bank rate and QT are reducing the APF net interest loss. On the other hand, the current redemption yield on the stock of gilts, of 4.6%, is well above the interest yield of 3.4% on the stock of debt. Unless the yield curve shifts down, the interest yield will trend higher as existing gilts mature and are refinanced.

The Chancellor’s fiscal rules place emphasis on the current budget but the primary balance is key for stabilising the debt to GDP ratio. Budget measures need to deliver an early return to a primary surplus to calm fears of a fiscal doom loop.

A simple model of the Fed’s historical behaviour suggests that the window for rate cuts will close in early 2026 if the economy evolves in line with the median FOMC forecast.

The model classifies the Fed as being in tightening or easing mode depending on whether a probability estimate is above or below 0.5. The estimate is based on currently reported and lagged values of core PCE inflation, the unemployment rate and the ISM manufacturing delivery delays indicator. Despite the small number of inputs, the model does a satisfactory job of “explaining” the Fed’s past actions*.

The probability estimate rose above 0.5 in March, confirming that the Fed was no longer in easing mode. It moved back below that level in August / September ahead of last week’s rate cut – see chart 1.

Chart 1

240925c1i

The September reading of 0.44 would also have been consistent with a hold, suggesting that easing was partly precautionary and / or influenced by Trump administration pressure.

The median FOMC projections for 2026 have shifted hawkishly since June. Annual core PCE inflation is now 2.6% in Q4 2026 from 2.4% previously, while the unemployment rate declines from 4.5% to 4.4% between Q4 2025 and Q4 2026.

The model forecast shown in the chart is based on quarterly paths for core inflation and the jobless rate interpolated from the FOMC Q4 projections, along with an assumption that the ISM deliveries index stabilises at its August level.

The probability estimate edges back above 0.5 in October, returns to the easing zone over November-January but then embarks on a sustained rise above 0.5.

The shift into the tightening zone is unsurprising given the forecast of sustained above-target core inflation and a firming labour market.

The suggestion of a short window for further rate cuts is at odds with market expectations of an extended easing cycle. The market path presumably reflects a more dovish economic view but may also incorporate some probability of a change in the Fed’s reaction function under a new Chair.

*A previous post contained a chart showing a 60-year history.

Entrepôt de Legacy Supply Chain.

Toronto, ON – MidStar Capital Corp. a annoncé aujourd’hui avoir conclu une facilité de crédit à terme de premier rang en appui à Eos Management L.P. pour le refinancement de Legacy Supply Chain Holdings, Inc.

MidStar Capital a agi à titre d’arrangeur principal unique et d’agent administratif dans le cadre de cette transaction.

« Nous sommes heureux d’avoir négocié notre premier accord avec MidStar Capital. L’approche ordonnée de MidStar Capital et son engagement envers le partenariat a rendu le processus harmonieux et efficace. Nous serons ravis de travailler encore avec la société dans l’avenir », a déclaré Adam Gruber, président-directeur général, Eos Management.

« La stratégie de croissance de Legacy ne peut se faire sans partenaires stratégiques », a précisé Mike Glodziak, président et chef de la direction de Legacy Supply Chain. « Tout au long du processus, MidStar nous a prouvé qu’elle était la partenaire tout indiquée pour contribuer à notre croissance ».

À propos d’Eos Management L.P.

Fondée en 1994, Eos Management est une société de placement qui se démarque depuis des décennies dans le capital-investissement sur le marché intermédiaire. Eos Management s’associe avec des équipes de direction dans le but de développer et de renforcer leurs capacités, d’accélérer la croissance, tant à l’interne qu’au moyen d’acquisitions, et de transformer ces entreprises en chefs de file de plus grande envergure.

À propos de Legacy Supply Chain Holdings, Inc. 

Depuis plus de 40 ans, Legacy Supply Chain est un partenaire de choix pour les entreprises qui souhaitent avoir plus de contrôle sur leurs chaînes d’approvisionnement en constante évolution. Exploitant plus de 30 sites opérationnels aux États-Unis et au Canada, Legacy Supply Chain est un fournisseur de services logistiques tiers qui propose des solutions sur mesure d’entreposage et de distribution, d’exécution de commerce électronique et de transport. Ces solutions donnent plus de contrôle aux entreprises sur leurs chaînes d’approvisionnement omnicanales dynamiques, ce qui leur permet d’offrir une expérience client exceptionnelle.

À propos de MidStar Capital Corp.

MidStar Capital offre des solutions de financement structuré de prêts privés visant des emprunteurs dont le BAIIA est de 5 millions de dollars à 50 millions de dollars. Lancée en 2017, MidStar est une société de personnes détenue conjointement par l’équipe de MidStar Management et Groupe financier Connor, Clark & Lunn Ltée (Groupe financier CC&L).

MidStar Capital est une société affiliée de Groupe financier CC&L, une société de gestion d’actifs diversifiée et indépendante détenue par ses employés qui existe depuis plus de 40 ans. Gérant collectivement des actifs d’une valeur de plus de 154 milliards de dollars canadiens, Groupe financier CC&L et ses sociétés affiliées offrent une gamme diversifiée de produits et de solutions de placement à des clients institutionnels, à valeur nette élevée et individuels.

Pour toute question, communiquez avec :

MidStar Capital
Tanya Taggart
Cofondatrice 
416-862-6182
[email protected]

China Central Television Headquarters in Beijing, China.

The broad market in China now trades in line with the long-term average valuations. Which begs the question, is there any fuel left in this rally?

Chinese state-owned enterprises have driven market valuations to their long-term average

Line graph showing the MSCI China’s 12-month forward PE trend, with market valuations currently at their long-term average.

Note: MSCI weighted. Source: Jeffries, FactSet

Our kind of businesses remain cheap

Line graph showing the MSCI China private sector’s 12-month forward PE trend, with the private sector trading close to the -1 standard deviation level.

Note: MSCI weighted. Source: Jeffries, FactSet

MSCI China private sector is trading at just 14x, close to the -1 standard deviation level and c.15% below the long-term average.

Prior to the recent rally, investors had abandoned quality names despite improving profitability, cheap valuations, increasing buybacks and dividends. We are now seeing start to reverse.

China quality now ahead year to date following years of underperformance

Line graph comparing the growth, value and quality of MSCI China style indices over time, highlighting that quality is increasing after years of underperformance.

Source: NS Partners and LSEG

Improving returns are fuelling the rally

Line graph illustrating that the return on invested capital is rising for China large caps.

Source: Jeffries, FactSet. Note: Based on current MSCI ex-fin & REITs universe.

China’s electricity demand is scaling up rapidly, driven by AI, EVs, air conditioning and industrial upgrading. Renewables – especially solar and wind – are central to meeting this demand, with China uniquely positioned to scale capacity.

The rise of renewables necessitates a massive build-out of energy storage (30× increase by 2050) and grid infrastructure.

AI is a particularly powerful driver, with data centre electricity demand set to multiply several times over the next few decades. These trends are supported by robust investment and policy momentum, positioning China as the world’s largest “electrostate” by 2050.

Annual power capacity in major countries – China is on track to add over 500 GW of solar and wind capacity this year.

Bar graph illustrating the annual power capacity additions in Gigawatts in different countries for 2024 and estimates for 2025.

Source: Berstein and government data (2025)

With rising capacity and increasing penetration of renewables, a massive scale-up in energy storage capacity through batteries will be crucial to ensuring grid stability.

Company spotlight: Contemporary Amperex Technology (CATL) – the world’s largest battery maker

Contemporary Amperex Technology (CATL) is a vital player in providing energy storage to address power intermittency issues as China ramps up zero-carbon renewables. The company boasts a number of competitive strengths supporting sustainable earnings growth:

  • CATL’s efficient production lines and scale enable it to be a cost leader with the highest GPM (20%) vs. peers.
  • This advantage should be sustained as it continues to expand capacity and grow with its customers (Tesla, Chinese OEMs).
  • The company is technologically ahead of the market, and its scale allows it to invest much higher absolute dollar into R&D.

You can see this dynamic in the charts below, with increasing scale unlocking a sustainable R&D edge over the competition, while capex intensity falls and free cash flows improve.

Cash generation

Line graph of cash generation comparing the percentatges of sales of Operating Cash Flow, Free Cash Flow, Capital Expenditure, and Research and Development.

Source: NS Partners and Bloomberg

Working capital

Bar graph of working capital illustrating Days Sales Outstanding, Days Inventory Outstanding, Days Payable Outstanding, and Cash Conversion Cycle for the past years starting 2018.

Source: NS Partners and Bloomberg

Pricing power and constant technological innovation through scale is becoming a moat that looks increasingly insurmountable for competitors around the world.

In April this year, CATL announced that it was developing fast-charge technology which can deliver 520km range in five minutes.

Concept display of a car chassis with battery at a conference, demostrating concept of fast-charge technology in car batteries by CATL.

Source: Financial Times April 2025

This was followed in May by the unveiling of its Freevoy battery which boasts a 1500km range.

Presentation image of a CATL Freevoy Dual Power Battery.

Source: Contemporary Amperex Technology Presentation May 2025.

Fears over weak demand for EVs dragging on battery pricing and trade war concerns have hit the stock in recent years. This is a high-quality company trading at a very reasonable valuation, trading at trough 14.6x fwd P/E multiple.

Line graph illustrating CATL valuation.

Source: NS Partners and Bloomberg

CATL is just one example of the kinds of opportunities on offer in China. The exodus of foreign investors from the market has left bargains everywhere among well-run, growing companies with lots of cash, next to no debt, with many buying back shares or announcing aggressive dividend plans.

Our portfolio is full of high-quality compounders across sectors trading at very attractive valuations. While it has been the value names, SOEs, small caps and high dividend stocks that have led the first phase of the China bull market, we think that the real gems in this phase on offer for investors remain cheap and look poised to outperform.

Chureito Pagoda and Mount Fuji in Fujiyoshida, Japan, during autumn.

The Global Alpha team has just attended a pair of conferences in Japan. The BofA Japan Conference and the Mizuho Japan Alpha Conference. We attended numerous panel discussions on topics ranging from trade and tariffs to the changing geopolitical and defence world order to the AI boom. We met with over 40 Japanese companies including many of our holdings and completed a few onsite visits.

At the time of writing, Prime Minister Ishiba announced his resignation, less than a year after succeeding Kishida. His position was untenable after the humiliating defeat of his party in the spring. Political instability is not new in Japan, nor in most countries these days – something investors do not seem to have yet fully factored into risk premiums. And the rise of extremism, both right and left, is further colouring political landscapes globally.

Here are some takeaways from the conference:

  • Inflation in Japan continues to exceed 2% and the country is very unlikely to fall back in deflation. After over fifteen years of fighting to achieve sustained 2% inflation. It breached it in 2023–24, and 2025–26 will see inflation above that number. Dismissed is the risk of runaway inflation, which could happen and is one of the reasons for the defeat of the Liberal Democratic Party.
  • As a result of inflation rising, interest rates are going up. The Japan 30-year bond is at its highest since 1993 and now exceeds 3%. The Bank of Japan is expected to continue raising short-term interest rates. This has been an important positive for the financial sector. One of our largest holdings is Concordia Financial Group Inc.(7186 JP), a super regional bank in the Kanto region of Tokyo.
  • Japanese retail investors still only have about 2.5% of their savings invested in the Japanese stock market. Over 90% is in bank deposits which represents over USD6 trillion.
  • Spring wage negotiations in 2025 yielded a record wage increase of 5.1% after another record of 5% in 2024. The companies we met all indicated that 2026 will be equal or higher than 2025 as an acute shortage of workers is felt.
  • We met many real estate companies operating in office, retail, hospitality as well as residential. New leases are seeing price increases averaging 7 to 10%.
  • Most of the companies we met indicated that they need to raise prices and likely face little push back.
  • The pace of reforms being brought by the government, the Tokyo Stock Exchange and companies themselves is accelerating.
  • Overall, the sentiment was positive. Both conferences saw record attendance from foreign investors.

However, the inspiration for this week’s commentary came from a meeting with a Japanese forest product company called Oji Holdings. The company was established in 1873 and over the next one hundred years became a leader in the production of newsprint and printing paper.

We well know what happened to the Canadian and US forest industries. To respond to a secular decline in newsprint demand, they merged and eventually went bankrupt, with assets being closed or sold. No company can shrink to greatness.

Oji is not immune to the decline in newsprint and paper demand. However, in the seventies, it started migrating to tissue and packaging. And more recently, it accelerated its diversification, still using its expertise transforming wood to pulp, but using that pulp for sustainable packaging and to make biomass plastics from the green ethanol produced. The company is also using biomass to produce advanced semiconductor photoresist, eliminating all perfluorinated substances commonly used by current processes. Oji also established Oji Pharma in 2020 to develop and commercialize plant-based medicinal products such as Heparin, currently produced with animal proteins and banned in many Muslim countries. By 2030, these new divisions will have grown more than the decline in paper.

Including Oji, there are over 20,000 companies in Japan that are more than one hundred years old. Even more impressive, over 3,000 companies are more than two hundred years old and around six hundred are more than three hundred years old.

With regard to company longevity, over 50% of the companies in Japan are over one hundred years old. Europe follows with its number of century-old companies. The United States has less than 5%.

The oldest known, continuously operating company in the world is a Japanese construction firm specializing in Buddhist temples and shrines called Kongo Gumi. It was established in 578 AD and operated for over 1,400 years before becoming a subsidiary of a larger group in 2006.

Why are there so many century-old companies in Japan?

This incredible longevity is attributed to a combination of cultural, business and historical factors, but most important is the emphasis on continuity and legacy. This comes from fostering a long-term perspective and not necessarily maximizing short-term profit. Other factors contributing to longevity success are the focus on core competency, resilience and adaptation, as demonstrated by Oji.

It will be interesting to see how Japanese companies can continue to adopt this long-term focus yet at the same time respond to shorter-term shareholder objectives.

A measure of UK annual core CPI inflation excluding direct policy effects eased to 3.1% in August, 0.5 pp lower than a year earlier.

Published core inflation (i.e. excluding food, energy, alcohol and tobacco) of 3.6% was unchanged from August 2024. The wedge between the published and adjusted measures reflects the imposition of VAT on school fees, a bumper rise in water / sewerage changes and expensive changes to vehicle excise duty – see chart 1.

Chart 1

170925c1

The adjustment takes account only of direct policy effects, not indirect upward pressure from changes that have loaded additional costs on firms, including the national insurance raid and a double-inflation rise in the minimum wage. The February Monetary Policy Report suggested that the NI changes alone would push up annual core inflation by about 0.25 pp by now.

How should monetary policy respond to above-target inflation driven largely by government-determined prices / costs?

The monetarist recommendation, as always, is that policy-makers should aim for stable money growth at a rate consistent with trend economic growth and the inflation objective. Such an approach avoids accommodating cost-push pressures while minimising any loss of output.

The suggested range for UK broad money growth at present is 4-5% pa. Current annual growth, as measured by non-financial M4, is 3.7%. So the MPC should lower rates / slow QT despite policy-driven inflation.

The Chinese economy has slowed sharply but money trends are giving a modestly reassuring signal.

Six-month growth of industrial output and retail sales eased further in August, while fixed asset investment remained in deep contraction, following dramatic June / July weakness. Home sales also continued to slide – see chart 1.

Chart 1

160925c1

Investment weakness has recently spread from the property sector to state-controlled spending and manufacturing, reflecting anti-“involution” policies.

August money numbers, however, argue against embracing economic pessimism, at least for now. Six-month growth of narrow money – as measured by the new M1 definition incorporating household demand deposits – rose modestly for a third month, following a sharp drop in April / May. Broad money momentum has also edged up, with both series comfortably within their ranges in recent years – chart 2.

Chart 2

160925c2

Sectoral details, meanwhile, indicate that the earlier drop in narrow money growth reflected a fall in demand deposits of government-related bodies (excluding central government), consistent with recent weakness in state-controlled investment. Growth of an alternative “private sector” measure comprising holdings of households and non-financial enterprises remains close to its recent high – chart 3.

Chart 3

160925c3

The fall in demand deposits of government-related bodies, moreover, was balanced by a strong rise in central government (i.e. fiscal) deposits, suggesting yet-to-be-deployed firepower. Six-month growth of an expanded measure including such deposits has also remained solid.

The message of supportive monetary / financing conditions is reinforced by survey evidence – the corporate financing index from the Cheung Kong Graduate School of Business survey is above its long-run average – as well as recent yield curve steepening.

Despite the April / May slowdown, six-month narrow money momentum has remained above nominal economic growth, with the “excess” providing fuel for the rally in equities.

Creek Street in Ketchikan, Alaska.

According to Morningstar, global sustainable funds attracted an estimated net USD4.9 billion in Q2 2025. With 72 new sustainable funds launched in just one quarter, total assets in global sustainable strategies have now reached USD3.5 trillion.

Sustainable investing is booming – and getting harder to navigate.

Quarterly global sustainable fund assets (USD billion)
Graph comparing quarterly global sustainable fund assets in billions of USD between Europe, the United States and the rest of the world.
Source: Morningstar Direct. Data as of June 2025.

To differentiate themselves, funds increasingly segment by theme – from “climate leaders” and “net-zero transition” to “socially responsible” and “impact” strategies. The United Nations Sustainable Development Goals (UN SDGs) have become the most common reference point for defining what is “sustainable.” But as SDG labels become more common, investors face a critical challenge: How can you tell the difference between real contribution and clever branding?

The answer lies in applying core principles borrowed from the field of impact investing – even when the investment strategy itself isn’t “impact” by design. Three key concepts help sharpen the lens and assess sustainable outcomes in the real world:

  • Intentionality: Are the investee companies actively seeking to contribute to a positive social or environmental outcome through their core business or are the outcomes unintended?
  • Additionality: Would these outcomes have happened without the companies’ products or services? This helps determine the companies’ real contribution.
  • Measurability: Are there clear metrics to track and report how the outcomes affect the end beneficiary?

Take a firm that installs solar panels only to offset its own energy use – essentially fixing a problem of its own making. While this could be marketed as a “sustainable outcome” by many, this is risk management: no additionality, no broader SDG contribution and no real benefit beyond the company’s operations.

At the aggregate level, thinking like an impact investor can sharpen how equity investors assess credibility of sustainability claims. A useful tool is a theory of change – a framework that maps how a company’s core activities lead to specific outputs (e.g. products or services), which in turn generate measurable outcomes. Applying this lens helps investors move beyond marketing language to identify businesses whose growth is directly tied to delivering credible, positive, real-world outcomes alongside financial performance.

At Global Alpha, our Sustainable Global Small Cap Strategy applies these principles as a framework – not to make impact investments, but to ensure that the companies we invest in generate credible, positive contributions to the SDGs through the sale of their products and services. Our aim remains financial performance, which we do by delivering real-world, positive outcomes, as evidenced in our 2024 Sustainable Global Small Cap Annual Report.

Portfolio spotlight: The North West Company

The North West Company Inc. (NWC CN) is a leading retailer serving remote and underserved communities in Canada, Alaska, the Caribbean and the Pacific. In regions where reliable access to goods and services is limited, NWC delivers food, household essentials and health products – often as the sole provider.

NWC’s impact begins with its extensive distribution network, retail infrastructure and partnerships with governments and organizations focused on food security. Through 230 stores and over 7,000 employees – 44% of which are from Indigenous groups – it delivers affordable, high-quality goods, supports local employment and invests in community initiatives.

Its business model demonstrates:

  • Intentionality: NWC’s core strategy targets underserved and rural communities.
  • Additionality: In many locations, it operates where no comparable services exist.
  • Measurability: Metrics include the number of communities served and local employment created.

The below theory of change showcases how NWC’s activities aim to increase access to essential goods across 190 communities, reduce disparities in access to services and enhance economic self-sufficiency, directly contributing to SDG 11 – Sustainable Cities and Communities.

Example of the theory of change for NWC, illustrating the input, activities, outputs, outcomes and the UN SDG impacted.
Source: 2024 Sustainable Global Small Cap Annual Report

NWC exemplifies how small caps can deliver meaningful real-world outcomes in addition to financial returns – and why thoughtful sustainability analysis matters.