Crestpoint Real Estate Investments Ltd., one of Canada’s leading commercial real estate equity and debt managers, is pleased to announce the launch and initial funding of the Crestpoint Opportunistic Real Estate Strategy (the “Fund”), its first closed-end product.
The Fund, with a twelve-month capital raising period and an eight-year total term, aims to invest in a range of opportunistic Canadian real estate investments and has a gross annualized return target of 15% to 18%. Returns achieved, will be primarily through capital appreciation delivered through a combination of selective, strategic acquisitions and Crestpoint’s active, hands-on approach to asset management.
Coinciding with the launch and initial closing, Crestpoint is also pleased to announce that the Fund has completed its first investment, 1318 Thurlow Street, a 0.4 acre development site located on the southwest corner of the intersection of Thurlow and Burnaby streets in the popular West End neighbourhood of downtown Vancouver, B.C. When completed, this 32-storey, concrete, purpose-built multi-family rental building, comprised of 300 units including a mix of studio, 1-, 2- and 3-bedroom suites, with a range of indoor and outdoor amenity space, will offer tenants impressive views. With a Walk Score® of 96, the property is strategically located in a transit-oriented community in close proximity to restaurants, shopping, Sunset Beach, the downtown business district, hospitals and universities. Partnering with Anthem Properties Group Ltd., Crestpoint, on behalf of the Fund, has acquired a 77% interest in the property with Anthem Properties owning the remaining 23% interest.
“Since Crestpoint’s inception in 2010, some of our best investments have been in periods characterized by the market volatility and dislocation we see today,” said Kevin Leon, CEO of Crestpoint. “We believe it’s a compelling investment environment. We expect to use multiple strategies to create and capture value, including repositioning undermanaged assets, recapitalizing properties with weak balance sheets and renovating existing buildings to higher standards.”
The Fund, focusing on capital appreciation, is designed for institutional clients seeking access to a higher potential return portfolio than available in core real estate, providing them with additional choice and an opportunity for diversification. This strategy complements Crestpoint’s existing flagship, $5.3 billion open-end Core Plus Real Estate Strategy, which has been one of the top-performing core/core plus funds in Canada since its inception in 2011. In 2022, Crestpoint launched the Crestpoint Real Estate Debt Strategy, an open-ended mortgage fund that has outperformed its benchmark since inception.
Max Rosenfeld, EVP and Head of Asset Management at Crestpoint, added, “This new strategy leverages our management expertise and deep relationships within Canada’s real estate investment community, strengths that have enabled us to successfully complete over $3 billion in value-add and opportunistic investments over the last 13 years.”
Following the success of this initial capital raise, the Fund will hold subsequent closings to allow additional investors to participate, with the next close expected to be in Q4 2024.
Learn more about this exciting new offering in a video with Crestpoint’s CEO, where he highlights the details and opportunities ahead. Watch the video here.
About Crestpoint
Crestpoint Real Estate Investments Ltd. is a commercial real estate investment manager dedicated to providing investors with direct access to a diversified portfolio of commercial real estate equity and debt investments. With over $10 billion under management, Crestpoint is an affiliate of the Connor, Clark & Lunn Financial Group, one of Canada’s largest private, independently held multi-boutique asset management firms with offices throughout the country and in the US, the UK and India. CC&L Financial Group and its affiliates collectively manage over C$133 billion in assets across a broad range of traditional and alternative investment products and solutions for institutional, high-net-worth and retail clients. For more information, please visit crestpoint.com.
Contact
Elizabeth Steele
Director, Client Relations
Crestpoint Real Estate Investments Ltd.
(416) 304-8743
[email protected]


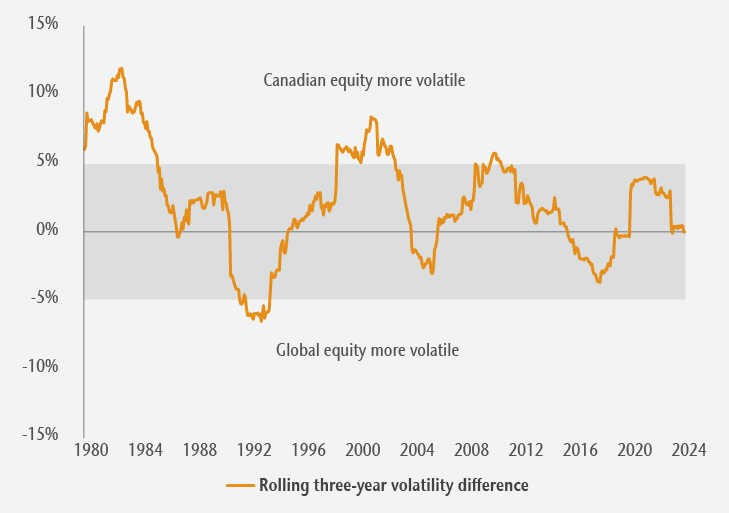
 Source: NS Partners.
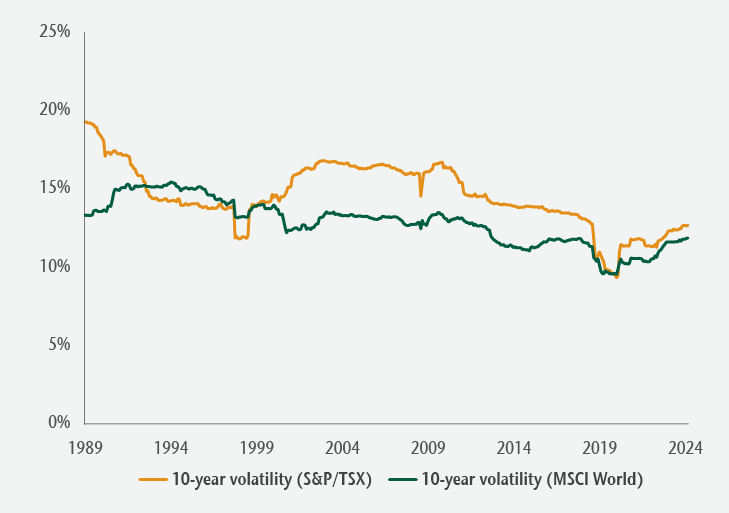
 Source: NS Partners.
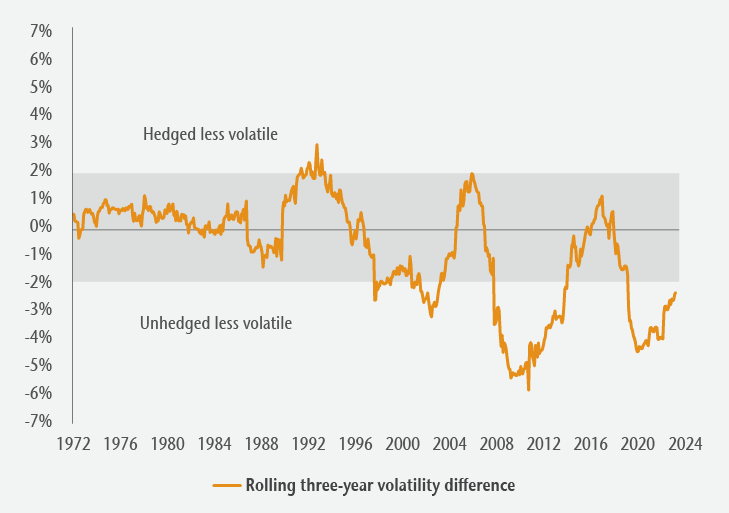
 Source: NS Partners.
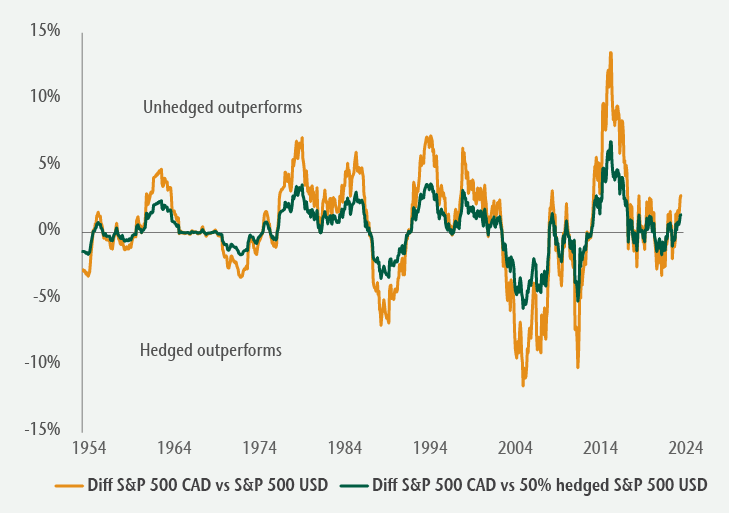
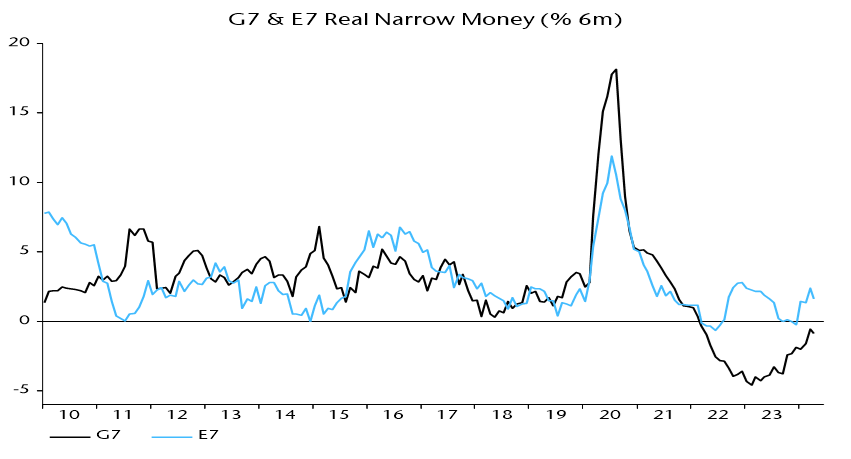 Source: NS Partners and LSEG Datastream.
 Source: NS Partners and LSEG Datastream.
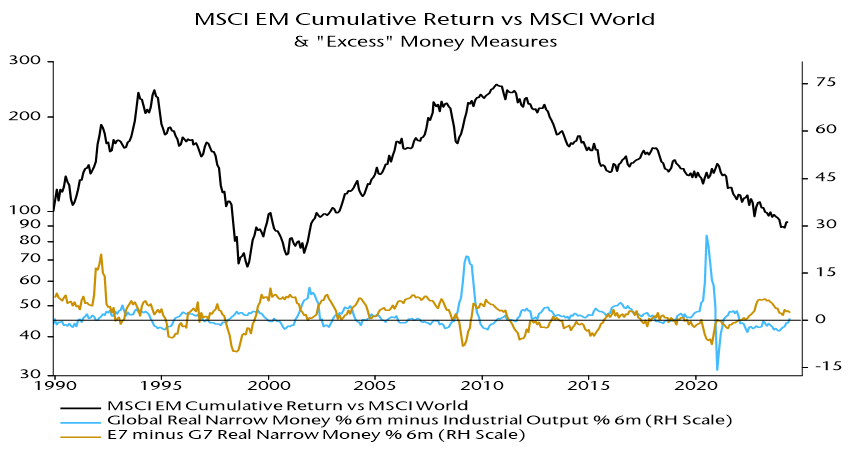 Source: NS Partners and LSEG Datastream.
 Source: NS Partners and LSEG Datastream.
 Source: NS Partners and LSEG Datastream.