The most important issue in the global economic outlook is the meaning of Chinese monetary weakness.
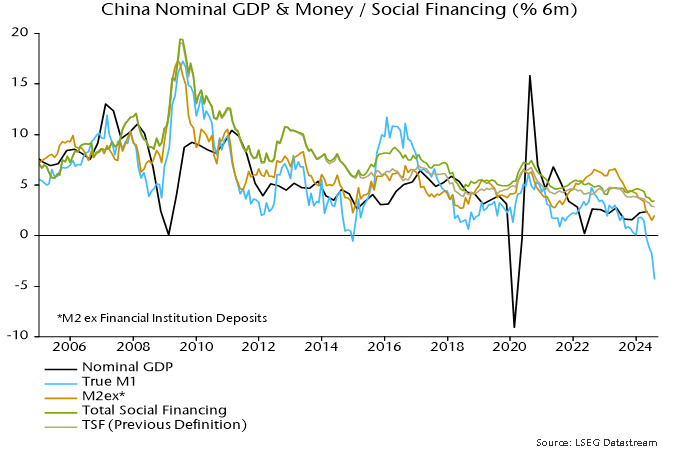
Six-month rates of change of narrow / broad money, bank lending and total social financing (on both new and old definitions*) reached record lows in June / July – see chart 1.
Chart 1
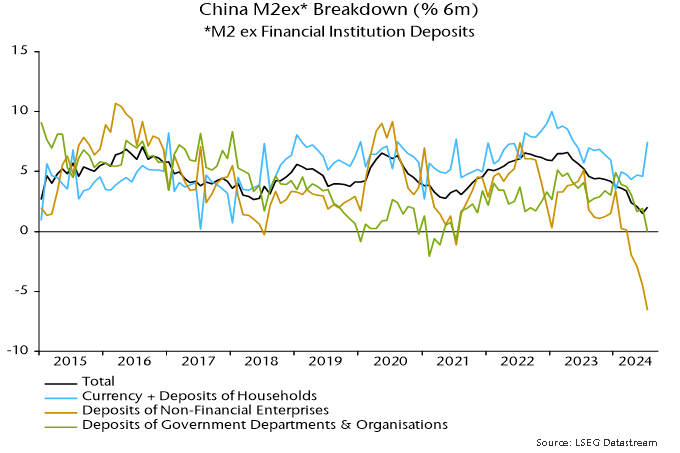
Monetary weakness has been entirely focused on the corporate sector: M2 deposits of non-financial enterprises plunged 6.6% (13.6% annualised) in the six months to July (own seasonal adjustment) – chart 2.
Chart 2
Recent regulatory changes appear to account for only a small portion of the corporate broad money decline.
A clampdown on banks paying interest above regulatory ceilings has resulted in a shift out of demand deposits but money has largely stayed in the banking system – available data suggest modest inflows to wealth management products and other non-monetary assets.
The clampdown has also discouraged the practice of “fund idling” (round-tripping in UK monetary parlance), whereby banks offered loans to corporate borrowers to meet official lending targets, with borrowers incentivised to hold the funds on deposit.
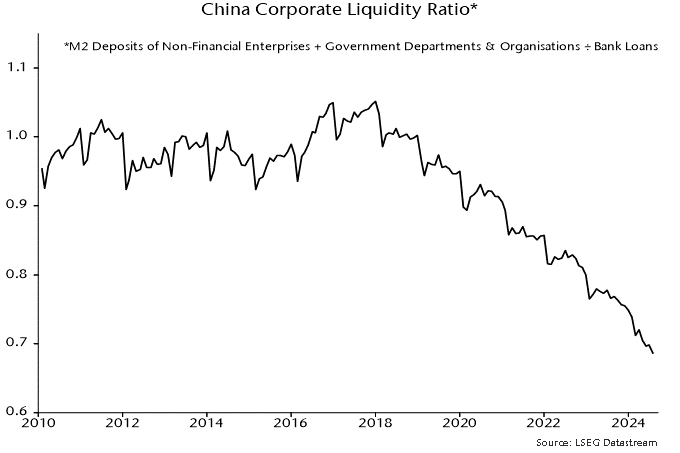
If an unwinding of such activity accounted for the decline in corporate money, however, short-term bank lending to corporations would be expected to show equivalent weakness. Such lending has continued to grow, albeit at a slower pace recently, as have longer-term loans.
A trend decline in the ratio of corporate M2 deposits to bank borrowing, therefore, has accelerated – chart 3.
Chart 3
Household money holdings, by contrast, have been growing solidly – chart 2. An alternative explanation for the corporate money decline is simply that households are still hunkering down as the property crisis deepens, with weakening demand for consumer goods / services and housing transferring income and liquidity from the corporate sector.
The latest PBoC and NBS consumer surveys confirm rock-bottom sentiment – chart 4. If this explanation is correct, corporate money weakness may presage a collapse in profits – chart 5.
Chart 4
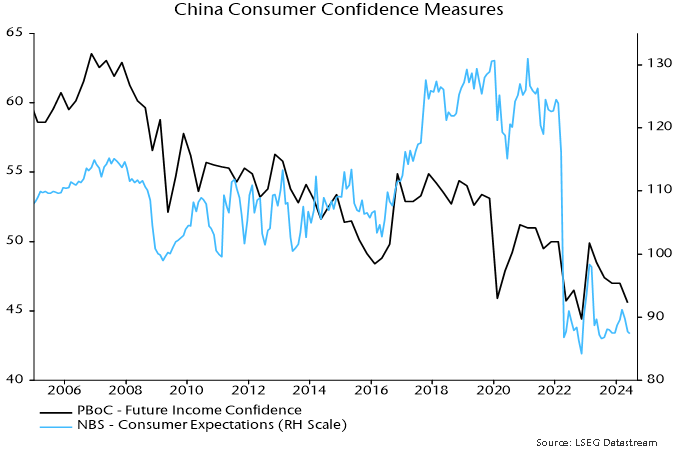
Chart 5

Why hasn’t the PBoC hit the panic button? Policy easing has been constrained by currency weakness: the most comprehensive measure of f/x intervention (h/t Brad Setser) reached $58 billion in July, the highest since 2016 – chart 6. The recent yen rally has offered some relief, reflected in a narrower offshore forward discount, but the authorities may be concerned that this will prove temporary.
Chart 6
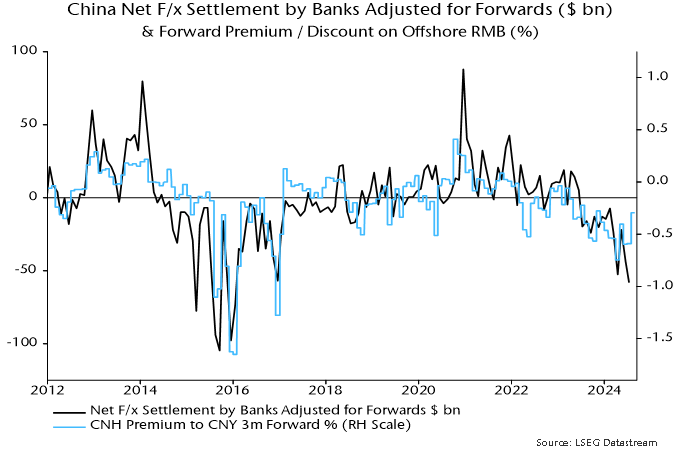
The strange policy of trying to push longer-term yields higher against a recessionary / deflationary backdrop may represent an attempt to support the currency, rather than being motivated primarily by concern about financial risks. To the extent that the policy results in banks selling bonds, however, the result will be to exacerbate monetary weakness and economic woes.
*The previous definition excludes government bonds so is a measure of credit expansion to the “real economy”.

 Source: Bank of Japan
 Source: public
 Source: public