
Oakcreek Golf & Turf is pleased to announce leadership changes, effective January 1, 2025. Barrie Carpenter will transition to the role of Chairman of the Board, and Patrick Nolan will succeed him as President and CEO.
Oakcreek Golf & Turf is pleased to announce leadership changes, effective January 1, 2025. Barrie Carpenter will transition to the role of Chairman of the Board, and Patrick Nolan will succeed him as President and CEO.

The strategy focuses on investing in frontier and emerging market companies that our team expects will benefit from demographic trends, changing consumer behaviour, policy and regulatory reform and technological advancements.
Below, we explore several key factors influencing returns and share observations on the portfolio and the markets.
Investments that we wrote about in previous letters, including Lithuania’s Baltic Classifieds Group (BCG) and Egypt’s Fawry for Banking Technology and E-Payments (Fawry), performed well in the quarter.
BCG is the leading online classifieds group in the Baltics with a dominant position in auto, real estate, jobs and services and generalist marketplaces in Lithuania and Estonia. The company’s shares rallied in the quarter as the market reacted positively to the exit of Apax Partners LLP, the private equity firm that brought BCG to market via IPO in July 2021. Private equity ownership of public companies can often lead to an overhang on the share price and liquidity in the market. Typically, incremental buyers are discouraged by the prospect of an eventual wall of shares hitting the market when the private equity owner(s) decides to sell, and liquidity is lower because a relatively large percentage of the outstanding shares is not freely floated. A high-quality business like BCG, whose revenues and operating profits grew approximately14% annually over the last 4 years, generally absorb this type of overhang on their shares as incremental buyers step into liquidity events with more confidence. This was the mindset with which we approached BCG and thus actively participated in Apax Partners’ share sales this year, ramping up our participation as they approached their exit sale in July.
Fawry is the leading payments technology company in Egypt. The business is anchored by a base of over 360k point of sale machines (POS) that enable merchants to accept payments for the sale of their own merchandise (e.g.: a carbonated beverage) or on behalf of other large businesses like telecoms and utilities. Fawry has leveraged its first mover advantage in POS by introducing value-added services to their merchants such as supply chain financing (i.e.: working capital loans), ATM (a consumer can take out cash from a POS using the merchant’s float at the till for a fee), payment acceptance across many services and agency banking where it acts as a distributor of bank products to underbanked merchants and consumers through dedicated branches that are branded FawryPlus.
Fawry’s merchant offering extends beyond brick and mortar; it is also a leading payment gateway enabling online payments between consumers and merchants and, in the process, captures a piece of the fast-growing e-commerce market in Egypt. On the consumer side, Fawry’s app (MyFawry) counts over 5 million downloads and is experiencing strong momentum, driven by the introduction of a wide range of use cases including bill payments, virtual debit card wallets, buy-now-pay-later, insurance and savings products. In an inflationary environment like Egypt’s, Fawry’s transaction-based revenue model means it can grow revenues at a faster rate than costs due to the operating leverage inherent in its business. This was evident in second quarter 2024 results with operating margins expanding by more than 6% compared to the same period last year. Fawry shares reacted positively to the results, and more importantly to management guidance on net income for the full year, which implied a growth of about 67% y-o-y in local currency.
Like BCG, Fawry shares also benefited from the exit of private equity firm Helios Investment Partners (Helios) from the company in the quarter. Helios has been pressuring the shares through open market sales. Like the BCG case, we took advantage of the liquidity event and were involved in a discounted clean-up sale in which Helios sold its remaining 5% stake in Fawry, which helped remove the overhang on the shares.
The strategy experienced good returns from the healthcare portfolio during the quarter, driven mainly by Morocco’s Aktidal Group (AKT).
AKT is the leading healthcare provider in the country with approximately 15% of the private bed capacity in the country. The Moroccan healthcare market is severely underserved, with the rates of beds and physicians per 1,000 persons below regional averages and well below WHO recommended levels. (A WHO study ranks Morocco 79th of 115 countries in doctors per capita.) This has severely curtailed investment in the sector, with private providers accounting for under 30% of bed capacity in the country of around 40 million people. To address this shortage, the Moroccan government embarked on a series of reforms including rolling out a universal healthcare scheme and removing a restriction that allowed only doctors to invest in the sector. AKT operates 2,532 beds in 23 sites spread across 11 cities.
The clinics managed by AKT are known for their quality of care and the strength of their oncology department (30% of consolidated revenue). AKT is at the forefront of the growth in the sector: its 2023 results which showed revenue and operating profit growth of 84% and 86% respectively. On a recent trip to Morocco, we conducted site visits and meetings with Moroccan doctors and competitors of AKT which validated the company’s brand and reputation in the market and highlighted the growth opportunity that lies ahead for the company.
We continue to be constructive on the opportunity set for the strategy as we enter the fourth quarter of the year. We believe we positioned the portfolio to be considerate of changes in the interest rate cycle, political environment and portfolio company valuations. As always, the ultimate objective of our decision-making process is to express our best research opinions through a diversified portfolio of high-quality businesses that we believe will help us deliver on the strategy’s return objective.
We look forward to continuing to update you on the strategy over the rest of the year.

MENA equity markets had a strong third quarter of 2024 with returns of 6.7% (for the S&P Pan Arabian Index Total Return) but trailed the MSCI Emerging Markets Index, which was up 7.8% in the same period. For the first nine months of 2024, MENA equity markets are up 5.4% compared to 14.4% for the MSCI EM Index.
Our team spent time in Saudi Arabia recently and came back feeling positive about the Kingdom’s medium-term prospects. The impact of the bold socioeconomic reforms that the country pursued in the last few years is visible not just in economic activity (and bad Riyadh traffic), but also in the sentiment expressed and captured in interactions we had with company executives, government officials, Uber drivers and hotel and restaurant staff. One can make the case that Saudi women have been the group that benefited the most from the country’s reform program. The elimination of the religious police establishment and lifting of the driving ban led to freedoms and mobility that Saudi women had not experienced before in their own country. This resulted in remarkable growth in their labour force participation, with data from the World Bank showing it had increased from 20% in 2018 to 35% in 2023. Much has been written about the changes that have been taking place in the Kingdom in the last few years, and we will not expand further on that here. However, we believe Saudi Arabia is in the early innings of a major societal and economic transformation project that will generate multi-year growth in profit pools in certain sectors like financial services, healthcare, education, entertainment, tourism, real estate and technology. Some of the profit pool growth will come at the expense of sectors that are not prioritized under the government’s Vision 2030 program or are not as geared to the evolution in consumer behaviour and evolving regulatory environment. These include brick and mortar retailers or companies that over-earned on government contracts, and which can be found in several sectors including construction and engineering.
Of course, not all is rosy in the Kingdom. While significant progress was made on diversifying the economy, nearly three quarters of the budget is still funded from oil revenue. If it stays, the current combination of low oil prices, production curtailment and high government spending is likely to weigh on growth or raise the risk of fiscal imbalances in the long term. The economic viability of some of the giga projects is difficult to determine and so poses additional capital allocation and fiscal risk. Positively, the country is preparing for this reality and has been actively diversifying its sources of funding from debt and equity capital markets. According to Fitch Ratings, Saudi Arabia was the largest US dollar debt issuer in emerging markets (ex-China) in 1H 2024. The listing of Saudi Aramco and the dividends that the government will receive from that will also continue to support the budget.
Additionally, inflationary pressures are building up in the system – specifically in Riyadh as demand- and supply-side factors collide in areas of housing and transport. This is resulting in downward pressure on household disposable incomes and is manifesting itself in downtrading and increased household debt. Unsurprisingly, many consumer companies are observing down trading in their revenue mix, and many are reacting through aggressive discounting to preserve market and wallet share. Consumers are embracing buy-now-pay-later financing to maintain or extend their purchasing power and this channel is becoming increasingly more prominent in the revenue of many consumer-facing businesses. Furthermore, consumer pressure in Saudi Arabia has the potential to delay further necessary reforms and regulations that can open new profit pools as the government looks to strike a balance between diversifying the economy and protecting consumer purchasing power.
The strategy has had good success investing in Saudi Arabia from identifying growing profit pools early on and investing in companies that were best positioned to grow their share of them. Those include companies we have previously discussed in our letters such as Saudi Dairy & Foodstuff Co. (SADAFCO) in 2018, National Company for Learning and Education (NCLE) in 2019, and The Company for Cooperative Insurance (TAWUNIYA) in 2023. However, there are several challenges that have impeded our ability to express a fuller position in some of the sectors mentioned above. Firstly, we view the quality of certain companies in sectors like real estate and tourism as relatively poor and place some of those in the over-earners group we describe above. The other dynamic that has been increasingly challenging to navigate is the valuation environment, especially with regards to growth stocks. In the last two years, the market moved well ahead of earnings expectations, creating an unfavourable risk-reward set-up for companies the strategy owned and prospected. Using the MSCI Midcap Saudi Index to proxy growth companies in Saudi Arabia, we find that the price-to-earnings (P/E) ratio in 2023 was 38 times, more than double the 2022 levels and above levels we believe reflect cost of capital and growth dynamics on the majority of stocks in that index. Of course, we have made exceptions where we maintain ownership of a few high P/E ratio companies only when we believe their quality and growth potential justify such valuations. While we strongly believe in momentum as a factor for driving returns and outperformance, valuation is the ultimate determinant of our capital allocation reflexivity.
Fortunately, there are three factors working for the strategy at the moment. Firstly, there are growing profit pools resulting from reforms and demographics which is critical to our investing style – growth. Secondly, in the last two months, the market has begun the long-awaited process of recalibrating its expectations of earnings to levels that we deem realistic and interesting – reasonable valuations. Lastly, the strategy has already begun shifting the portfolio to areas where there is a healthy combination of growth, risk-reward and low investor positioning. One particular area where the strategy has been net buying in is the Saudi conventional banks, where we believe technical overhangs have largely suppressed price discovery year-to-date. The set-up for next year looks particularly attractive as those headwinds become less pronounced and bank earnings continue to compound.
We look forward to continuing to update you on the strategy in the next letter.
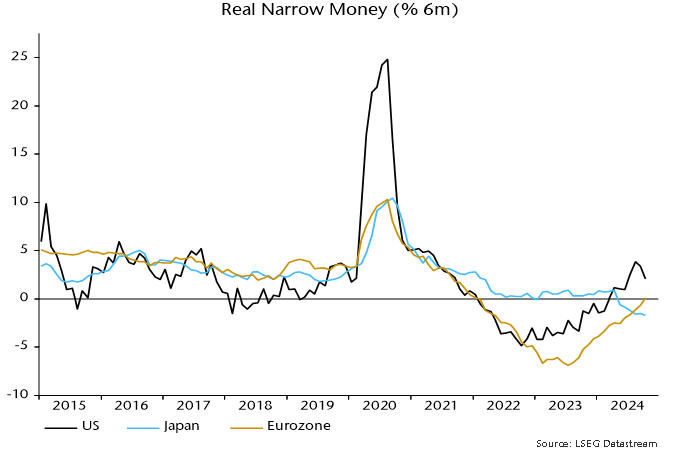
Eurozone money trends are improving but remain too weak to support economic optimism, while country details highlight French stress.
A post in June noted that six-month real narrow money momentum was still significantly negative, suggesting that a minor economic recovery in H1 2024 would give way to a H2 “double dip”. The PMI composite output index fell from 50.9 in June to a flash reading of 48.1 in November.
Six-month real money momentum has risen further since June but was still barely positive in October. It has, however, crossed above Japan and narrowed a shortfall with the US, implying improving relative prospects – chart 1.
Chart 1
Consensus gloom about Germany may be overdone. Six-month nominal narrow money momentum has swung into positive territory since mid-year, catching up with Spain / Italy – chart 2.
Chart 2
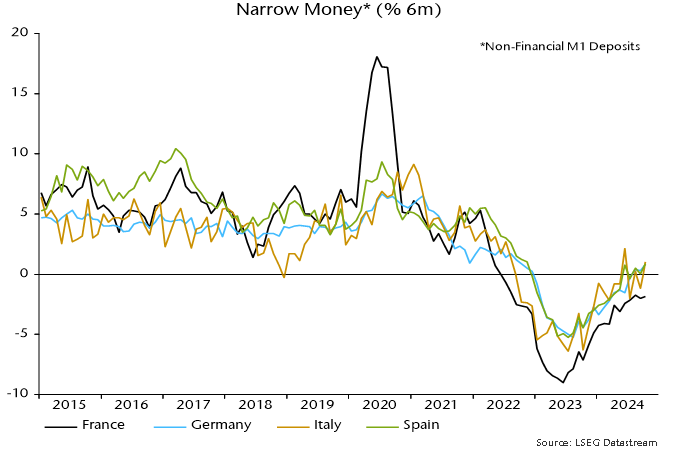
French momentum, by contrast, remains negative, with a recovery stalling in September / October.
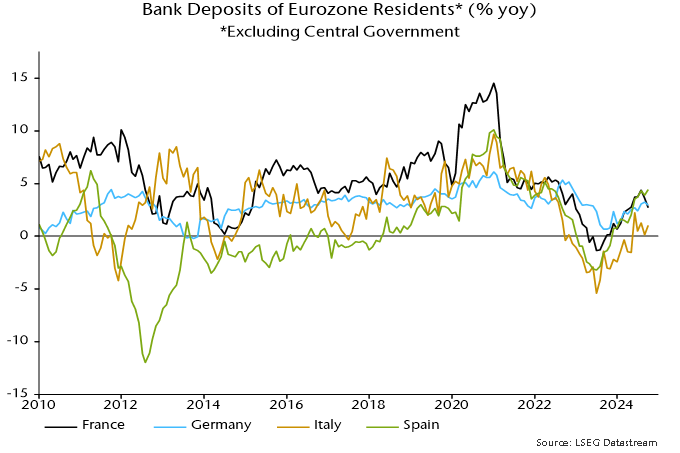
French narrow money weakness appears to reflect low confidence and spending intentions rather than deposit flight (so far). Annual growth of all bank deposits slowed sharply in September / October but is still on a par with in Germany – chart 3.
Chart 3
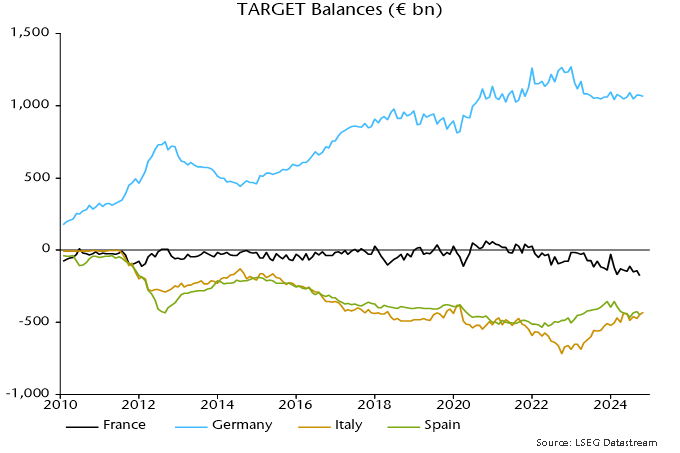
France’s deficit in the TARGET system rose by €34 billion in September to a record €175 billion, which could signal a capital outflow related to the political / fiscal crisis. There has, however, been no corresponding increase in Germany’s surplus, for which an October number is available – chart 4.
Chart 4
A pull-back in US narrow money momentum casts doubt on post-election economic optimism.
Six-month growth of M1A (comprising currency in circulation and demand deposits) eased to 5.7% annualised in October, down from an August peak of 10.0% – see chart 1.
Chart 1
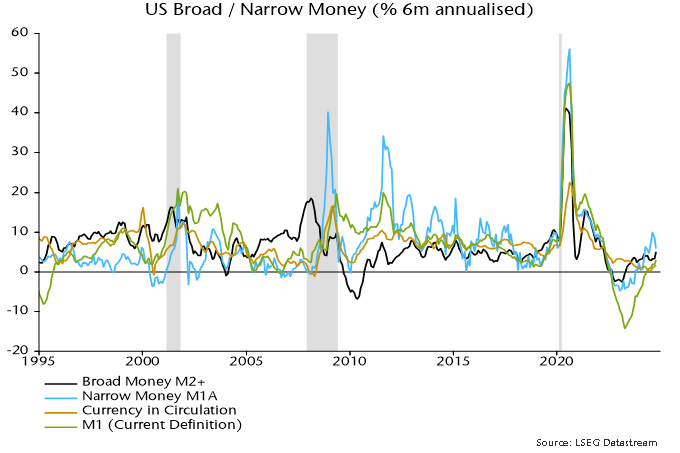
Growth of the broad M2+ measure, by contrast, rose to 5.1% annualised, the fastest since March 2022. (M2+ adds large time deposits at commercial banks and institutional money funds to the official M2 measure.) Narrow money, however, has a better record of signalling turning points in economic momentum.
Six-month expansion of official M1 is weaker, at 2.9%. M1 is no longer a narrow money measure, following its redefinition in 2020 to include savings accounts.
A post in September expressed doubt that a pick-up in M1A growth would be sustained, partly because it had occurred before any rate cuts. In addition, the rise had been driven solely by the demand deposit component, with currency momentum unusually weak.
Six-month growth of currency has recovered but was still only 1.7% annualised in October – chart 1.
A further consideration, noted in a post last month, is that narrow money growth has tended to rise ahead of presidential elections but reverse shortly before or after the poll date – chart 2. (1984 and 2000 were notable exceptions.)
Chart 2
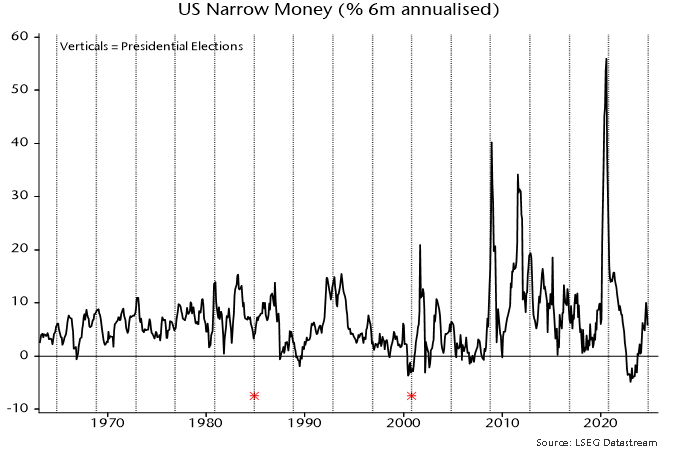
The pull-back to date has been modest but could become more serious, especially if the Fed delays further rate cuts.
Broad money growth, however, could be supported by increased monetary financing of the fiscal deficit, based on Treasury plans for higher bill issuance in Q4 and Q1 (given that these are mostly purchased by money funds and banks).
Narrow / broad money divergences can reflect shifts in confidence and spending intentions affecting broad money velocity. (Such shifts are associated with movements between low-velocity broad money components and high-velocity narrow money.) Relative narrow money strength into the summer was a positive signal for the economy; the reversal suggests fading prospects.
The current stockbuilding cycle may be approaching its mid-point, which typically marks a shift from “risk-on” to a neutral or negative market environment.
The stockbuilding (or inventory or Kitchin) cycle is usually described as ranging between 3 and 5 years. The dating here suggests a normal band of 2.5 to 4.5 years, with an average of about 3.5.
A key indicator used to inform judgements about cycle dates is the annual change in G7 stockbuilding, expressed as a percentage of GDP. Chart 1 shows a long history of this indicator, along with suggested cycle low dates.
Chart 1
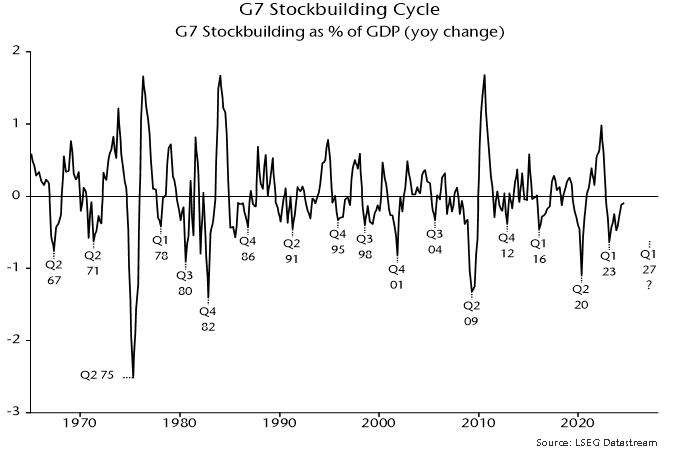
There were 16 complete cycles, measured from low to low, between Q2 1967 and Q1 2023, a period of 55.75 years. This implies an average cycle length of 3.5 years or 42 months.
The cycle described in a 1923 article by Joseph Kitchin averaged 40 months. Kitchin analysed data on bank clearings, commodity prices and interest rates and did not explicitly link his cycle with inventory fluctuations. His average was based on 9 cycles spanning 30 years, i.e. a smaller data set than shown in chart 1.
An average of about 3.5 years harmonises with the longer-term housing cycle, with an accepted average length of 18 years. Five stockbuilding cycles “nest” within each complete housing cycle, implying an average length of 3.6 years (43 months).
The most recent stockbuilding cycle trough is judged to have been reached in Q1 2023. Assuming a starting point in the middle of the quarter, November 2024 is month 21 of the current cycle.
The annual change in G7 stockbuilding was still negative in Q3 and usually becomes significantly positive at peaks, suggesting that the cycle remains an expansionary influence on economic momentum currently.
The cycle is as important for markets as the economy (as shown by Kitchin’s reliance on commodity price and interest rate data). The first half of the cycle (starting from a trough) is typically favourable for risk assets and cyclical exposure. Bear markets and crises have historically been concentrated in cycle downswings.
Table 1 compares movements in various assets since the Q1 2023 trough – third column – with average performance in the first 21 months of the prior 8 cycles (stretching back to the mid 1990s) – first column. The second column shows average performance over the remainder of those 8 cycles.
Table 1
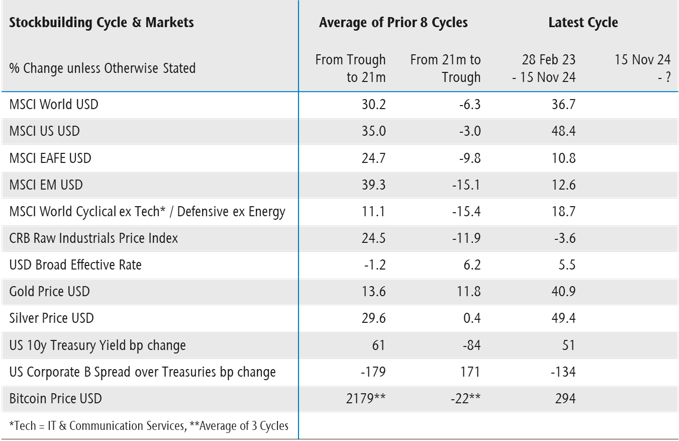
The current cycle has so far largely conformed to the historical pattern, with strong performance of equities, cyclical sectors, precious metals and credit. The suggestion is that remaining upside potential is limited in these areas, with weakness likely over the next 1-2 years as a cycle downswing unfolds.
Could the current cycle prove to be longer than average, extending the risk-on phase? A longer cycle is plausible both because the previous one was short (2.75 years) and to align with the business investment cycle, for which the dating here implies a low in 2027 or later.
A delayed entry to the downswing phase could imply catch-up potential for areas that have lagged relative to history, including non-US / EM equities and commodities.
Cycle timings, however, could be affected by accelerated stockbuilding in anticipation of tariff wars, which could bring forward the cycle peak, although this would not necessarily imply an earlier trough.
The overall message is cautionary. A previous post argued that the “excess” money backdrop for markets is now neutral / negative in stock as well as flow terms. Cyclical considerations reinforce the monetary message.

Crestpoint is excited to announce the appointment of Lindsay Stiles as Crestpoint’s new co-Chief Operating Officer (co-COO). With over 20 years of experience in the commercial real estate industry, Lindsay brings a wealth of knowledge and expertise in operations, asset management, finance, leasing, and brokerage.
Lindsay has held several senior roles throughout her career, including COO of Slate Office REIT and Managing Director at Colliers International. Reporting directly to our President and CEO, Kevin Leon, and working alongside our current COO, Colin MacKellar, Lindsay will focus on operations and business systems, compliance, human resources, and client service. Lindsay’s addition to our team will help us maintain focus, agility, and effective execution as we continue to grow.

Long-distance running is an endurance sport that offers lessons that resonate with investing. In Born to Run, Christopher McDougall illustrates how elite ultrarunners thrive through discipline, adaptability and a love for the journey. These traits align closely with successful investing, where endurance, process consistency and risk management are key. As Rick Mears, an American racecar driver, famously said: “In order to finish first, first you must finish.” This principle underscores the importance of survival in both running and investing, as staying in the race is a prerequisite for achieving long-term success.
Unlike sprint running where youthful energy and explosiveness dominate, endurance running demonstrates that experience often wins over youth. Research by Pimentel et al. (2003) found that well-trained older runners (average age 61) perform as efficiently as much younger runners (average age 26), despite having lower overall aerobic capacity.
Similarly, in investing, knowledge compounds over time. Building and expanding one’s circle of competence is crucial. Each market cycle and every business studied enrich an investor’s knowledge library, deepening expertise and sharpening judgment. In both running and investing, there’s wisdom in pacing. As the saying goes, “to go faster, you need to slow down.” Long-distance runners balance high- and low-intensity sessions to build endurance gradually, much like disciplined investors adhere to a sound strategy and steady capital allocation to achieve long-term success. Small, consistent efforts, whether in running or investing, compound over time to deliver meaningful outcomes.
Runners know that pushing too hard early in the race often leads to injury or burnout. When dealing with investments, aggressive risk-taking can lead to permanent loss of capital, a risk that prominent investors, including Warren Buffett and Howard Marks, frequently caution against. A focus on capital preservation ensures that investors remain in the race long enough to benefit from compounding returns, much like runners who pace themselves to reach the finish line strong.
Long-distance running is as much a mental challenge as a physical one. Runners frequently encounter unexpected obstacles such as tough weather, grueling terrain or moments of self-doubt. Success comes from adaptability and mental resilience, staying focused on the goal despite temporary setbacks. Challenges like these arise in investing during periods of market volatility and uncertainty. Fear and greed often drive extreme behaviour of Mr. Market, but those who remain adaptable and focused on long-term objectives are better equipped to navigate through the storm.
Runners quickly learn that the course has a way of humbling even the most confident athletes. Whether it’s underestimating a hill or pushing too hard on a hot day, overconfidence can lead to setbacks. Respecting the journey and staying humble is key to consistent performance. As with running, overconfidence when investing can be costly. Successful investors recognize the limits of their circle of competence, acknowledging mistakes and making necessary adjustments to achieve superior outcomes.
Hydration and nutrition during the race are critical, but equally important is post-run recovery to avoid injury and maintain peak condition. Periodic system checks – evaluating whether there’s any discomfort, signs of dehydration or creeping fatigue – are part of a successful runner’s routine. Attribution analysis, risk reassessment, and rebalancing serve a similar purpose in investing. They ensure that portfolios remain aligned with long-term goals and avoid overexposure to excessive or unintended risk.
Experienced runners often speak of finding joy in the act of running itself, rather than focusing solely on finishing times. The Tarahumara people, as McDougall describes, run for the love of it, finding fulfillment in the process. This philosophy resonates in investing, where the process is deeply rewarding. However, focusing on the process serves a higher purpose: delivering superior value. Even the best strategies will face periods of underperformance. Endurance runners trust their training, knowing that results come over time. A well-crafted investment strategy is also like this in that it delivers superior value over the full cycle. The real risk lies in abandoning a sound strategy during temporary setbacks, which can lead to irreversible mistakes.
Both running and investing are endurance activities. Success comes to those who stay committed to their process, manage risks thoroughly and adapt to challenges. Beyond the parallels, there are also synergies between endurance running and investing. Running helps nurture and enhance one’s discipline, humility, patience and mental toughness. It also offers a unique mental space for reflection. The steady rhythm of a long run on a quiet sunny morning creates the perfect environment to think deeply about market developments or investment strategies. And finally, as Born to Run highlights, staying active is crucial to maintaining vitality: “We don’t stop running because we get older; we get older because we stop running.” It’s a reminder that endurance, whether in life or investing, is about staying engaged and embracing the journey.

US politics has shifted to the right with an unexpected red sweep of the presidency, Senate and House. Gloomy prognostications for emerging markets abound on expectations for a stronger dollar, stickier inflation and a less dovish Fed. Yet there is very little to go on in terms of hard policy. For example, would President Trump risk a tit-for-tat tariff spiral with China and the EU, or will he pursue deals which incentivise foreign exporters to build manufacturing assets in the US to secure exemptions or reductions? The EU has done something similar with Chinese carmakers.
On inflation, increased deficit spending may be inflationary from 2026 onwards, but our broad money signals suggest the current backdrop is still disinflationary and likely to force a flat-footed US Fed into playing catch-up in its cutting cycle in the short term. This should be weighed against the assumption that Trump means a strong dollar. Further out, with mid-term elections occurring in November 2026, the re-election of the House and a third of the Senate could provide a check on the fiscal agenda.
Should risks of rising trade tensions materialise, this may make EM countries with large domestic markets (i.e., China and India) relatively more attractive versus smaller, open, trading economies in ASEAN.
Overall, our instinct is to avoid knee-jerk repositioning on speculation, at the risk of being whipsawed down the road should events differ from expectations. The reality is that the anti-tyranny checks embedded in the US constitution mean that the president has less power than we commonly think. Our view is that it will pay to remain focused on the cyclical and structural factors at play in shaping return prospects across equities and other asset classes.
Chinese equities took off in the final week of September, rising around 25% in USD terms as announcements of incoming and meaningful monetary and fiscal stimulus blew away traders shorting H-shares and sparked significant domestic inflows. Foreign investors remained on the sidelines.
China equities flows: Domestic vs. foreign investors
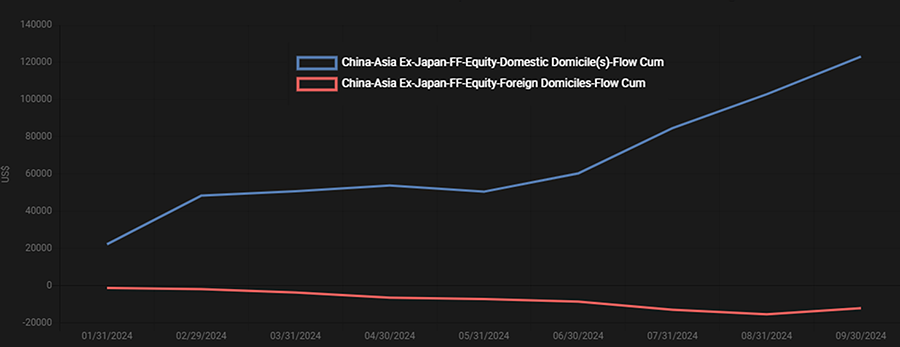
Source: EPFR
The rally was so big that Chinese stocks are virtually level-pegging US equities as at the end of October.
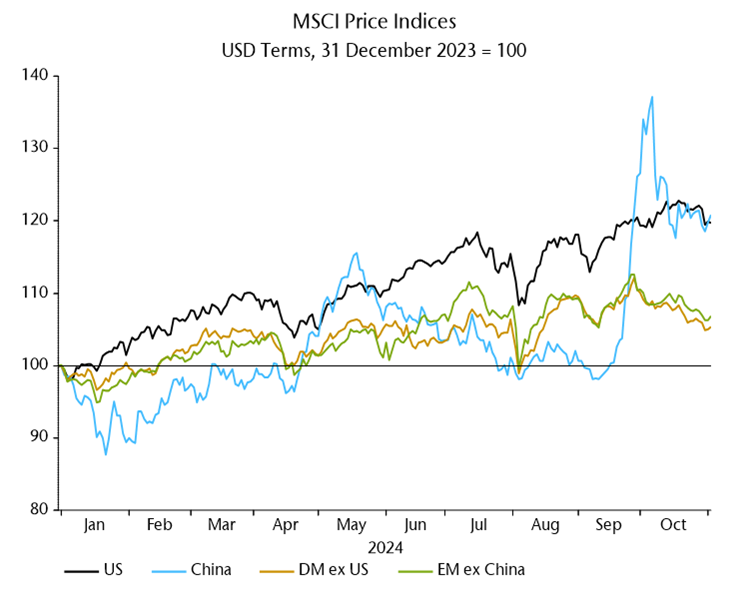
Source: NS Partners; LSEG Datastream
This spurt, led by beaten-down names including property developers and domestic insurers (with high property exposure), is likely the first leg of this rally. We see the pullback in recent weeks as an opportunity to reposition more aggressively at the margins (from a defensive equal weight). While stimulus won’t be a bazooka on the level of 2008-09, the imprimatur for the measures from Xi Jinping himself suggests they will keep coming until we see at least stabilisation in the Chinese economy.
While the threat of tariffs looms for exporters, China has a huge domestic economy with a deep equities market. Direct exports of goods to the US account for only 2.6% of Chinese GDP, less than for Japan and Germany.
With stocks still trading only slightly above their lows of around 10x CAPE, there is an opportunity for deep fundamental analysis to unearth high quality and growing names that have been knocked by investor revulsion for Chinese equities.
Source: NS Partners; LSEG Datastream
For those interested, a short primer on our stock picking approach below – skip ahead for our coverage of current stock opportunities in China.
Made famous by Stern Stewart & Co., the approach homes in on the spread between the rate of return on a company’s invested capital and its cost of capital; economic value added, or EVA for short.
Why? We know that over the medium to long term, EVA is directly tied to the intrinsic value of any company and the fuel that fires up a company’s stock price.
Stock prices reflect how successfully a company has invested capital in the past and how successful it is likely to be at investing new capital in the future. EVA is the best methodology to measure the value that management has added to, or subtracted from, the capital it has employed over time.
Bennett Stewart in his book The Quest for Value boils it down to three drivers:
We are looking for companies that can be expected to generate high or improving returns on the capital employed in their businesses. These are companies run by management teams laser-focused on making investments that earn more than the cost of capital, and undertaking all positive net present value projects, while rejecting or withdrawing from all negative ones.
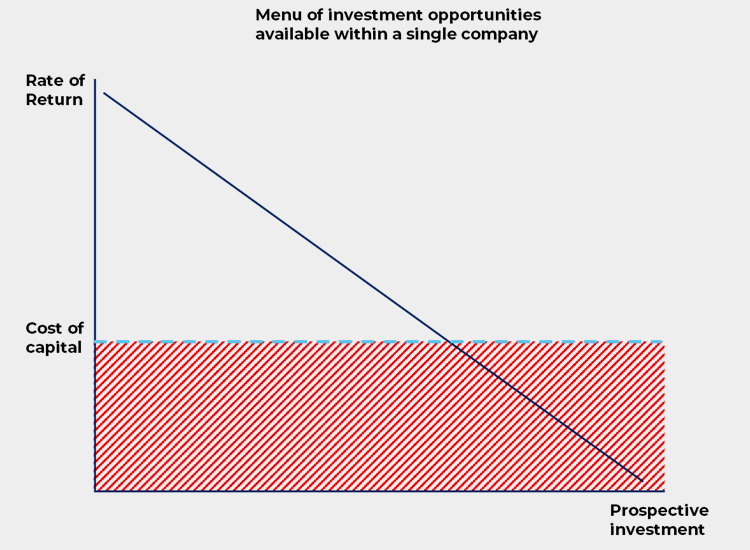
Source: Bennett Stewart (1991), The Quest for Value
Value creation is not enough for long run success. We need to know whether it can be sustained. Our process is focused on identifying the drivers of these returns and assessing:
Our approach identifies highly productive and capital-efficient companies pursuing value creation in a variety of ways. It also focuses on whether that value creation is sustained via competitive moats.
Moats can take a number of forms, from differentiation via proprietary tech, brands or prime locations, to high switching costs, network effects, cost leadership, economies of scale or minimum efficient scale.
This strategy got its start just as the Asian Financial crisis of 1997 unleashed havoc across the region before spilling over into Latin America and Eastern Europe. We know firsthand through several cycles that emerging markets expose investors to both great opportunity but also the potential for downside shocks. Investors have endured a torrid decade in EM equities, but the signals we track suggest an improving outlook. We aim to capture that opportunity through a combination of identifying robust and growing companies compounding ROICs coupled with liquidity and macro analysis – the heart of an all-weather approach that has delivered outperformance over the long run.
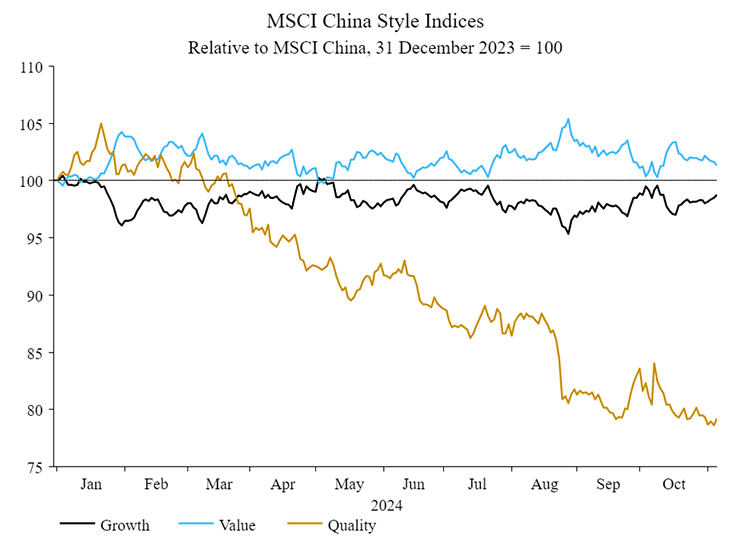
The potential for China’s economy to stabilise on stimulus efforts could feed the next bull market in China. While China looks cheap across the board, our view is that laggard quality growth names look particularly attractive.
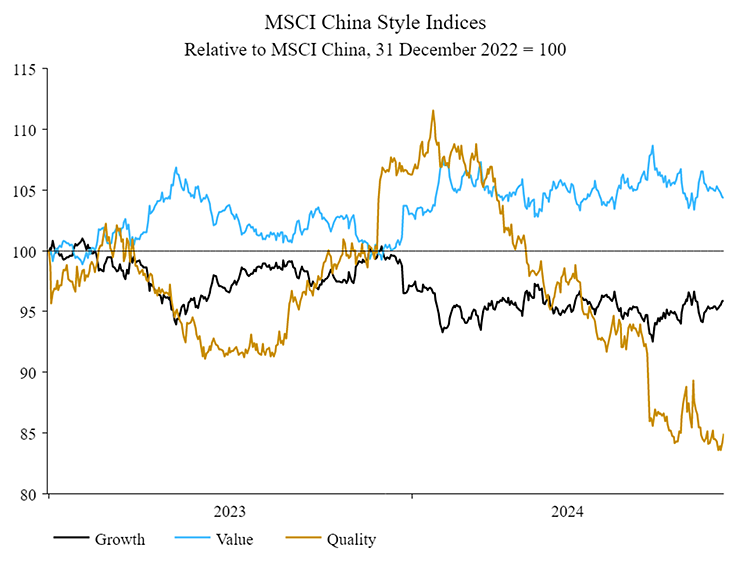
Source: NS Partners; LSEG Datastream
Eastroc Beverage fits the bill as a fast growing, highly profitable and yet attractively valued domestic energy drink champion.

P/E has drifted lower while earnings have held up
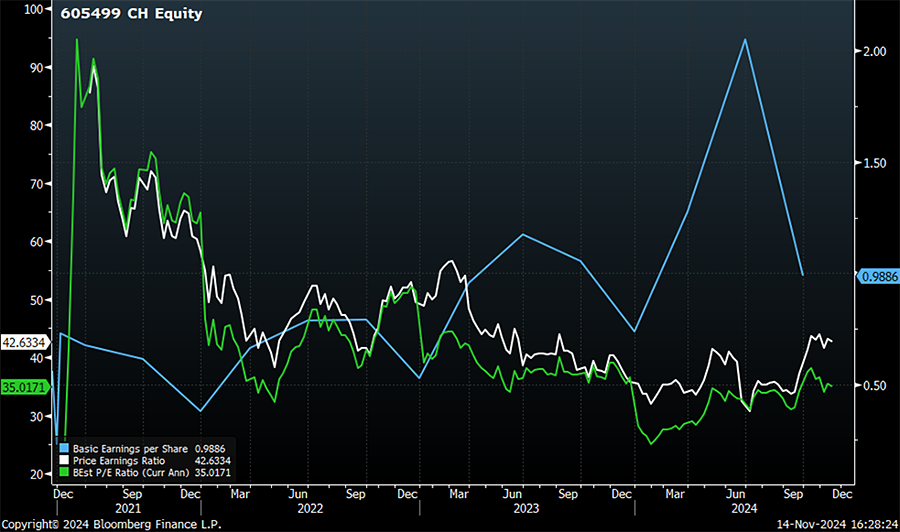
Source: Bloomberg
There is plenty of headroom for growth in the segment, with energy drink consumption by volume in China at only 58% of Japan, 32% of the US, and 23% of the UK (Source: Bank of America). Growth drivers include the expansion of the gig economy, along with new consumption channels in music concerts, e-sports and parties. While major cities are posting healthy consumption growth of c.10% CAGR, peripheral markets are growing rapidly at c.35-40%.
Eastroc is mounting a fierce challenge to incumbent Red Bull, growing market share from 5% in 2012 (with Red Bull at 80%) to nearly 30% in 2023. Not only has Eastroc been effective in building its distribution network out from its Guangdong home base in Southern China, it has also been able to capitalise on strategic missteps from the incumbent. A fallout over a lapsed distribution agreement between Red Bull’s Thai and Chinese operators has spiralled into open warfare over the market. The bickering sister companies are fighting each other in provincial courts, launching rival marketing campaigns and even different pricing strategies. Eastroc offers distributors higher margins and pricing stability, making them more willing to stock the challenger’s inventory. In addition, Eastroc offers value at around half the price per 500 ml of Red Bull, so benefiting from consumers trading down in a weak economy.
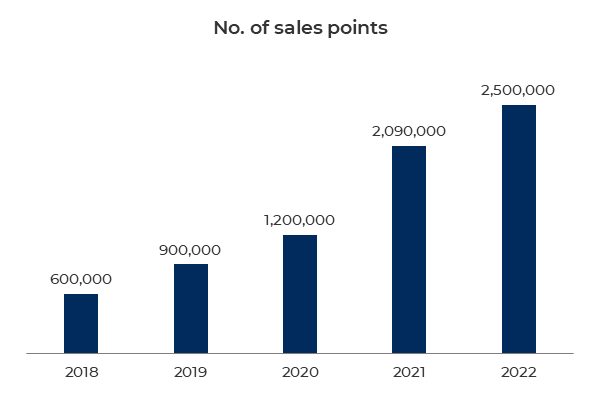
Source: Eastroc Beverages 2022
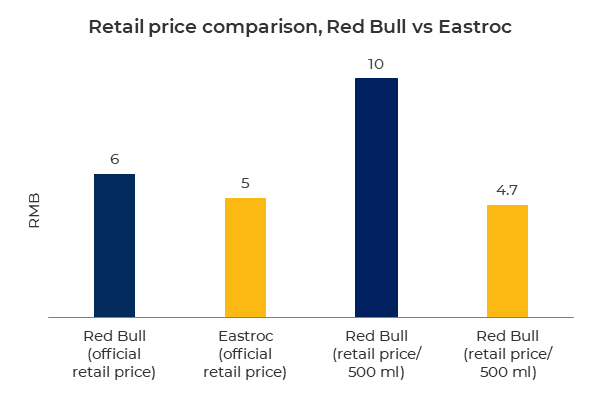
Source: Eastroc Beverages 2022
What we find particularly interesting is the potential for new growth drivers outside its flagship energy drink. Healthier and plant-based energy drinks targeted at women, electrolyte drinks targeted at sporting activity and sugar-free teas can are all large and fast growing segments.

Source: Eastroc Beverages 2024
Eastroc already has a strong distribution network to sell these new lines into, meaning the investment to drive this growth will be relatively small, boosting returns on capital.
Growth requires capex to build out the distribution network, and yet Eastroc looks like a cash machine.
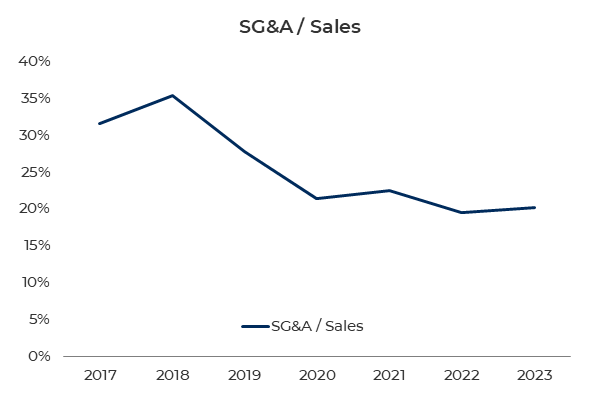
Overheads look contained as it expands.
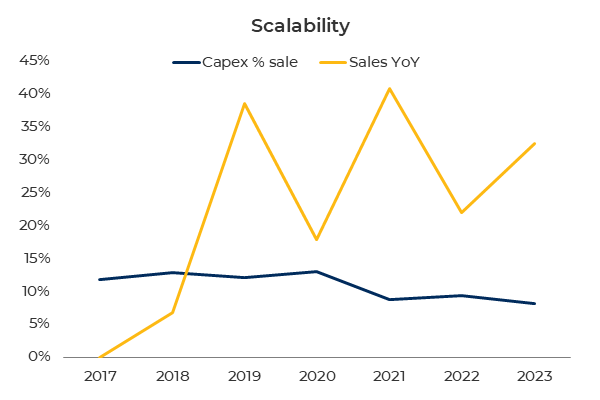
This business scales well.
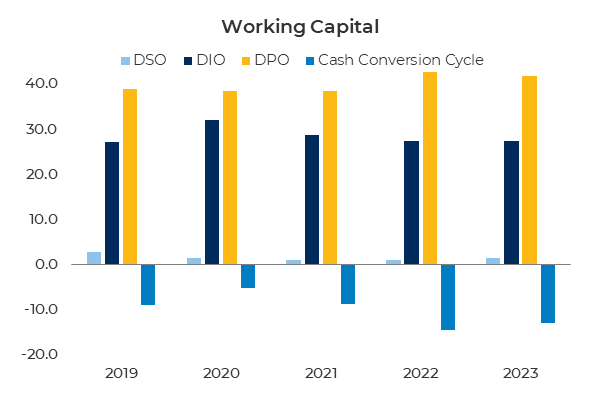
Paid by customers early while pushing out payables.
Margins are resilient.
Unsurprisingly, the EVA (ROIC/WACC spread) is high and set to rise over the next 2-3 years.
Eastroc is the fast-rising challenger to Red Bull in China and enjoying strong growth tailwinds in the energy drink segment. The company is able to squeeze more value from its established network in Guangdong without tying up significant capital. The capital that it does invest is used to expand carefully into new territories that promise returns that far exceed the cost of capital.
Eastroc is the type of stock we would expect to outperform should this upward move in Chinese equities mature into a wider bull market. CCP stimulus efforts are not yet enough to shift consumer sentiment meaningfully, but valuations are compelling and the growth is there for companies like Eastroc to perform regardless.

In recent years, tariffs have become a central component of US trade policy, impacting international relations and economies worldwide. The resurgence of tariffs, particularly those aimed at China and specific industries, reflects a strategic move to protect US industries and reduce its trade deficits.
A second round of tariffs under the next US administration could fuel inflationary pressures, affecting both US and international economies. A universal 10% tariff on imports, as proposed, would directly raise prices for consumers, making imported goods more expensive. This price increase could reduce domestic purchasing power and may lead to reciprocal tariffs from trading partners, further escalating costs and reducing trade flows. Additionally, these trade policies might destabilize global trade by disrupting established supply chains, potentially leading to short-term job creation in the US, but creating a long-term economic inefficiencies.
At the time of Trump’s election in 2016, the US trade deficit in goods was close to 3.9% of GDP with nearly half coming from trade with China. Starting in 2018, tariffs were added to an increasingly wide range of Chinese products. The average tariff on imports from China was 3.1% in 2017. It was raised in waves, exceeding 20% by the end of 2019, before a deal was reached in which China committed to increase its purchases of American products. Tariffs were also imposed on specific products from other countries, such as steel.
Surprisingly, the goods trade deficit for 2023 remained close to 3.9% of GDP. Although the share attributable to China was reduced to 25%, imports from other countries like Vietnam, India, South Korea and Germany increased.
A potential revival in tariffs would be detrimental to certain industries. Asia and Germany’s automotive and machinery industries are particularly vulnerable due to their high dependence on US demand. Such tariffs would likely reduce Asian and German exports and might encourage companies to adjust their supply chains or relocate production to the US.
As a potential response, countries could retaliate on targeted goods or offer trade concessions to diffuse the tension. During the first Trump presidency, the EU agreed to lower their tariffs on some US products and made concessions on the import of beef and soybeans. The EU may again offer to import more goods from the US such as armaments, liquified natural gas (LNG) and agricultural products. We believe that offering trade concessions and reaching bilateral trade agreements would be more favourable than imposing blanket tariffs on a large selection of goods.
In summary, enhanced tariffs could lead to increased consumer prices, hurt international relations, and potentially shift production and trade in the most vulnerable industries. These economic shifts would challenge the international economies, especially if retaliatory actions escalate to a trade conflict.