Our 2024 Responsible Investment report reflects our commitment to sustainable infrastructure investments and reports on the initiatives we’ve taken across our portfolio over the past year.

Report highlights:

  • Long-term investors: As an employee-owned business, we invest directly alongside our clients – aligning our success with theirs. This shared commitment drives our focus on building and maintaining a resilient, high-performing portfolio that delivers long-term value.
  • Sustainable practices: Given the long-term nature of our investments, we recognize that operating responsibly is essential to protecting and enhancing asset value. We identify, assess, price, manage and monitor material responsible investment-related risks and opportunities throughout the investment lifecycle.
  • Impactful projects: Our investments provide essential services across a diverse asset base of critical transportation, social and renewable energy infrastructure, including over 2 GW of operating capacity through a range of clean energy sources including wind, hydro and solar.
  • Community engagement: We actively work with like-minded partners and stakeholders, including local communities and Indigenous groups to align interests, foster mutual understanding and ensure that those impacted by our projects are meaningfully engaged throughout the asset lifecycle.

Korean temple in front of N Seoul Tower at Namsan Mountain Park.

South Korean equities have been on a rollercoaster over the past few years. In early 2024, we saw exuberance fuelled by the announcement of the Corporate Value-Up program. Many were hoping the country was shaping up to follow in the footsteps of Japan – Super-cheap Korean equities rally on market reform talks

Hopes were shattered by disgraced former president Yoon’s attempt to impose martial law in December – South Korea rocked by president’s attempt to impose martial law

While the situation was precarious, South Korean institutions held firm and Yoon now sits in a Seoul detention centre awaiting trial while Democratic Party leader Lee Jae-Myung decisively won a June snap election on a platform of corporate governance reforms.

South Korean equities rally

Korean equities surged around the election, led by financials and technology stocks. We gradually lifted our underweight exposure to neutral and then a modest overweight through the first half of 2025, leaning into the promise of revisions to the Commercial Law Act and Lee’s support of the Value-Up program.

Line graph showing MSCI Price Indices January to June 2025

Source: LSEG Datastream

In our view, a series of policy initiatives pushed by the Lee administration have the potential to lift a host of beaten-down domestically focused names, outlined below.

Supporter of Value-Up

Despite being launched by Lee’s then opposition, his party is a supporter of Value-Up. The initiative, modelled on the Tokyo Stock Exchange reforms aims to narrow the “Korea Discount” by enhancing corporate governance, capital efficiency, and shareholder returns.

By publishing Value-Up plans and following through, Korean companies can access Korean Exchange fee exemptions, gain priority in investor relations events, and other awards to enhance market visibility. Taking these steps will also help to better align South Korean governance standards with global best practice, and in turn attract foreign capital and boost valuations.

Commercial Act revision

The Lee government quicky jumped into action to push through revisions to the Commercial Act, which align with the aims of Value-Up. In early July a revised version of the Commercial Act amendment was passed with support from both the Democratic Party and the conservative opposition as a compromise. This version:

  1. mandates that directors balance corporate and shareholder interests;
  2. requires electronic shareholder meetings for large listed companies (market cap over 2 trillion won, ~$1.5 billion); and
  3. prohibits rejecting cumulative voting requests to empower minority shareholders.

The Cabinet approved these amendments on July 15, 2025, signalling their imminent implementation.

Encouraging more equity investment and less speculative investment in housing

The government is also intent on pushing for a shift in the balance of household wealth (approximately 70% of household assets) from real estate to equities. President Lee’s aim is to channel liquidity away from housing speculation to promote greater stability in the Korean economy, and redirect capital into equities. The idea is that this will fuel investment in more productive sectors such as technology and defence in order to stimulate innovation and economic growth.

Value-Up and revisions to the Commercial Act are key levers to encourage this shift by households into domestic stocks.

Excess liquidity provides fuel for stock market rallies
Chart showing Korea M2 growth year over year versus Kospi return year over year from 2001-2024.
Source: CLSA

Fiscal loosening

The government is also taking direct action to counter stagnant economic growth. In June the government proposed a KRW30.5 trillion supplementary budget, representing 0.9% of GDP, with KRW10 trillion to be handed out as cash for consumption (equivalent to around USD100-350 per person depending on income).

Portfolio – financials exposure boosted

Our portfolio names in financials and technology in South Korea have rallied this year on hopes for President Lee Jae-Myung’s reform platform. Our position in Samsung Life is a beneficiary of the Value-Up program, and rose 67.7% in USD terms through the second quarter alone on expectations reforms will force the disposal of company holdings in affiliated companies. Samsung Life selling its position in Samsung Electronics would trigger a huge one-off gain which will free up cash to be re-deployed into more productive uses and boost returns on equity. We trimmed Samsung Life to rotate into laggard DB Insurance, which is cheaper and in our view, has greater upside catalysts, being yet to announce Value-Up plans.

Leading bank KB Financial was another strong performer, reporting robust profit growth along with a surprise share buyback and cancellation as well as a higher dividend. The bank trades on a modest 0.7x price to book with a return on equity of 9.7% and rising, as well as a 4% dividend yield.

KB Financial driving ROE higher
Chart showing KB Financial's ROA, ROE and ROE excluding non-recurring items from 2020 to Q1 2025.
Source: KB Financial Q1 2025

… while buybacks continue
Bar graph showing KB Financial's common shares outstanding from 2020 to March 2025.
Source: KB Financial Q1 2025

… and dividends increase
Bar graph showing KB Financial's dividends per share from 2020 to Q1 2025.
Source: KB Financial Q1 2025

KB also looks set to benefit from planned fiscal loosening by the Lee government and falling central bank rates boosting loan growth.

More to come?

Shareholder and political pressure on South Korean corporates to address their poor corporate governance records continues to build. Progress will no doubt be slow and incremental, but there is a lot of low hanging fruit the government can pursue including changes to capital, dividend and capital gains taxes to encourage investment and reform simultaneously.

Success in these efforts could well be the basis for a full market re-rating.

EM equities outperformed DM on average historically under two conditions, namely 1) global (i.e. G7 plus E7) six-month real narrow money growth was above industrial output growth and 2) real money growth was stronger in the E7 than G7. The first condition indicates a supportive global liquidity backdrop while the second signals stronger economic prospects for EM than DM.

Allowing for data reporting lags, these conditions were satisfied from end-February through end-June, a period during which MSCI EM outperformed MSCI World by 5.8%. However, the latest numbers, for May, show global six-month real money growth slipping back below industrial output momentum, although the E7 / G7 gap remains positive – see chart 1.

Chart 1

Chart 1 showing G7 + E7 Industrial Output & Real Narrow Money (% 6m)

The suspension of the positive signal may prove temporary. Global industrial output has been boosted by front-loading to avoid higher US tariff rates, with payback likely during H2.

Chart 2 shows six-month real narrow money momentum in major EM economies and includes June data for Brazil, China and India. The stand-out recent development has been a pick-up in India in response to aggressive RBI easing, suggesting acceleration in an already strong economy.

Chart 2

Chart 2 showing Real Narrow Money (% 6m)

Chinese six-month momentum stabilised in June after falling in April / May. The series shown is based on the new official M1 measure, which includes household demand deposits and is close to the “true M1” definition historically used here. The June stabilisation followed a cut in reserve requirements in May and an associated further decline in money rates.

The Chinese slowdown since March is regarded here as of limited concern and likely to reverse, for the following reasons. First, there has been no loss of momentum in “private non-financial M1”, comprising currency and demand deposits of households and non-financial enterprises – chart 3. The aggregate slowdown appears to be attributable a fall in money holdings of government-related organisations and / or non-bank financial institutions.

Chart 3

Chart 3 showing China Narrow Money (% 6m)

Secondly, M1 excludes fiscal deposits, which have been growing solidly ahead of likely spending and / or transfers to government-related bodies. Momentum of an expanded aggregate including such deposits fell by less in April / May, recovering slightly in June.

Elsewhere. Taiwanese growth firmed in May and may rise further as currency strength forces the central bank to ease. By contrast, momentum has slowed in Indonesia, Korea and Mexico and remains negative in Brazil.

Windmill turbines on a sunny day in Germany on a blooming bright yellow field and blue sky.

In our last commentary, we discussed Germany’s recent infrastructure bill worth EUR500 billion to be deployed over twelve years. A key component of this bill is climate-led investments, worth one-fifth of the total budget, which finances the energy transition and climate protection measures. Examples of these measures include energy-efficient building renovations, development of electric mobility infrastructure, expansion of the hydrogen industry, promotion of energy efficiency, technologies to decarbonize industrial operations, etc.

Many countries have implemented clean energy plans to mitigate climate risk. Norway generates almost 100% of its electricity from renewable sources, primarily hydropower. Other leaders in renewable energy adoption include Sweden, Costa Rica, the UK, Iceland, New Zealand and Germany, etc.

A lesser known, but much bigger investment plan, is Japan’s Green Transformation (GX) policy worth JPY150 trillion (over USD1.1 trillion) to be executed over ten years. It was announced in February 2023 with many detailed targets across energy, transport, construction, industry and finance. Its goal is to achieve carbon neutrality by 2050 and transform the country’s economy toward clean energy.

In our Sustainable Global Small Cap Strategy, clean energy and sustainable infrastructure are among the major themes. We have witnessed the strong growth of some holdings benefiting from these mega trends. Below are a few examples:

  • Boralex Inc. (BLX CN) develops, builds and operates renewable energy power facilities (wind, hydroelectric, solar and thermal). It owns and operates about 100 wind power stations, 15 hydroelectric plants, a dozen solar power stations and two energy storage facilities. Its combined installed capacity has more than doubled in the past five years to over 3.1 GW, with 8 GW in the pipeline. Major markets are Canada, France, the United States and the UK.
  • Aecon Group Inc. (ARE CN) is a Canadian construction company, providing a range of services to private and public sector clients in infrastructure, mostly in North America. In 2024, 59% of its revenues and 78% of backlog were tied to sustainability projects from renewable energy (hydroelectric, geothermal, solar) to energy transition (nuclear, battery storage, energy transmission and grid modernization) and water management (supply, distribution and wastewater treatment). As of March 31, 2025, it had a record-high backlog of CAD9.7 billion.
  • Nexans SA (NEX FP) is a global leader in cable systems and services. It is strategically focusing on the electrification market. 75% of sales generated from products and services contribute to energy transition and efficiency. Well-known for its high-voltage transmission cable and subsea cable, Nexans specializes in power generation, transmission, distribution, infrastructure, telecommunication, mobility services and more. As of March 31, 2025, it had a record-high backlog of EUR8.1billion. Major markets are Norway, France, Germany and Canada.

Within the theme of sustainability is the growing industry of green hydrogen. The global green hydrogen market size is currently estimated at over USD12 billion in 2025 and is expected to expand at a CAGR of 41% from 2025 to 2034.

Projected growth of green hydrogen market size from 2024 to 2034.

There are national policies in place that favour green hydrogen: Germany’s hydrogen strategy targets at least 10 GW production of green hydrogen by 2030; the UK’s hydrogen strategy requires at least half of its 10 GW target to come from green hydrogen by 2030; Japan’s hydrogen strategy focuses on achieving carbon neutrality by 2050 through the widespread adoption of hydrogen across various sectors.

There are three main types of electrolysis used for green hydrogen production: Proton Exchange Membrane (PEM), Alkaline and Solid Oxide. Advantages of PEM electrolysis specifically are that it uses a solid polymer electrolyte membrane and operates at higher current densities, making it suitable for dynamic and intermittent renewable energy sources. Major players in the PEM segment include Plug Power, Nel Hydrogen, Cummins and, one of our holdings, ITM Power PLC (ITM LN).

ITM Power is a pure-play in green hydrogen and manufactures electrolyzers based on PEM technology; it’s known for its work with Linde on large-scale PEM electrolyzers. Germany is its biggest market generating 37% of total sales, followed by the UK, Austria, Australia and rest of Europe.

Countries prioritizing initiatives for renewable energy, sustainable infrastructure and electrification will look to work with companies specializing in these sectors. We feel that the holdings within our Sustainable Global Small Cap Strategy are well positioned to benefit from this global effort toward a greener future.

UK money momentum has weakened alarmingly. The broad non-financial M4 measure – comprising holdings of households and private non-financial corporations (PNFCs) – grew by just 1.9% annualised in the three months to May. Non-financial M1 contracted at a 2.7% pace – see chart 1.

Chart 1

Chart 1 showing UK Narrow / Broad Money & Bank Lending (% 3m annualised)

Three-month bank lending growth held up but is likely to fall sharply as a large monthly rise in March – related to the end of the stamp duty holiday – drops out of the calculation. Lending typically follows money trends.

It is unusual for narrow money to lag broader measures when interest rates are falling – lower rates reduce the opportunity cost of holding more liquid forms of money, encouraging a shift out of time deposits and savings accounts. 21% of non-financial M1 is non-interest-bearing. The average interest rate on the stock of household time deposits fell by 31 bp between August and May, according to BoE data.

The demand to hold narrow money is driven mainly by the need to finance future spending, so weakness despite rate cuts is ominous for economic prospects. Put differently, money trends support the view here that MPC policy easing has been too slow, providing insufficient support for activity and increasing the risk of an inflation undershoot.

The monetary relapse could partly reflect payback for temporary factors that boosted growth in late 2024 / early 2025.

A jump in money numbers in October appears to have been related to asset sales in anticipation of changes to capital taxes in the Budget at the end of that month. An asset disposal can boost broad money if financing by the purchaser involves – directly or indirectly – an expansion of banks’ balance sheets*. The effect, however, would be expected to reverse as the seller of the asset deployed the proceeds.

Mortgage lending and broad money were boosted in Q1 by front-loading of housing transactions ahead of the end of the stamp duty holiday. Increased activity may also have resulted in a temporarily higher demand for narrow money.

A reversal of these effects may explain broad money stagnation and a narrow money decline in April / May. Still, annual rates of change should be free of such influences and have slowed to 2.5% for non-financial M1 and 3.6% for M4, from recent peaks of 3.4% and 4.8% respectively. Eurozone annual non-financial M1 growth, by contrast, has risen further to 4.3%.

The sectoral breakdown shows that the recent fall in narrow money reflects a switch by households into time deposits / cash ISAs – their aggregate money holdings have continued to expand, though at a slower pace. By contrast, corporate broad money contracted in April / May, consistent with a negative financial impact from NI and minimum wage hikes – chart 2.

Chart 2

Chart 2 showing UK Household & PNFC* Money (% 3m annualised) *PNFCs = Private Non-Financial Corporations

The annual rate of change of corporate broad money is back in negative territory, following small positive readings over December-April, suggesting further weakness in employment and fading capex prospects.

*More precisely, an expansion of banks’ domestic lending or net foreign assets, or a fall in their net non-deposit liabilities.

The latest signal from monetary data is that global economic momentum will inflect weaker from around late 2025. Cyclical considerations suggest that this will mark the beginning of a sustained downswing into 2027.

Lagged money trends argue that underlying inflation will fall further and remain low through 2026. Nevertheless, central banks may be slow to offset economic weakness with additional policy stimulus because of concerns about tariff effects and fiscal indiscipline, as well as scarring from the 2021-22 inflation surge.

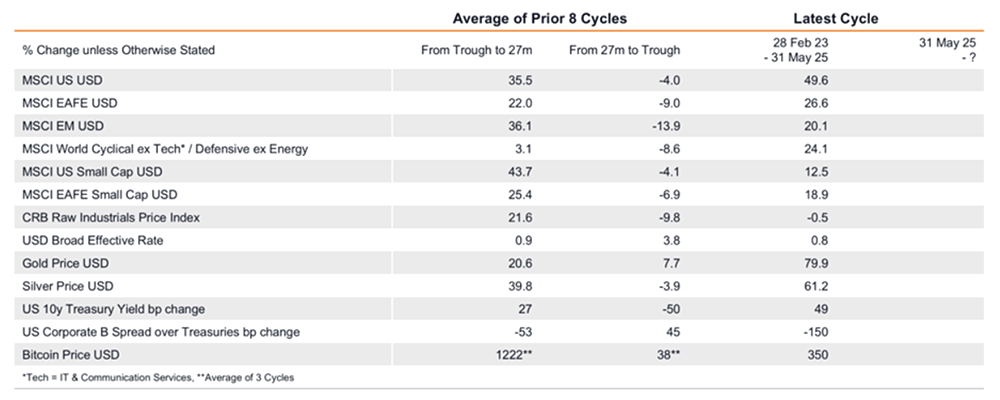
The suggestion is that equity markets face rising headwinds, with another sustained bull phase unlikely before 2027, when key cycles are scheduled to bottom. An appropriate strategy may be to underweight markets where monetary trends are relatively weak – Japan and the UK currently – while overweighting sectors with lower earnings sensitivity to expected cyclical weakness.

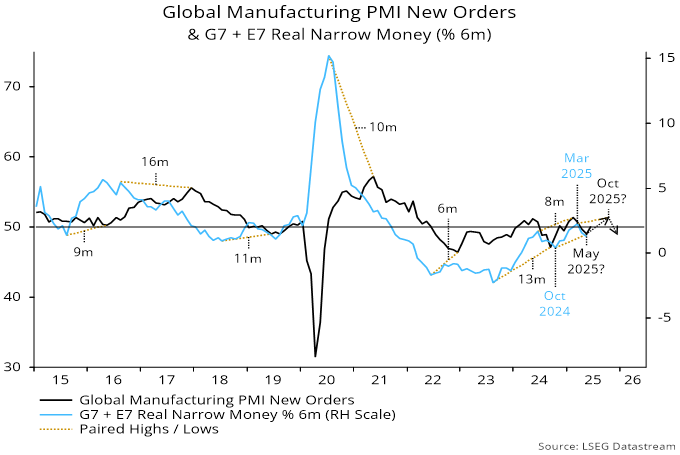
Elaborating on the above, global six-month real narrow money momentum – a key leading indicator in the approach followed here – reached a local high in March, falling sharply in April / May – see chart 1.

Chart 1

Chart 1 showing G7 + E7 Real Narrow Money (% 6m)

The rise from October 2024 into March suggested that the global economy would regain some momentum from around mid-2025, based on the recent average lag. A June rise in manufacturing PMI new orders could mark the start of such a shift, although results from national (as opposed to S&P Global) surveys were mixed. Still, April / May monetary weakness argues that any near-term recovery will be short-lived, with economic indicators likely to deteriorate again from around late 2025 – chart 2.

Chart 2

Chart 2 showing Global Manufacturing PMI New Orders & G7 + E7 Real Narrow Money (% 6m)

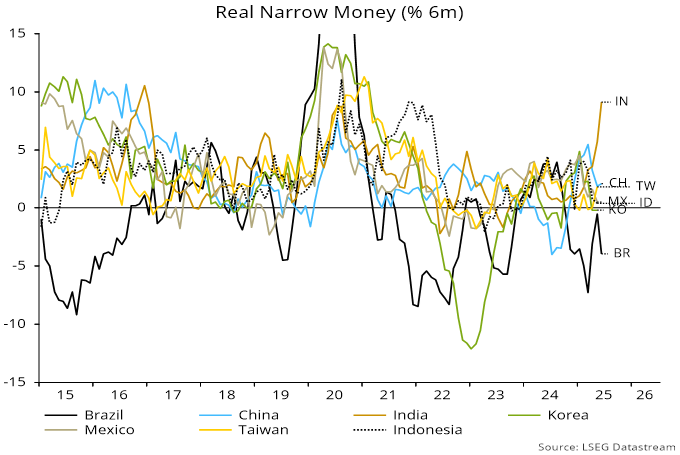
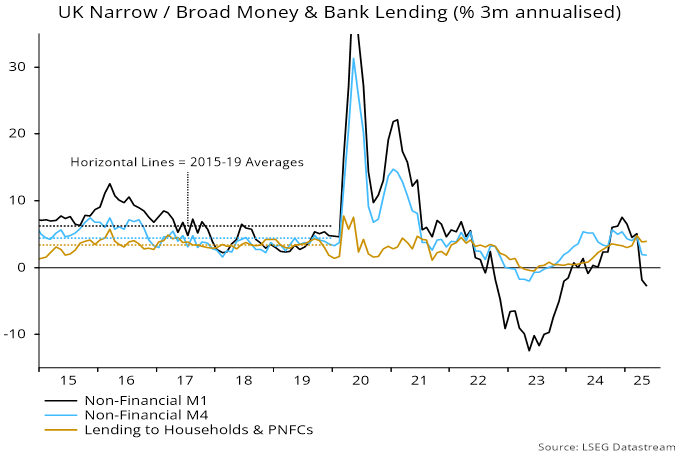
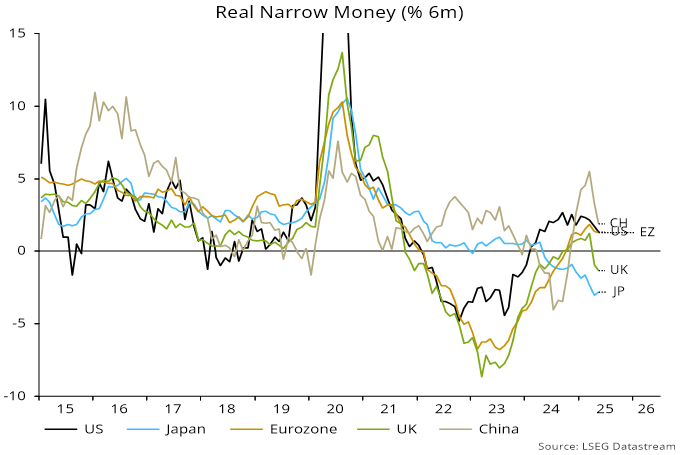
The latest fall in real money growth has been broadly based across countries, reinforcing the negative signal. Momentum is notably weak in Japan and the UK, arguing for economic underperformance. Eurozone growth has held up but hasn’t yet crossed above the US, cautioning against “europhoria” – chart 3.

Chart 3

Chart 3 showing Real Narrow Money (% 6m)

From a cyclical perspective, the stockbuilding cycle is in the window for a peak in terms of both time since the last low (Q1 2023) and the contribution of inventory accumulation to annual G7 GDP growth – chart 4. The latter has been boosted by front-loading to avoid tariffs, which appears to have continued in Q2.

Chart 4

Chart 4 showing G7 Stockbuilding Cycle G7 Stockbuilding as % of GDP (yoy change)

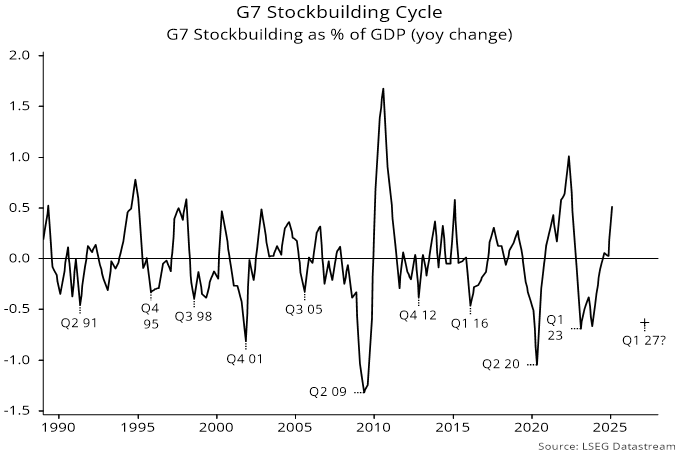
The cycle should turn down by early 2026 at the latest and the baseline assumption here remains for a low in H1 2027, implying that the current cycle will be slightly longer than the 3.5 year historical average, balancing a shorter-than-average prior cycle. Stockbuilding cycle downswings are usually associated with significant slowdowns (or worse) in global economic growth and underperformance of risk assets.

A key question is whether the coming downswing will be accompanied by weakness in the housing and / or business investment cycles, in which case a 2026-27 recession becomes the baseline. A housing downturn is more likely, given the maturity of the current cycle (16 years versus an 18-year average) and downward pressure from elevated longer-term interest rates. The business investment cycle is less advanced (year five versus a nine-year average), with corporate financial balances still healthy and AI deployment providing a tailwind.

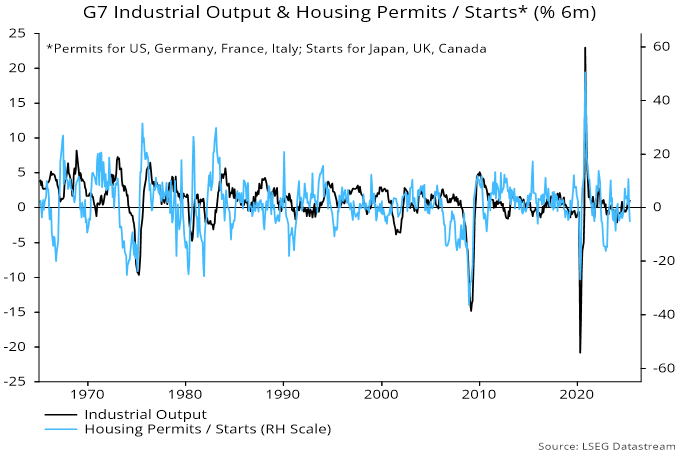
Close attention, therefore, should be paid to housing indicators. The six-month rate of change of G7 housing permits / starts recently turned negative, suggesting a darkening outlook – chart 5.

Chart 5

Chart 5 showing G7 Industrial Output & Housing Permits / Starts* (% 6m) *Permits for US, Germany, France, Italy; Starts for Japan, UK, Canada

Inflation follows money growth with a roughly two-year lag, according to the simplistic monetary rule, which outperformed every other forecasting approach in 2021-22. Annual broad money growth bottomed in mid-2023 in the G7 and a year later globally, with limited subsequent recoveries. The suggestion is that underlying inflation will fall further and remain low through 2026.

On the analysis here, therefore, central banks could limit economic weakness by delivering timely additional policy stimulus while still meeting, or even undershooting, their inflation objectives. The US Fed, however, may continue to drag its feet amid uncertainty about near-term tariff effects and counterproductive political pressure, with a knock-on effect on the pace of easing elsewhere.

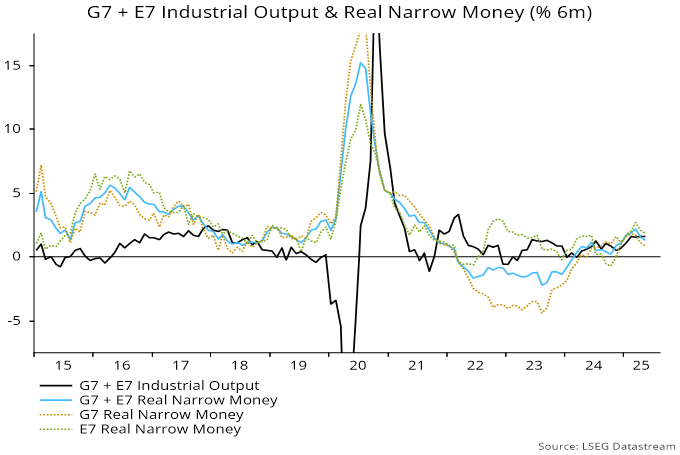
Both global “excess” money flow indicators used here to assess equity market prospects are currently negative, having been mixed three months ago. Specifically, global six-month real narrow money momentum has crossed back below industrial output momentum, while 12-month real money momentum remains beneath its long-run average – chart 6.

Chart 6

Chart 6 showing MSCI World Cumulative Return vs USD Cash & Global “Excess” Money Measures

The indicators were misleadingly negative in 2023-24 because of a stock overhang resulting from the 2020-21 money growth surge. The assessment here is that there is no longer any excess relative to current levels of nominal GDP and asset prices.

Arial view of bank towers in Frankfurt, Germany.

Germany has embarked on a historic transformation of its fiscal and economic landscape with the passage of its latest infrastructure bill in March 2025. This legislation, resulting from a rare constitutional amendment, is poised to have profound and far-reaching effects on the German economy, public services and the broader European region over the next decade.

The new law creates a €500 billion infrastructure fund, to be deployed over twelve years, aimed at modernizing Germany’s aging infrastructure and stimulating economic growth. This fund operates outside the traditional constraints of Germany’s “debt brake,” a constitutional rule that previously limited new government borrowing to 0.35% of GDP. The reform also allows for increased borrowing by the federal states and exempts defence spending above 1% of GDP from debt restrictions, thereby freeing up additional fiscal resources for investment.

Last week, the government coalition agreed to borrow almost €500 billion to raise the defence budget to the new NATO target of 3.5% of GDP by 2029, and to borrow almost €300 billion for infrastructure over the same period.

This fiscal expansion should boost domestic demand for many years and more than compensate for weaker external demand. Fixed investment in machinery and equipment, as well as in construction, are likely to benefit from this fiscal impulse.

The infrastructure bill is expected to have positive spillover effects across the European Union. Improved transport links, increased demand for goods and services and a more competitive German economy could strengthen the EU’s overall economic resilience. Furthermore, the focus on energy transition and digitalization aligns with broader European climate and innovation goals.

Konecranes PLC (KCRA HE), one of our holdings in our international strategy, is well positioned to benefit from this massive infrastructure spend.

Konecranes is a global leader in material handling solutions, serving a broad range of customers across several industries. Its product portfolio lifts, handles and moves goods in a safer, more productive and sustainable way. The company reports under three business segments:

  • Industrial services: It provides maintenance services and spare parts for any kind of cranes and hoists. With presence in more than 23 countries, Konecranes has one of the most extensive maintenance coverages globally. This segment represents 36% of revenue but more than 56% of income.
  • Industrial equipment: It provides industrial cranes and hoists for a wide range of customers, including general manufacturing, logistics, distributors, construction and engineering, metals and transportation equipment. This segment represents 29% of revenue and 20% of income.
  • Port solutions: It provides heavy cranes, mobile equipment, software and services for the container handling industry. Konecranes remains the only western player with a broad end-to-end offering for port terminals. Most of the world’s automated container terminals run on Konecranes product. This segment represents 35% of revenue and 24% of income.

Konecranes is exposed to structural growth through increasing automation and digitalization in industry, where its smart lifting and IoT solutions are in high demand. The global rise in e-commerce and logistics boosts demand for its port and warehouse equipment. Sustainability trends drive customers to modernize with Konecranes’ energy-efficient and low-emission solutions. Additionally, infrastructure investment and industrial growth in emerging markets continue to expand its long-term customer base. We believe it is well-positioned to benefit from higher defence and infrastructure spending globally.

A further rise in China’s trade surplus over the past year has been accompanied by bumper growth of US dollar deposits in Hong Kong, suggesting that Chinese entities have been building a hedge against RMB depreciation – see chart 1.

Chart 1

Chart 1 showing China Trade Balance in Goods (12m sum, $ bn) & Hong Kong Customer Deposits in US$ (yoy change, $ bn)

US dollar deposits grew by $139 bn or 15.6% in the year to April to stand at $975 bn, equivalent to 4.5% of US M2. They have risen much more strongly than Hong Kong dollar deposits, now representing 92% of the value of the latter, up from 79% at end-2022.

Low inflation has allowed China to gain competitiveness without nominal depreciation, with the BIS real effective rate at a 13-year low – chart 2.

Chart 2

Chart 2 showing China Broad Effective Exchange Rate (BIS, 2020 = 100)

Is demand for US dollar balances starting to wane? The recent fall in Hong Kong rates is consistent with a switch into local dollars. The one-year Hong Kong / US rate differential is the most negative since 2005, before a sustained appreciation of the RMB – chart 3.

Chart 3

Chart 3 showing Hong Kong / US 1y Deposit Rates & USD/CNY

Chinese f/x settlement numbers, meanwhile, indicate that the authorities intervened to hold down the RMB for a second month in May. Upward pressure had been signalled by a forward premium on the offshore RMB, which has persisted in June – chart 4.

Chart 4

Chart 4 showing China Net F/x Settlement by Banks Adjusted for Forwards ($ bn) & Forward Premium / Discount on Offshore RMB (%)

The onshore spot rate has moved from the weak end to the middle of the PBoC’s trading band, with the central parity rate edging higher – chart 5.

Chart 5

Chart 5 showing USD/CNY & PBoC Central Parity Rate

Any signal from the Chinese authorities of acquiescence to an appreciating trend could quickly become self-fulfilling by encouraging a further unwind of hedges, including via a reduced US dollar share of Hong Kong deposits.

Chinese monetary trends suggest a continuation of lacklustre economic growth with negligible inflation.

Six-month momentum of narrow and broad money picked up strongly during H2 2024, raising hopes of a reflationary scenario. Growth rates, however, have fallen back since Q1, to around the middle of ranges in recent years – see chart 1.

Chart 1

Chart 1 showing China Nominal GDP* (% 2q) & Money / Social Financing* (% 6m) *Own Seasonal Adjustment

May activity numbers confirm an economic slowdown, with six-month growth of industrial output and fixed asset investment falling again, and home sales contracting at a faster pace. Retail sales were boosted by subsidy programmes and promotions, with payback likely – chart 2.

Chart 2

Chart 2 showing Chinese Activity Indicators* (% 6m) *Own Seasonal Adjustment

House prices haven’t stabilised. The three-month change in new house prices has stalled below zero, with that for existing homes becoming more negative – chart 3.

Chart 3

Chart 3 showing China House Prices

Monetary developments don’t yet warrant pessimism. Six-month broad money momentum remains respectable, at 4.0% – 8.2% annualised – in May. This could be consistent with nominal GDP growth of c.6.5% pa, based on a long-run trend rise of 1.75% pa in the money to GDP ratio.

Narrow money momentum has weakened more sharply but the sectoral breakdown is reassuring, showing stable growth of household and enterprise money, with the aggregate slowdown due to a fall in demand deposits of government-related bodies – chart 4.

Chart 4

Chart 4 showing China New M1 Components (% 6m)

This fall is unlikely to be a leading indicator of reduced spending by these bodies, particularly as their overall deposit growth – i.e. including time as well demand deposits – has remained stable.

The money numbers, moreover, exclude fiscal (i.e. central government) deposits, six-month growth of which has picked up since Q1. Demand deposits of government-related bodies could recover as funds are transferred to finance spending projects.

Colorful alleys and streets in Guanajuato city, Mexico.

We have written extensively in recent months on how monetary and currency signals may be hinting that we are on the cusp of a “virtuous circle” for performance in EM equities. For any who missed it, a few recent pieces below:

Implications of Asian currency tremors

‘Beautiful’ tariffs and the end of exceptionalism

Are emerging markets on the cusp of a ‘virtuous circle’?

This is the most bullish we have been on the outlook for emerging market equities in over a decade.

Recent momentum has been positive, with MSCI EM up 9% to the end of May, part of a broader upswing in markets outside of the United States.

MSCI Price Indices
USD Terms, 31 December 2024 = 100
Line graph showing MSCI price indices from December 31, 2024.
Source: LSEG Datastream

Macquarie Capital investment strategist Viktor Shvets wrote earlier this month that, in May, EM excluding China recorded the largest net inflow since December 2023. India ($2.3 billion), Taiwan ($7.6 billion) and Brazil ($2 billion) received the largest flows, helping to buck a trend of selling through 2024 and early 2025.

EM ex-China Net Foreign Flows (US$ bn) – strong flow reversal
Line graph showing the net flows of emerging markets excluding China.
Source: Bloomberg; Macquarie Global Strategy (May 2025)

Persistent negative outflows over the past decade from EM into the United States have driven what by many measures is an unprecedented valuation gap.

US relative to the rest of the world forward PE and dividend yield
Line graph showing the US relative to the rest of the words forward PE and dividend yield.
Source: CLSA (April 2025)

Some premium is no doubt deserved given stronger US growth versus the rest of the world post-GFC, along with a better environment for capital and innovation. However, such extreme valuations imply lofty relative future growth expectations and leave US equities vulnerable to negative catalysts.

As John Authers wrote in his Points of Return column for Bloomberg:

Ultimately, EMs benefit most from the decline of US exceptionalism, giving central banks room to cut rates, as noted by Points of Return, and letting fiscal authorities spend without worrying about tanking the currency.

In a world where no one is exceptional, as Macquarie’s Shvets puts it, EMs are no longer penalized. At best, he calls the fall of American exceptionalism a process, not a collapse — creating conditions for a gradual rise in US risk premia while avoiding disorderly asset repricing. Investors will continue narrowing spreads between US and non-US assets, supporting EMU and Japan. Ditto for EMs, especially those with stronger secular drivers, with India, Korea, and Taiwan standouts.

Currency tailwind for EM

Line graph showing East Asia currency values versus the US dollar from December 31, 2024 to present.
Source: NS Partners & LSEG

Winners and losers

Despite being caught up in Liberation Day tariff chaos, MSCI China has returned 13.1% over the same period. Since 2023, China has been one of the strongest equity markets in the world. Despite the rally, valuations in many of the high-quality businesses that we like remain modest.

Two line graphs illustrating the 12-month forward PE for the MSCI China and MSCI China private sector.

Source: Jefferies (March 2025)

Having led the way for EM over the last few years, Indian stocks returned just 3% as sentiment moderates.

South Korea bounced 18.7% as domestic political risks eased following the impeachment of former president Yoon Suk Yeol following his failed attempt to impose martial law in December 2024. Former opposition leader Lee Jae-myung was elected to the presidency in early June and will immediately grapple with a contracting economy which has been hit further by US tariffs.

Taiwan has been a laggard, its market flat over the period which includes the DeepSeek shock that hit AI supply chain stocks on fears of lower demand for the hardware used to power the technology.

Stocks in Southeast Asia are yet to fire this year despite being beneficiaries of a falling USD and improving global liquidity. Perhaps investors remain fearful that these smaller, open trading economies risk getting trampled at the feet of the two fighting elephants in the United States and China. In a meeting with our CIO Ian Beattie earlier this year in London, Malaysian Prime Minister Anwar explained what a difficult position his country is in. China is Malaysia’s biggest trading partner and second largest investor, while the United States is its largest investor and second largest trading partner! If trade tensions between China and the United States cool, then these markets should soar.

Elsewhere, South African stocks have boomed, rising 24.4% powered in part by the country’s gold miners, along with a tentative improvement in politics under the ruling national ANC/DA coalition.

Brazil and Mexico have largely avoided president Trump’s ire and have rallied despite challenging political and economic backdrops, up 20.0% and 28.3% respectively.

Huge rallies in Greece (47.5%) and Poland (43.3%) have been driven by a powerful cocktail of geopolitical realignment between Europe and the United States and fiscal stimulus combined with cheap valuations. The most notable catalyst has been Germany’s dramatic policy shift under Chancellor Friedrich Merz. His government has proposed a sweeping €500 billion infrastructure investment plan and a major increase in defence spending. Crucially, the proposal includes exempting defence expenditures exceeding 1% of GDP from the constitutional “debt brake,” a move that would allow for significantly more fiscal flexibility.

Turkey bucked the trend (-15%), the market tanking on news President Erdogan jailed a political rival on trumped up corruption charges. The portfolio is zero-weight Turkey, and we are not tempted by ever cheaper valuations while Erdogan threatens the rule of law.

Finally, the GCC was a mixed bag with Saudi Arabia (-5.2%) hit by a weaker oil price, while the UAE (14.9%) was much stronger.

Caveat

Monetary data in the United States had been signalling a slowdown this summer, and this is now likely to be exacerbated by tariffs with a muted recovery in the latter half of 2025. The best-case scenario for EM at present would be contained US economic weakness, a slowdown in underlying inflation and a sustained pace of rate cuts. The story would be one of a late-cycle catch-up in EM performance, as illustrated by the table below.

Stockbuilding cycle & markets: EM, small caps, industrial commodities lagging – catch-up potential?
Chart illustrating the percentage changes of various indices over previous cycles.
Source: LSEG Datastream, own calculations / dating, as at 2 June 2025

We would expect EM to underperform in a hard-landing scenario, although this might be temporary given the lack of prior outperformance, followed by a strong early cycle phase. The chart from CLSA below shows prior phases of early cycle outperformance.

Emerging equities are an early cycle play: EM equity outperformance phases post US recessions
Line graph showing prior phases of early cycle performance.
Source: CLAS, MSCI, NBER

Mexico’s scorching rally belies deteriorating institutional quality

Ducking US tariffs and in prime position to benefit from US friendshoring, Mexico has been one of the top performing emerging markets this year. Strong stock picking in our portfolio allowed us to keep up despite an underweight to the country. However, we have used the rally as an opportunity to take profits and increase our underweight on a view that investors underestimate the impact of recent judicial elections.

In June last year we flagged the potential for Morena’s dominance in congressional and presidential elections to expose investors to rising institutional risks – Political risks in EM spike as Indian, South African and Mexican elections surprise:

Crucially for investors, AMLO and Morena are pursuing policies that could threaten Mexico’s institutions. Institutional quality is a key factor in determining whether a country moves up the economic development ladder. …

Investors fear that a strengthened mandate will allow Sheinbaum (or even an outgoing AMLO) to undermine judicial independence,and pursue plans to eliminate autonomous government agencies overseeing telecoms, energy and access to information, as well as weaken electoral supervisory bodies.

Morena under president Sheinbaum pushed ahead with an unprecedented judicial overhaul, with Mexican citizens voting in early June to elect judges including for the Supreme Court. As reported by Bloomberg on the 2nd of June – Mexico Judicial Election Sees 13% Turnout in Historic Vote:

The controversial election asked voters to pick judges among several thousand hopefuls which marked a first of its kind experiment for a large democracy. The judicial overhaul could give Sheinbaum broad influence over a revamped judiciary, the only branch of government the leftist Morena party does not control.

Critics of the process argue that this will undermine the rule of law by injecting more politics into legal and constitutional disputes.

Only 13% of registered voters turned out to participate, tasked with choosing between thousands of candidates, while accounting for specialties while selecting an equal number of men and women.

Politicising the selection of the judicial officers compromises Mexico’s separation of powers between the executive, congress and judiciary. This is a step backward as it undermines the institutional pluralism within the country’s system of government, where different power centres provide checks and balances and ways for the system to self-correct.

Regressive judicial reform coupled with a fragile economy hit by tariff uncertainty, falling remittances from a deteriorating US labour market and deportation fears is the basis for added caution.

Risks are to the downside for Mexico’s industrial production in 2025
Chart comparing current performance of various sectors to their performance last year.
Source: GBM (June 2025)

Exposure to Mexico in our portfolio is now c. 1% versus c. 2% for the benchmark.

Given the direction of travel in macro risk, we will debate whether to downgrade our country rating for Mexico further in the coming weeks. We are always seeking competition for capital in the portfolio, and in LatAm we are seeing interesting opportunities emerge in places like Argentina, Peru and Brazil, all competing for risk budget.