Dear Clients and Colleagues:

As the world transitions to green energy over the next 30 years, China must find short-term alternatives to their coal thermal plant problem, which represents 18% of total global carbon dioxide (CO2) emissions. 1

While it may seem like a contrary solution, China sees gas-fired power as the most realistic transitory solution until greener and grid friendly alternatives take scale. Gas has lower emissions than coal (50% less, oil is 25% less) and gas is more flexible than solar, wind, and even pumped-storage hydropower. It seems that China wants to import natural gas as fast as pipeline and LNG infrastructure is built. China’s pipeline gas volume surged 154.2% in 2021, to 7.54 million metric tons (mt). Natural gas imports (LNG) from Russia rose 50.5% year-over-year in 2021.2 Meanwhile, China LNG imports from the United States (U.S.) saw the biggest year-over-year jump, rising 187.4% to 9.21 million mt in 2021.3 

According to GlobalData, LNG liquefaction capacity is expected to grow by 70% over the next four years.3 China will add as much as 21.5 million mt/year of LNG receiving capacity in 2022, this from more than the 14 million mt/year added in 2021 for a total import capacity of 127 mt/year in 2022.1 Japan pioeneered LNG 60 years ago and recently fell in second place in terms of activity with 75 mt/year of LNG imports.4

Although the Chinese LNG import growth only absorbes world gas production by less than 1%, it is enough to pressure pricing upwards, especially since Europe and other regions try to curb thermal coal as well. Supply side dynamics are not helping either, as world rig counts are 45% lower than in 2015.5 Why so few? Oil and gas companies are shuffling with higher exploration costs, regulations and low labor availability.

Coming back to Japan, the country has low internal energy resources and imports 90% of its energy requirements. An important part of the country’s electrification is fuelled with LNG imports. Japan has the largest LNG capacity with 227 mt/year.4 As part of its CO2 emission targets, the country is trending towards a hydrogen strategy fuelled by renewables while reducing its LNG imports and nuclear power.

Iwatani (8088:JT)

Global Alpha owns Iwatani, the largest provider of LPG liquified propane gas, from importing to stove tanks. Iwatani provides an essential service throughout Japan, a country with very low penetration of utility style gas piping to the house. Although Japan’s LNG imports for electrification will decline, LPG will continue to be a key part of Japanese culture for cooking and heating especially in rural settings. Iwatani is also Japan’s only fully integrated supplier of hydrogen, with a nationwide network, including manufacturing, transportation, storage, supply, and security. It had 53 hydrogen stations in Japan as of 2021. Plans are to add 270 by 2030.

With plans to start exports by 2025, the west coast of Canada is set to benefit from the Asian LNG expansion. The energy shipped from Canada over to Asia is expected to offset up to 90 million tonnes of CO2 emissions in a single year. This is equivalent to shutting down 40 to 60 coal fired plants in China.7

ARC Resources (ARX:TSE)

Global Alpha owns ARC Resources, a Canadian energy company with operations focused in the Montney Resource Play in Alberta and northeast British Columbia. The company is best positioned with its gas assets to supply LNG requirements for Asian LNG exports. ARX is an industry leaders in terms of ESG with many initiatives regarding gas flaring and CO2 carbon capture.

Clean Energy Fuels (CLNE:US)

North American natural gas usage is also expected to increase in renewable growth as it is mixed with captured methane producing negative CO2 emission. For this Global Alpha owns Clean Energy Fuels, the largest network of retail natural gas distribution in the country.

China’s need for energy to fuel cars and electrify houses (and give them some benefit, to reduce thermal coal) has forced them to shut down many internally produced commodities that demand  high energy consumptions (as well as high CO2 emission) notably aluminium and copper smelters. China still needs these commodities and has reverted to the global trade market. If we add the change in habits brought on by COVID-19 that supported a rush for hard goods during the pandemic, this is the consequence.
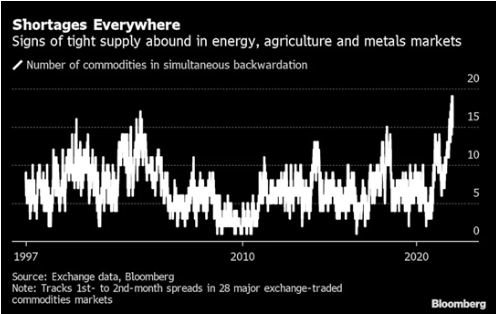
With a high energy production input, shipping aluminum is basically shipping energy. 

Alumina (AWC:AU)

Global Alpha owns Australia’s Alumina, which owns 40% of the world’s largest alumina business, Alcoa World Alumina and Chemicals (AWAC), the recognized industry leader. Precursor to aluminum, the metal powder alumina is refined from bauxite. AWC owns alumina refineries, bauxite mines and aluminum refineries globally with a good concentration in Australia. Close to China, AWC Australia large operations present the lowest cost import option for China. As well, AWC sources all of its energy requirements from natural gas. AWC also has important ESG initiatives such as Mechanical Vapor Recompression (MVR) which turns waste vapor into steam.

If we consider the energy transition to renewables as a secular event, the trend has certainly affected commodity prices in addition to more typical demand and supply forces.

Have a nice week.

The Global Alpha team

1 https://www.statista.com/statistics/239093/co2-emissions-in-china/#:~:text=China%20released%2010.67%20billion%20metric,of%20countries%20where%20emissions%20increased

2 https://www.spglobal.com/platts/en/market-insights/latest-news/lng/012022-china-data-total-natural-gas-imports-rose-20-in-2021-on-strong-energy-demand

3 https://store.globaldata.com/report/global-capacity-and-capital-expenditure-outlook-for-lng-liquefaction-terminals-to-2025-north-america-dominates-global-capacity-additions-and-capex-spending/

4 https://www.statista.com/statistics/1285639/japan-share-lng-in-energy-production/

5 https://rigcount.bakerhughes.com/intl-rig-count

6 https://world-nuclear.org/information-library/country-profiles/countries-g-n/japan-nuclear-power.aspx

7 https://biv.com/article/2022/01/lng-canada-project-construction-kicking-high-gear

This report is provided solely for informational purposes and nothing in this document constitutes an offer or a solicitation of an offer to purchase any security. This report has no regard to the specific investment objectives, financial situation or particular needs of any specific recipient and does not constitute a representation that any investment strategy is suitable or appropriate to a recipient’s individual circumstances. Global Alpha Capital Management Ltd. (Global Alpha) in no case directly or implicitly guarantees the future value of securities mentioned in this document. The opinions expressed herein are based on Global Alpha’s analysis as at the date of this report, and any opinions, projections or estimates may be changed without notice. Global Alpha, its affiliates, directors, officers and employees may sell or hold a position in securities of a company(ies) mentioned herein. The particulars contained herein were obtained from sources, which Global Alpha believes to be reliable but Global Alpha makes no representation or warranty as to the completeness or accuracy of the information contained herein and accepts no responsibility or liability for loss or damage arising from the receipt or use of this document or its contents.

Source: MSCI. The MSCI information may only be used for your internal use, may not be reproduced or redisseminated in any form and may not be used as a basis for or a component of any financial instruments or products or indices. MSCI makes no express or implied warranties or implied warranties or representations and shall have no liability whatsoever with respect to any MSCI data contained herein. This report is not approved, reviewed or produced by MSCI.

Recent market weakness reflects an unfavourable monetary backdrop as well as negative geopolitical developments.

The monetarist view is that asset prices respond to imbalances between the supply of money and the demand to hold it. “Excess” money growth is associated with increased demand for financial assets and upward pressure on their prices, assuming no change in supply.

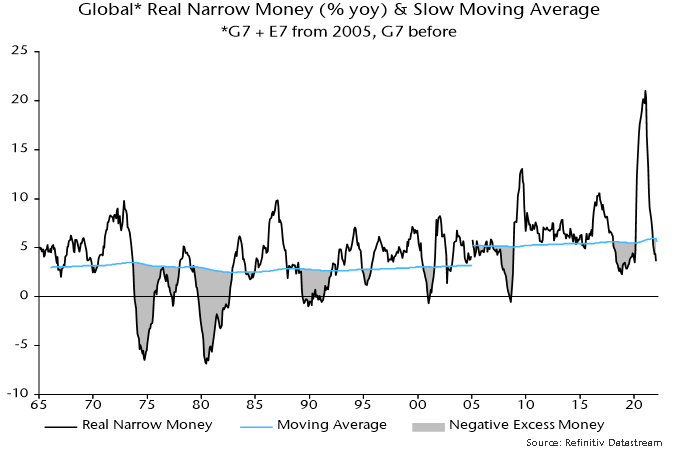
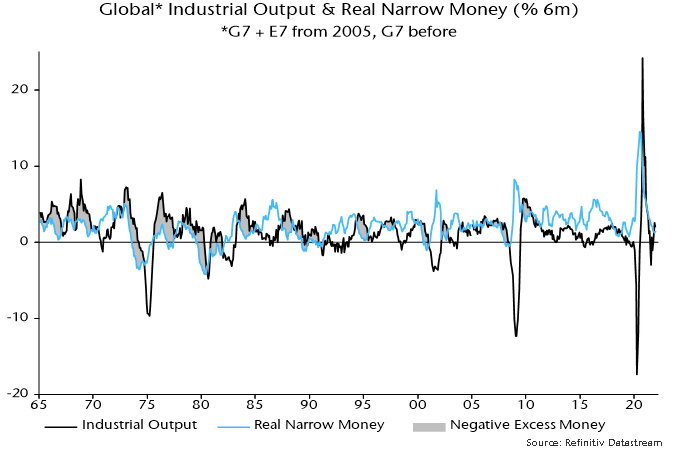
Excess money growth can’t be measured directly because the demand to hold money – based on current economic conditions and prices – is unobservable. Two proxy measures of global excess money are tracked here: the difference between six-month growth rates of real (i.e. CPI-deflated) narrow money and industrial output; and the deviation of 12-month real money growth from a slow moving average.

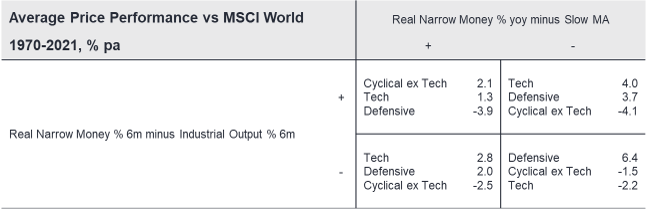
Historically, global equities outperformed cash significantly on average when both measures were positive but underperformed significantly when both were negative. Mixed signals were associated with a small return shortfall, i.e. no reward for assuming equity risk – see table 1.

Table 1

post in early January noted that the second measure had turned negative in October while the first appeared to have followed in November, based on partial data. This “double negative” signal was confirmed later in January.

A January estimate of global real narrow money is now available, along with a firm data point for December industrial output. Both excess money measures remain negative.

12-month growth of global real money is estimated to have fallen further below its moving average in January – chart 1. An early reconvergence seems unlikely – CPI inflation is probably peaking but a decline may be offset by a further slowdown in nominal money growth as large monthly increases a year ago drop out of the 12-month comparison.

Chart 1

Meanwhile, six-month real narrow money growth was little changed in January and below December industrial output growth – chart 2. Six-month output growth may stay at or above the December level through March: a temporary production catch-up is in progress as supply constraints ease, US output rose solidly in January and base effects are favourable (output fell between June and September 2021).

Chart 2

The excess money measures have also been correlated with sector relative performance historically, with double negative signals associated with strong outperformance of the defensive sectors basket (which includes energy) and underperformance of cyclicals, including tech (IT and communication services) – table 2.

Table 2

February 17, 2022

Dear Clients and Colleagues:

In October 2021, Mark Zuckerberg made headlines by announcing the rebranding of Facebook into Meta Platforms to focus on the metaverse. Zuckerberg also announced plans to invest more than US$10 billion on related hardware, apps and services. For the general public, it was likely the very first time they heard about the metaverse. However, it had already become the main next-big-thing idea for many tech companies worldwide, with many of them putting their money where their mouth is and investing mind-boggling amounts in the metaverse-related projects.

Despite the seeming novelty, the term metaverse was first coined in 1992 as an Internet of the future based on virtual reality in the science fiction novel, Snow Crash by Neal Stephenson. Launched in 1999, Cyworld, a South Korean social network, created a two-dimensional virtual world and implemented several elements of the metaverse, such as avatars and virtual spaces, and became one of the first companies to profit from the sale of digital items. In 2003, United States (U.S.)-based tech developer Linden Lab launched an online virtual world called Second Life, which is considered the prototype of a metaverse in the Western Hemisphere. Quite a few top-rated video games, such as Minecraft, Roblox and Fortnite have many elements of the metaverse. However, saying that any of them is the metaverse overstretches a stretch, similar to saying that Google is the Internet. However, they do give a bit of a taste of the metaverse. Hollywood also made notable steps into exploring the metaverse, with the Matrix and Ready Player One movies. 

Despite the current hype around the metaverse in media and tech business conversations, the term remains hard to define as there are many disagreements on what metaverse exactly is and how it should work. Will users have a single identity or avatar? Will there be a single operator of the metaverse? Will there be a single metaverse? If you have issues explaining what metaverse means to a three-year-old, you are not alone. Zuckerberg spent almost 80 minutes describing it during his Connect 2021 conference. You can check for yourself if he succeeded.¹ Although metaverse means different things to different people, most supporters will agree that it is essential for the Internet of the future. 

Matthew Ball, a venture capitalist and author of multiple high-quality pieces on metaverse, suggests that it is too early to give it a single intuitive definition, but still offers his best swing: “The metaverse is a massively scaled and interoperable network of real-time rendered three-dimensional virtual worlds, which can be experienced synchronously and persistently by an effectively unlimited number of users with an individual sense of presence, and with continuity of data, such as identity, history, entitlements, objects, communications, and payments”.² With a risk of oversimplification, we can think of the metaverse as a virtual space shared with myriad users integrating digital reality and the physical world by employing different aspects of technology. It is expected to provide fully immersive experiences, be accessible on any device and have an economy enabled by digital money and non-fungible tokens (NFT). 

In the not so distant future, users will be able to imitate or even migrate parts of their lives in virtual worlds, thanks to the efforts of numerous developers. Skeptics see a meager set of applications, primarily gaming and social networking. However, over time, metaverse can have a profound impact on society. Enterprise collaboration, fitness, education, healthcare, research and development, product engineering – this is a short list of activities that can reach a new level with the help of the metaverse. For instance, surgeons can perfect their mastery in the metaverse, and engineers can improve design prototyping while saving time and resources.

Even if the metaverse falls short of the fantastic pictures painted by science fiction authors, it is likely to generate substantial economic value, with some estimates coming in at trillions of dollars in revenue as a new immersive ecosystem and content platform. According to Gartner, the current buzz around the metaverse is expected to unwind and transition into numerous new business models so that by 2026, 30% of the companies worldwide will have products and services available on a metaverse, and 25% of the population globally will spend at least one hour per day for work, education, entertainment, social and other purposes on a metaverse.³ It would be very short-sighted to believe that the metaverse looks attractive only to tech nerds. For instance, Seoul⁴ and Shanghai⁵ are on the verge of making their foray into the metaverse. 

Anticipating solid demand from investors, several asset managers started offering ETFs tied to the metaverse. Although it is still too early to gauge which investments will pay off in the long run, companies should take the time to study, investigate, and plan for a metaverse to gain a competitive advantage on the Internet of the future. Even Zuckerberg, with a very ambitious vision for the metaverse, thinks it could take up to 10 years to become mainstream.

We believe the metaverse architecture is based on the following building blocks, which allude to the business models poised to benefit from new massive market opportunities:

  • Platform – providing a metaverse ecosystem.
  • Content – providing content suitable for the metaverse.
  • Infrastructure and software – providing technology and software related to the metaverse.
  • Hardware – providing whole or components of devices connected to the metaverse.

Although it is too early to validate the sustainability of the investment case of the metaverse, we believe it is one of the most intriguing emerging themes that we are carefully studying at Global Alpha. Several holdings of our Emerging Markets strategy started exploring metaverse-related opportunities long before this idea hit the news. We want to point out that none of those investment cases were built purely around the metaverse opportunities, as those companies have high-quality core operations and appealing investment theses. However, they provide an option to tackle a massive market if efforts turn out to be successful. 

AfreecaTV (067160 KS)

AfreecaTV, the most prominent South Korean live streaming platform transforming into a multi-vertical entertainment hub, with its strong content IP and fandom-like user following, is poised to capture the rising opportunities in the metaverse. On November 3, 2021, the company launched Afreeca Token Market, a digital NFT marketplace. The items available for trade include NFTs based on three-dimensional characters of popular AfreecaTV streamers, live streaming, and video-on-demand clips. On December 3, 2021, the first NFT bid for the avatar of a famous streamer, Chulgu, ended with a final bid of KRW 13.4 million, while other NFT bids for other popular streamer avatars were finalized in the range of KRW 3-7 million. On January 28, 2022, the company launched the open-beta version of its metaverse platform, FreeBlox. Although it is currently available only for PC in South Korea, AfreecaTV unveiled plans to deploy a mobile version soon and launch a global platform. Within the metaverse, we believe that AfreecaTV will explore various business models while users can interact with the streamers and participate in gaming, shopping, live broadcasting and other activities.

Elite Material (2383 TT)

Elite Material, based in Taiwan, is one of the global leading copper clad laminate (CCL) manufacturers. The metaverse will require massive network, storage and compute resources. According to Intel, a major data centre CPU manufacturer and client of Elite Material, the existing processing power is inadequate to support metaverse ambitions. Its senior vice president and head of Accelerated Computing Systems and Graphics Group, Raja Koduri, suggests that a thousand times increase in power might be needed over the current collective computing capacity.⁶ We believe that Elite Material is a major beneficiary of the secular growth of data centre capex given its ongoing market share wins within Intel and AMD server platforms and CCL content growth.

Ennoconn (6414 TT)

On January 4, 2022, Ennoconn, a leading industrial PC company in Taiwan specializing in embedded boards and systems, with applications in various vertical markets including point-of-sale (POS), automation, gaming, and networking, announced a new round of equity placement for Google. This partnership should enrich Ennoconn’s wearable devices capabilities for the industrial metaverse AR use cases. According to the International Data Corporation (IDC), AR and VR market is expected to grow at a 54% compound annual growth rate over 2020-2024.⁷

Have a nice week.

The Global Alpha team

1 https://www.youtube.com/watch?v=Uvufun6xer8

2 https://www.matthewball.vc/all/forwardtothemetaverseprimer

3 https://www.gartner.com/en/newsroom/press-releases/2022-02-07-gartner-predicts-25-percent-of-people-will-spend-at-least-one-hour-per-day-in-the-metaverse-by-2026

4 https://www.businessapac.com/seoul-government-venture-into-the-metaverse/

5 https://www.blockchain-council.org/news/shanghai-leans-towards-metaverse-in-its-progression-plan/

6 https://www.theverge.com/2021/12/15/22836401/intel-metaverse-computing-capability-cpu-gpu-algorithms

7 https://www.idc.com/getdoc.jsp?containerId=prUS47012020

This report is provided solely for informational purposes and nothing in this document constitutes an offer or a solicitation of an offer to purchase any security. This report has no regard to the specific investment objectives, financial situation or particular needs of any specific recipient and does not constitute a representation that any investment strategy is suitable or appropriate to a recipient’s individual circumstances. Global Alpha Capital Management Ltd. (Global Alpha) in no case directly or implicitly guarantees the future value of securities mentioned in this document. The opinions expressed herein are based on Global Alpha’s analysis as at the date of this report, and any opinions, projections or estimates may be changed without notice. Global Alpha, its affiliates, directors, officers and employees may sell or hold a position in securities of a company(ies) mentioned herein. The particulars contained herein were obtained from sources, which Global Alpha believes to be reliable but Global Alpha makes no representation or warranty as to the completeness or accuracy of the information contained herein and accepts no responsibility or liability for loss or damage arising from the receipt or use of this document or its contents.

Source: MSCI. The MSCI information may only be used for your internal use, may not be reproduced or redisseminated in any form and may not be used as a basis for or a component of any financial instruments or products or indices. MSCI makes no express or implied warranties or implied warranties or representations and shall have no liability whatsoever with respect to any MSCI data contained herein. This report is not approved, reviewed or produced by MSCI.
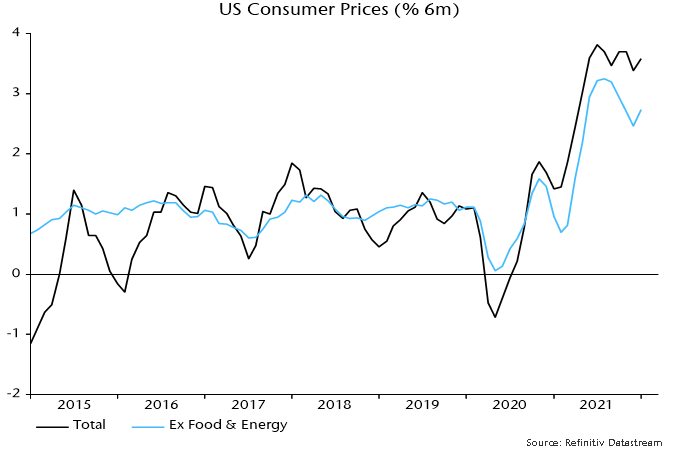
Year-on-year headline and core CPI inflation rates rose further in January, to 7.5% and 6.0% respectively, but six-month momentum remained below peaks reached in July-August – see chart 1.

Chart 1

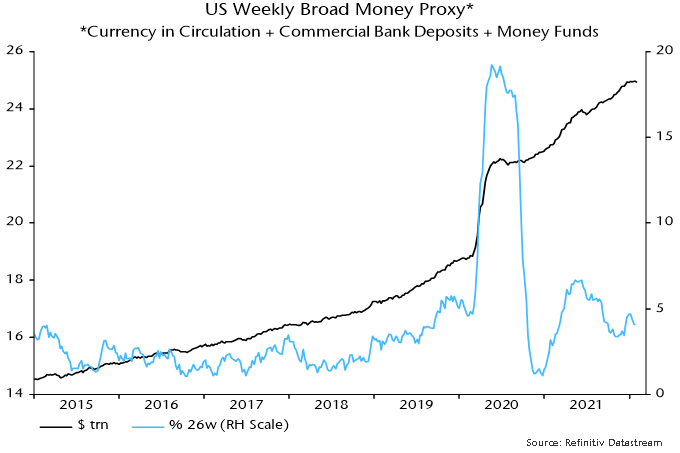
The fundamental cause of current high inflation is excessive monetary expansion in 2020-21 but six-month growth of broad money has returned to its pre-pandemic pace – chart 2. Weekly numbers have stagnated since December, when tapering started.

Chart 2

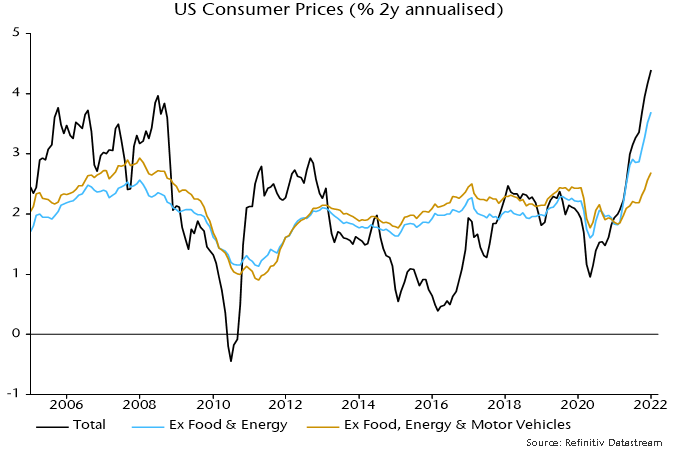
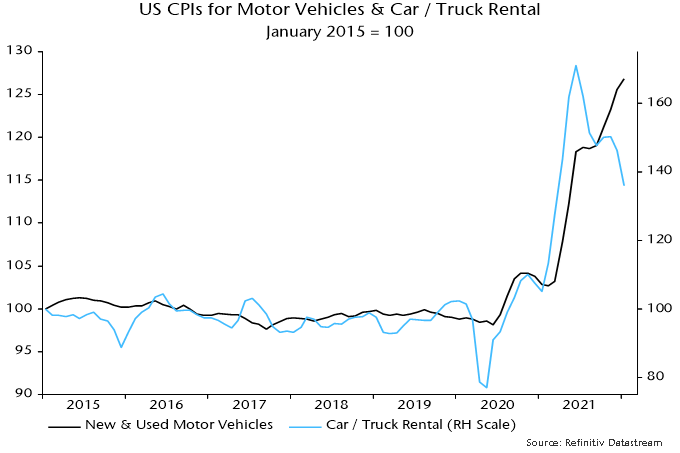
The year-on-year core rate of 6.0% overstates underlying inflation because of base effects and a one-off surge in vehicle prices. Year-on-year was only 1.4% in January 2021 so core prices have risen at an average rate of 3.7% pa over the last two years.

The CPI component for new and used vehicles soared by 28.1% between January 2020 and January 2022, boosting core CPI by 2.5 pp – vehicles had a 9.1% weight in the core basket in January 2020.

Stripping out vehicles, core CPI rose by “only” 2.7% pa in the two years to January. Two-year inflation on this measure reached a higher peak in the 2000s – chart 3.

Chart 3

Vehicle prices should correct as supply constraints ease and high fuel prices depress demand. A recent fall in car / truck rental rates may be a harbinger – chart 4.

Chart 4

Suppose that core CPI ex. vehicles rises by 3.5% over the coming 12 months, above its two-year rate of increase of 2.7% pa. If vehicle prices were to correct by 10% over this period, the conventional core rate would fall to 1.9% in January 2023.

Actual and imputed rents are widely expected to exert upward pressure on core inflation. However, year-on-year rental inflation would have to rise from the current 4.4% to 8% to offset a 10% fall in vehicle prices. Rental inflation hasn’t breached 6% since the mid 1980s.

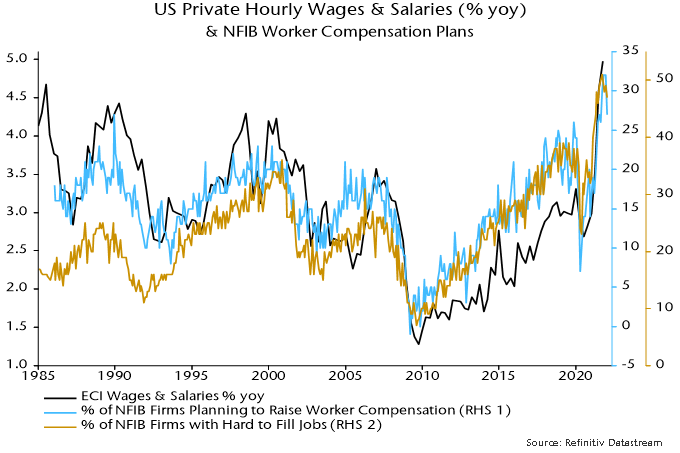
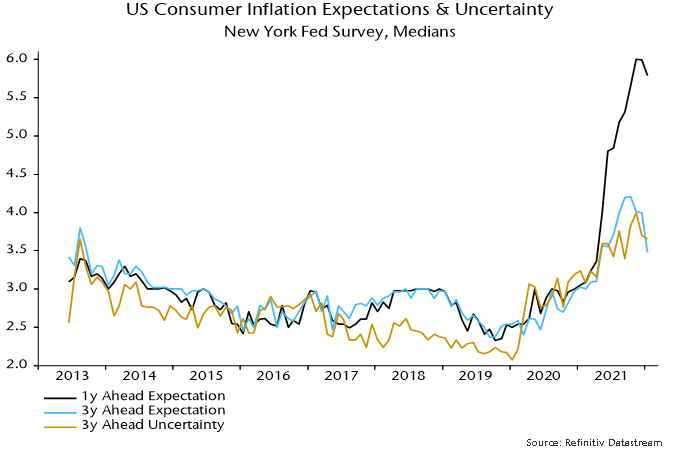
The Fed and other central banks are focused on backward-looking inflation indicators, including wage growth and (adaptive) inflation expectations, rather than money trends. Even these are showing signs of peaking: NFIB small firm worker compensation plans eased in January while New York Fed consumer expected inflation measures fell – charts 5 and 6.

Chart 5

Chart 6

Dear Clients and Colleagues:

Last week, the Lunar New Year was celebrated in Asia and beyond, and we entered the Year of the Tiger. Additionally, the 2022 Winter Olympics commenced in Beijing. As Asia appears more in headline news these days, you may wonder how it has been doing during the pandemic. The short answer is: resilient. Asia remains the fastest growing region in the world.

In 2020, global GDP contracted by 3.3% year-over-year, while Asia contracted by 1.5%. For 2021, the International Monetary Fund (IMF) forecasted that global GDP would grow 5.9%, while Asia would grow faster at 6.5%, including Hong Kong at 6.4% and Singapore at 6%. China grew 8.1% in 2021, and is expected to continue leading the Asian growth.

However, in the short term, Asia undoubtedly still faces many challenges.

  • China: Although China rebounded strongly last year, thanks to robust exports, there are signs of fading momentum due to weakening consumption and a property downturn. The zero-COVID policy may continue to cause lockdowns that hurt local economies. 
  • Slow COVID recovery: Although the vaccination rate is increasing in many Asian countries, the rise in new COVID cases, along with other supply chain issues, are causing production disruptions. Many countries are seeing an increase in cases following Lunar New Year celebrations. In Japan, where cases have reached record highs, the Prime Minister announced today the extension of its COVID-19 quasi-state of emergency in Tokyo and 12 prefectures; the restrictions are extended for three weeks, until March 6.
  • High debt burden: The Federal Reserve System’s (Fed) interest rate increase trajectory will add financing pressure. The debt in Asia has increased significantly in the past 15 years. Back in 2007, Asia accounted for about 27% of global debt. In 2021, it accounted for almost 40% of global debt.

Geopolitical tensions: The rise of China has complicated the old post-World War II international order by challenging the United States’ (U.S.) dominance in Asia. Tensions between the U.S. and China have been escalating for years, with Taiwan being the key issue. There is no sign of easing from both countries.

However, looking forward, the future of Asia’s growth remains bright.

  • High consumption growth: According to McKinsey, by 2030, Asian consumers are expected to account for 50% of global consumption growth, representing a $10 trillion opportunity, driven by rising incomes and changing consumption habits.
  • Closer intra-Asia ties: The Association of Southeast Asian Nations (ASEAN) is a priority in China’s foreign policy. Since 2009, China has been ASEAN’s largest trading partner. In 2020, ASEAN became China’s largest trade partner for the first time, overtaking the European Union (EU). Regarding Foreign Direct Investment, China is ASEAN’s fourth largest source, after the U.S., Japan, and the EU.
  • Accelerating digitization: Asia continues to vividly embrace the new digital world with Internet users far exceeding numbers in other regions. The trend is easily reflected by a high penetration of e-commerce, widespread e-payment systems, and active innovation carried out by companies.
  • Vigorous R&D investment: Asia is the largest R&D investing region in the world, with more than 44% of the global R&D share, mainly due to the escalating investment by China’s government, industries, and universities.
  • Renewable energy boom: Among the world’s installed renewable capacity, Asia has the largest share at 45%, vs. 25% in Europe, and 16% in North America, according to the International Energy Agency. Asia is also expected to account for 64% of new renewable capacity additions globally between 2019 and 2040.

At Global Alpha, Asia has been a very important market for our investments. It carries about 20% of the weight in the global small cap strategy, 45% in the international small cap strategy, and 75% in the emerging market small cap strategy.  

The valuation of Asian Small Caps is cheaper than peers in the U.S. and Europe. Based on the MSCI index data, as of January 31, 2022. Forward P/E of MSCI AC Asia Small Caps is at 12.8, vs. Europe Small Caps, at 15.8 and U.S. Small Caps, at 18.6. 

Our top three holdings in Asia are a good representation of diversification by region and sector, benefiting from the secular growth trends of consumption and healthcare.

L’Occitane (973 HK)

L’Occitane is a global retailer of skincare and beauty products made with natural and organic ingredients. Originally from France, it is a truly global player present in over 90 countries and 3,000 retail locations. Its key brands are L’Occitane en Provence, Elemis, and Limelight. Recently, it acquired Sol de Janeiro, an innovative leader in the global premium body care market, inspired by the Brazilian philosophy of self-love and joy. L’Occitane’s sales have surpassed the pre-pandemic level and last month, it raised full year revenue and profit guidance. We expect consistent growth, margin expansion, and synergies through sharing distribution channels and product development know-hows.  

Sega Sammy (6460 JP)

Sega Sammy is a Japanese entertainment company established through the merger of the game maker Sega and pachinko machine maker Sammy. It provides comprehensive products, including commercial video game machines, home video game software, and pachislot and pachinko machines. The company has many video game IPs. For example, Sonic the Hedgehog’s all time unit sales exceeded 1,380 million globally. Other popular titles include the Total War (37.8 million unit sales) and the Puyo Puyo series (35 million unit sales). There are a few exciting catalysts in 2022: the movie Sonic the Hedgehog 2 will be released on April 8, 2022; Sonic the Hedgehog animated series will be on Netflix; and a new title, Sonic Frontier, will be released in the winter of 2022.

Raffles Medical (RFMD SP)

Raffles Medical is a leading private healthcare group in Asia, with primary care, inpatient care, and specialist care. It was the first healthcare group in Asia to join the Mayo Clinic network back in 2015. The company has one hospital, and more than 60 clinics in Singapore, and three hospitals in China. Although the pandemic reduced regular patient visits, thanks to its excellent reputation, the company was chosen by the Singaporean government as the only healthcare provider to conduct COVID-19 screenings at the Changi Airport. It also provides COVID-19 PCR and serology testing and runs several vaccination centres in Singapore. We expect its China business to become the main growth driver going forward.

Have a nice week.

The Global Alpha team

World GDP 196 0-2022 | MacroTrends
IMF downgrades its growth forecast for Asia, says Covid still ‘ravaging’ the region (msn.com)
3 Coronavirus cases spike across Asia after Lunar New Year celebrations | LA Times
4 Japan to extend COVID-19 curbs for 13 regions by three weeks | Reuters
IMF says the Fed’s rate hikes will ‘definitely slow down Asia’s recovery’ (msn.com)
Meet your future Asian consumer | McKinsey
China and ASEAN: Flourishing at 30  | ORF (orfonline.org)
Global R&D investments unabated in spending growth – Research & Development World (rdworldonline.com)

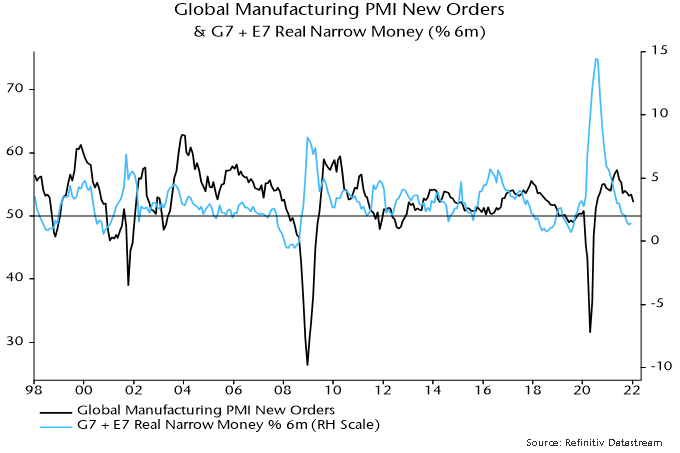
The global economic slowdown signalled by monetary trends appears to be playing out. The global manufacturing PMI new orders index fell to an 18-month low in January and is now 5.1 points below a May peak – see chart 1.

Chart 1

A decline in global six-month real narrow money growth into November suggests a further PMI fall into mid-year, at least, allowing for a typical 6-7 month lead. Real money growth recovered marginally in December but could weaken again in January – a provisional number will be available by early next week. Eurozone growth is likely to have turned negative based on last week’s CPI data, showing a further spike in six-month momentum.

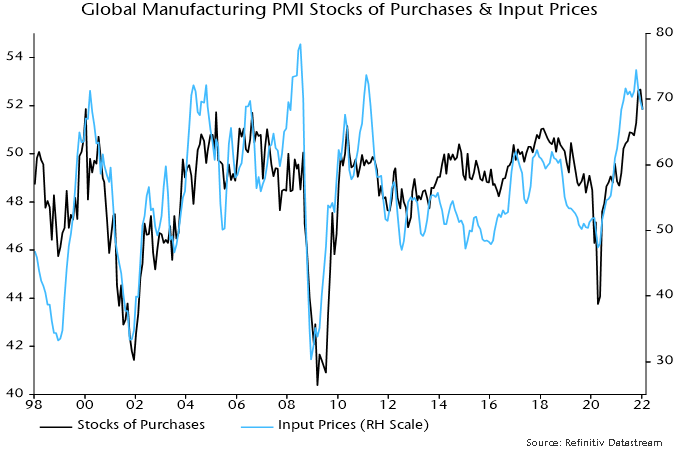
The manufacturing PMI stocks of purchases index reached a record level in December but fell back in January, consistent with the view here that the stockbuilding cycle has peaked and is about to enter a 12-18 month downswing phase. The coming inventory slowdown (and eventual liquidation) is likely, as usual, to be associated with a significant weakening of goods price pressures – chart 2.

Chart 2

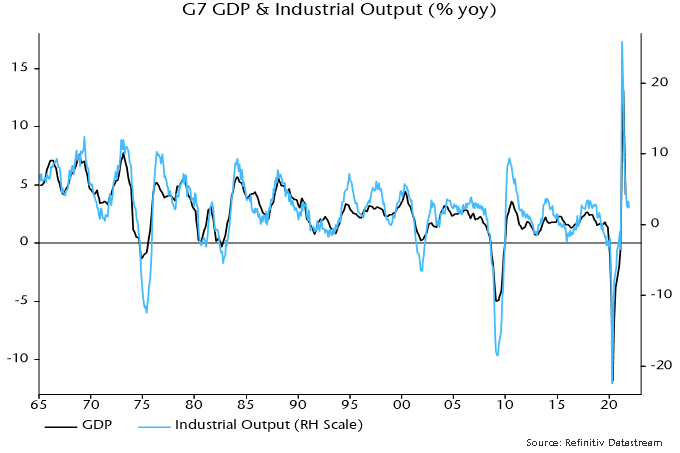
Optimists argue that services strength as pandemic disruption ends will outweigh any industrial slowdown. The (Keynesian) understanding here is that economic fluctuations are driven by goods spending and investment in particular. GDP growth swings mirror those in industrial output: the correlation coefficient of year-on-year changes was +0.89 over 1965-2020  – chart 3. There is no independent cycle in services demand. A services rebound as conditions normalise is likely to burn out swiftly if the industrial slowdown deepens.

Chart 3

The supposedly “blow-out” US jobs report has no implication for the assessment here, except to increase the likelihood of a Fed policy mistake. Labour market data are not forward-looking and the details of the report were much less impressive than the headlines.

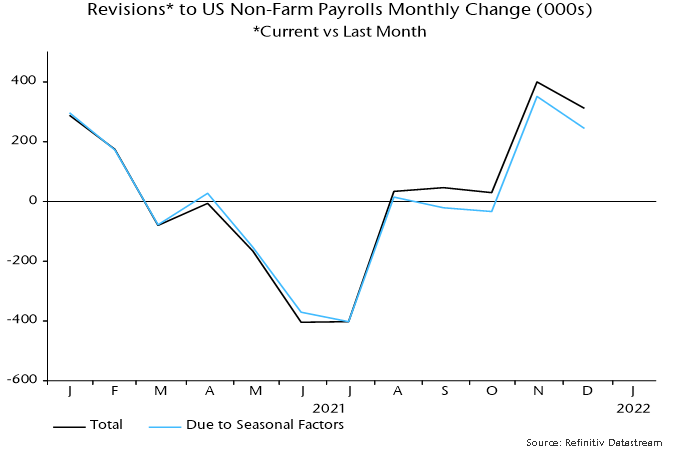
Huge upward revisions to November / December payrolls growth reflected new seasonal factors, with offsetting downgrades to June / July numbers – chart 4

Chart 4

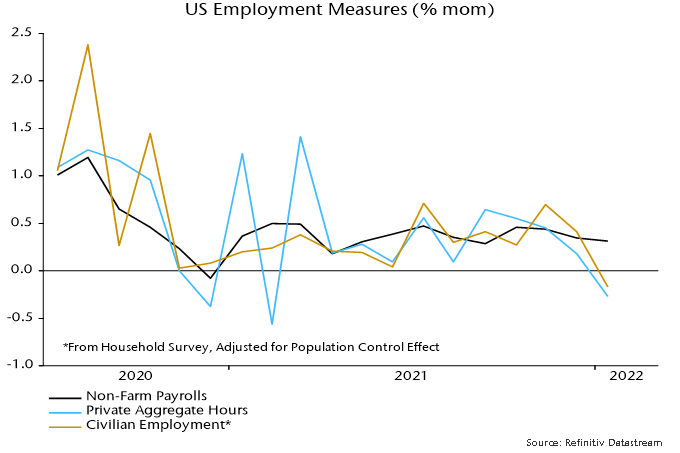
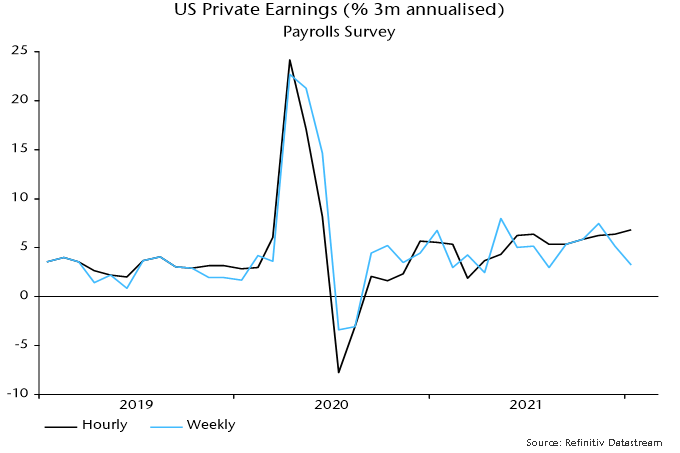
Payrolls rose solidly in January (with a boost from the new seasonal factor) but pandemic disruption showed up in falls in aggregate hours and the household survey employment measure – chart 5.

Chart 5

The drop in weekly hours may explain the larger-than-expected hourly earnings increase, assuming that lower-earners were more likely to have their hours cut. Weekly earnings growth remains range-bound – chart 6.

Chart 6

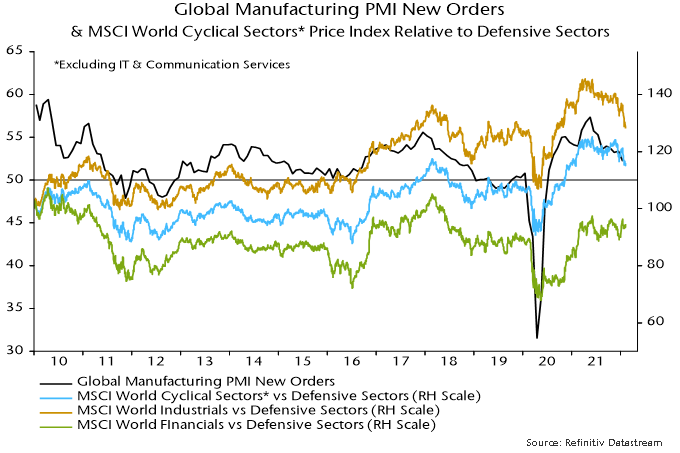
The PMI fall has been reflected in underperformance of MSCI-defined cyclical sectors versus defensive sectors but there is significant variation within the groupings, most notably the continued strength of financials – chart 7.

Chart 7

This resilience, of course, reflects rising bond yields and is likely to fade if waning economic momentum and easing price pressures pull these lower.

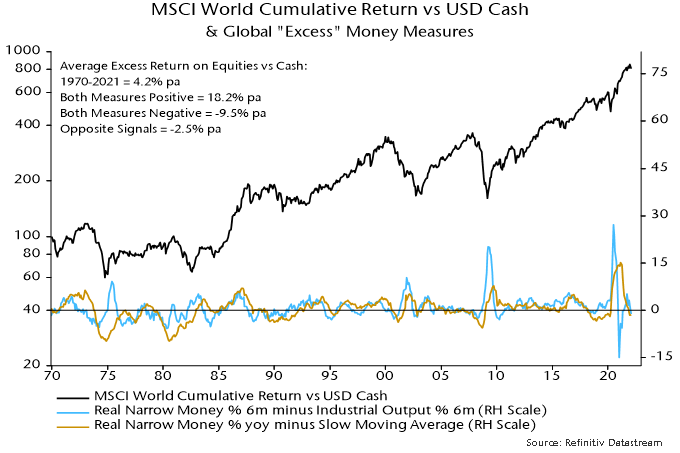
The view here remains that the rise in bond yields – like the outperformance of value versus growth – reflects a less favourable monetary backdrop for markets rather than a reprise of the “reflation trade”. Both “excess” money measures tracked here remain negative – chart 8.

Chart 8

Dear Clients and Colleagues:

The last time we wrote about renewable energy was in February 2021, right after the deep freeze in the United States (U.S.) that created havoc in energy markets, particularly in Texas. At the time, many criticized wind and solar as not being reliable sources of power, and over the last year, a lot has happened.

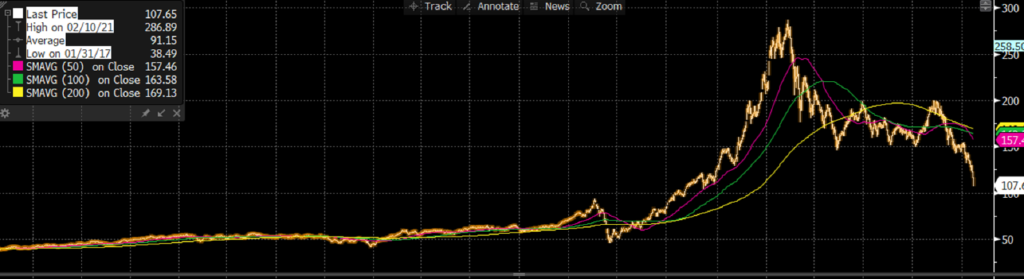
Clean energy stocks are down, and the U.S. has seen its first increase in coal-fired electricity generation since 2014. Additionally, the market is selling off, which creates some uncertainty; will we see a repeat of the clean tech bust that occurred more than a decade ago? In short, we do not think so, but rather believe the current correction is an opportunity.

The chart below shows the Wilderhill Clean Energy Index. It is a dollar-weighted index of publicly traded companies whose business stands to benefit from society’s move to cleaner energy and conservation. It is down 28% year-to-date and down over 65% from its peak in February 2021.

As you may know from reading our weekly commentaries, we believe in the present and future role of renewable energy. An important milestone occurred in 2013 when the world added 143 gigawatts (GW) of renewable electricity capacity, compared to 141 GW added from new plants that burn fossil fuels (including nuclear).

A new record for clean energy capacity was anticipated for 2021, as 290 GW was added, which is double what we saw in 2013. The International Energy Agency (IEA) notes, “By 2026, global energy renewable electricity capacity is forecast to rise more than 60% from 2020, to over 4,800 GW, equivalent to the current global power capacity of fossil fuels and nuclear combined.”

Solar power was the most important source of new capacity in 2021, with around 160 GW

In terms of growth for 2021-2026, China should add 1,200 GW of new capacity, four years earlier than its target of 2030. India will double its rate of growth for the period 2015-2020 and will have the highest rate of growth. The U.S. and Europe will also see higher growth rates than what we saw in the last five years.

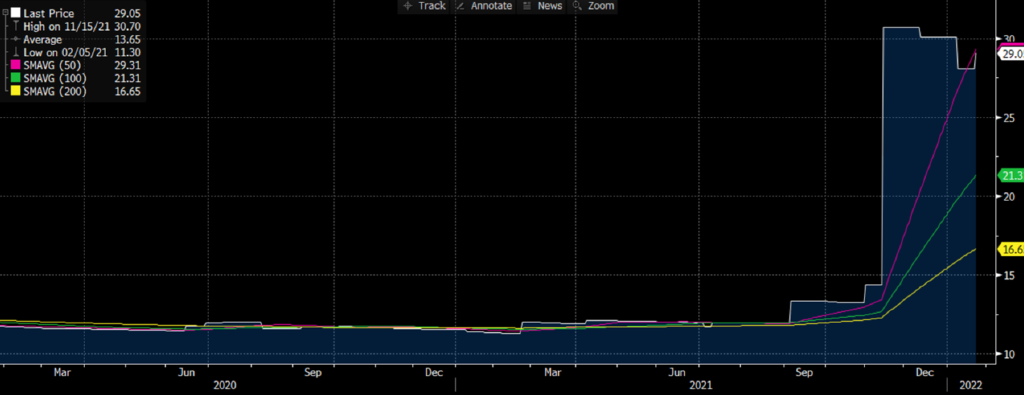
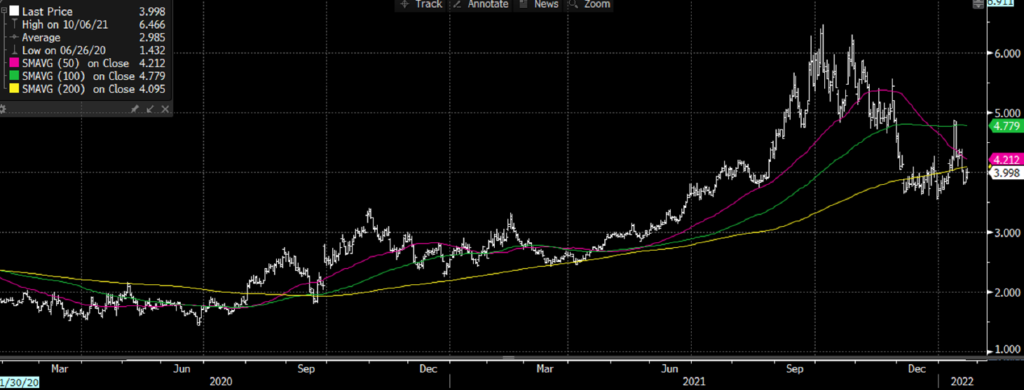
This is driven by ever-stronger government commitments. The rising cost of fossil fuels also makes clean energy more competitive. In fact, 2021 saw the first increase in coal-fired electricity generation in the U.S. since 2014 due to the strong demand and the high cost of natural gas.

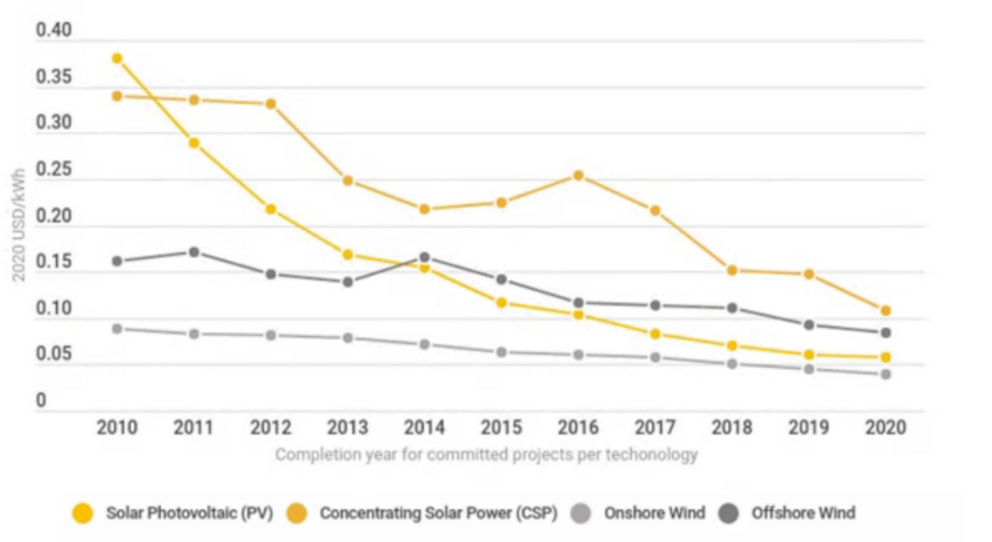
In terms of costs, despite rising raw material costs, renewables remain the most competitive options.

Renewables Downtrend Costs

Bloomberg Powder River Basin 8800 BTU Coal Spot Price FOB/Gillette Wyoming

New York Mercantile Exchange Natural Gas Future contract

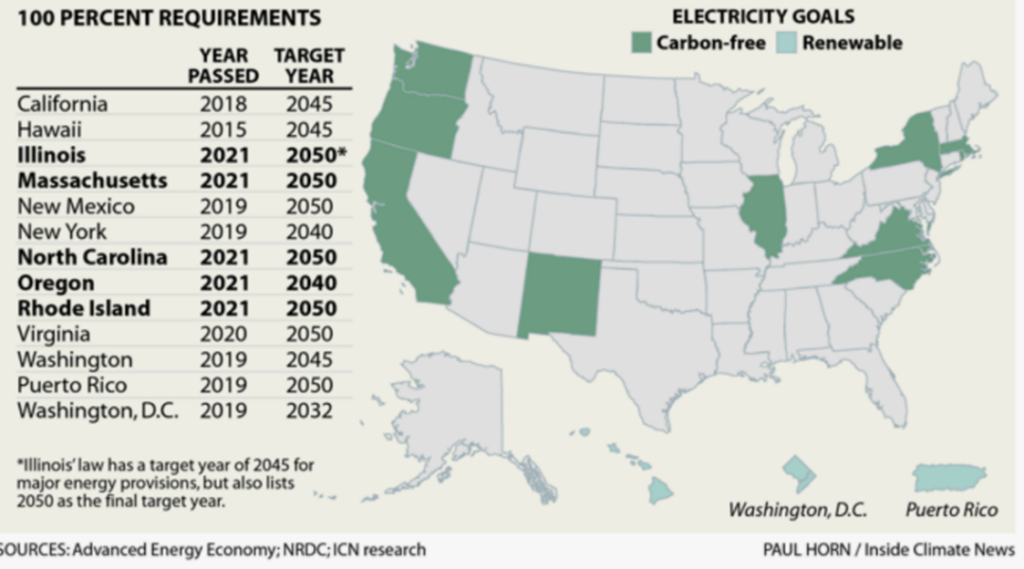
In last year’s commentary, we noted that at the end of 2020, 27 U.S. states had renewable energy targets, including eight that had a 100% clean energy target. In 2021, five more states were added to the 100% club.

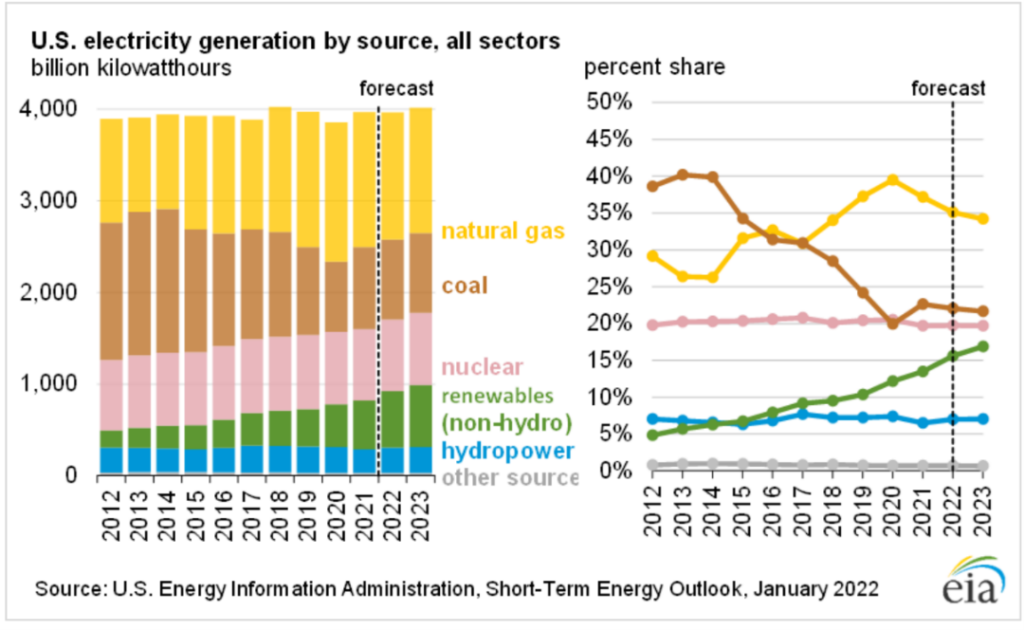
In the U.S., renewable energy sources increased from 19% to 20% for all of 2021, and should increase to about 24% in 2023.

We hear a lot about hydro, solar, and wind, and we have exposure through a few companies, such as Innergex (INE:CN), Schweiter (SWTQ:SW), and Landis+Gyr (LAND:SW). Less discussed are other forms of renewables, such as deep geothermal (note, we do not consider nuclear power to be a renewable source of energy).

Deep geothermal

Geothermal power is a key component of our energy future, as it is endless, green, and most importantly, base loaded to counterbalance solar. The caveat has been the scarcity of geothermal beds close to the earth’s surface. If only we could go deeper and longer. We have had the answer for a decade. Companies are now perfecting the adaptation of oil and gas fracking techniques to create deeper and longer geothermal looping systems to access the earth’s endless source of heat. Refer to last year’s commentary, published on May 6, 2021 for more details.

Ormat Technologies (ORA: US)

Since 2008, we have held Ormat Technologies (ORA US, ORA IT) in our portfolio, a world-leading geothermal energy company. Ormat Technologies was founded in Israel in 1965 to pursue its objective to further develop renewable energy. Active in the geothermal field since the early 1980s, the Integrated Two-Level Unit (ITLU) was a vital development in maximizing the thermodynamic efficiencies of lower-temperature resources. The patented ITLU design revolutionized the industry, and to this day, distinguishes Ormat from other companies. The company has been public since 2004, and has established its headquarters in Reno, Nevada. Further, Ormat is an energy producer with 1,015 megawatts (MW) of production globally (up from 933 MW last year). In addition to its geothermal expertise, Ormat is now a leading player in the field of energy storage and management with 83 MW of installed power. Its 2023 goals are to increase electricity production to about 1,265 MW and its energy storage to about 325 MW.

Gas capture

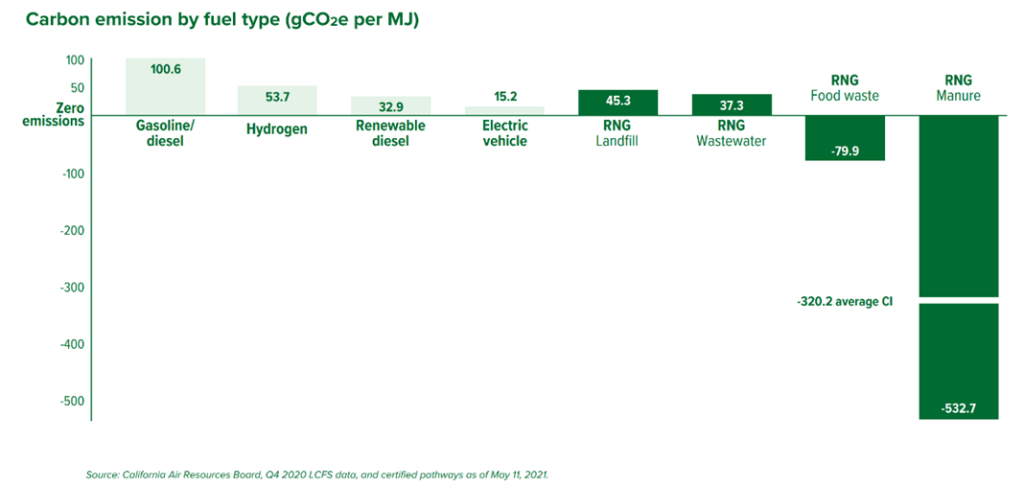
Methane is produced from decaying organics (i.e., food waste, livestock, and fracking). Methane negatively produces 25 times more heat capturing units in the atmosphere than carbon dioxide (CO2). Converting captured methane into a natural gas equivalent (renewable or redeem gas) and then using it for transportation is actually carbon emission negative if we account for manure emissions. A mix with regular natural gas provides a complete carbon neutral gas, offering the U.S. energy infrastructure a potential carbon neutral future. As such, the five largest U.S. utilities have committed to zero carbon emission by 2050, renewable natural gas being core to the strategy.

Clean Energy Fuels (CLNE: US)

Based out of Newport Beach, California, Clean Energy Fuels Corporation owns and operates more than 560 natural gas fuelling stations across the U.S. and Canada, with over 1,000 fleet customers like Amazon, UPS or Waste Management. Clean Energy is a leading Renewable Natural Gas player with about 65% market share.

Biffa (BIFF: LN)

Biffa plc is a waste management company headquartered in High Wycombe, United Kingdom (UK). It provides collection, landfill, recycling, and special waste services to local authorities, and industrial and commercial clients in the UK. Biffa is the second-largest UK-based waste-management company.

The company is a leading player in capturing organic gases and turning them into energy. Biffa operates over 90 MW of generation capacity. In addition, the company is building two energy from waste (EFW) facilities; the first one will be ready in 2023 and will produce 42 MW, enough to power around 80,000 homes. The company is also investing in solar power with a goal to produce up to 100 MW by the end of the decade.

Hydrogen

The greenest of all molecules certainly holds great promise. Fuel cell, coupled with an electric motor, is two to three times more efficient than an internal combustion engine running on gasoline. Fuel cell costs have decreased by 70% since 2006.

A few of our companies, other than Clean Energy Fuels, participate in the hydrogen economy include Iwatani (8088:JP) and Hexagon composites (HEX:NO). You can read more about these companies in our commentary on May 6, 2021.

Have a great weekend.                                                            

The Global Alpha team

The “monetarist” view is that central banks should conduct policy with the aim of stabilising growth of (broad) money at a non-inflationary rate.

Major central banks – the Fed and Bank of England in particular – trashed this principle in 2020-21, pursuing policies that caused money growth to explode, with the inflationary consequences still playing out.

The MPC’s decision in November 2020 to launch a further £150 bn of QE when annual broad money growth – as measured by non-financial M4* – was already at 12% was one of the worst in its 25-year history.

So what is the monetarist policy recommendation now?

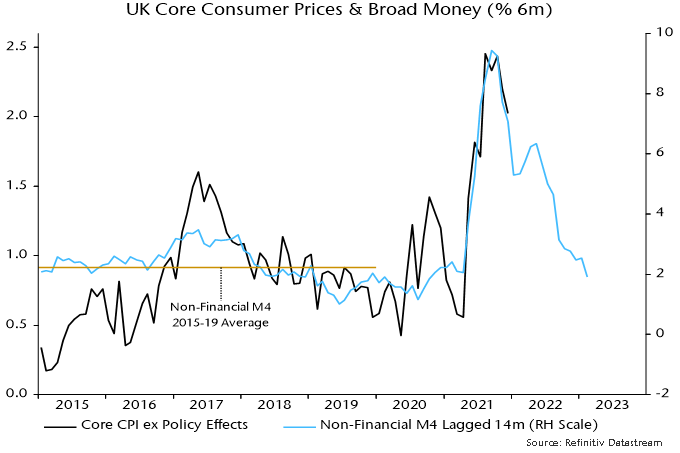
In the UK, it is to do nothing. Broad money momentum slowed sharply during 2021, with non-financial M4 rising by 1.9% or 3.9% at an annualised rate in the six months to December. This is close to the average in the five years preceding the pandemic and, if sustained, would be consistent with core CPI inflation returning to around target over the medium term – see chart 1.

Chart 1

The H2 broad money slowdown occurred despite QE continuing until November. Monthly growth of non-financial M4 fell to just 0.1% in December.

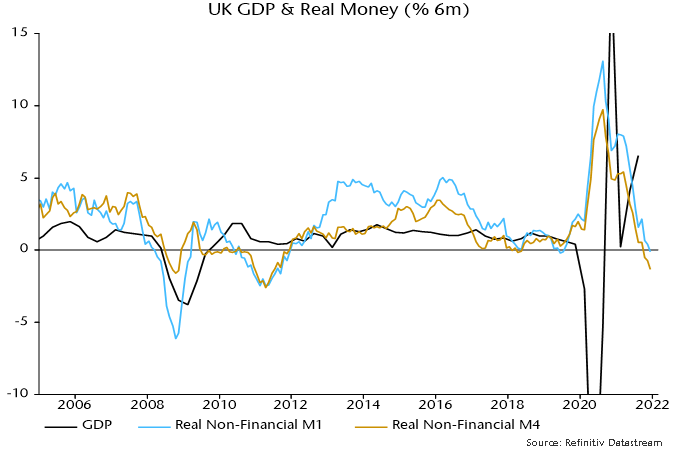
The combination of high inflation due to 2020-21 policy mistakes and the recent monetary slowdown has resulted in a contraction of real money balances, suggesting already-weak economic prospects – chart 2. Policy tightening into such a contraction risks pushing the economy into a recession.

Chart 2

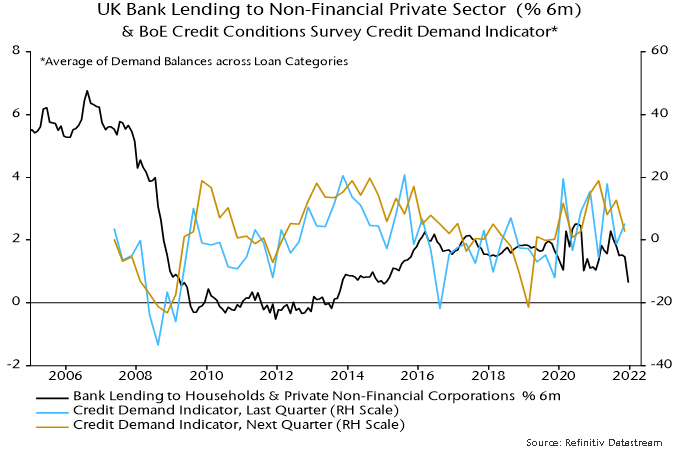
The MPC, on the view here, should wait for a rebound in money growth before raising rates and starting to reduce its gilts portfolio. Such a rebound is likely to depend on a pick-up in private sector credit growth, of which there is no sign in recent lending data or the Bank of England’s credit conditions survey – chart 3.

Chart 3

A consensus view is that the MPC needs to tighten to prevent high inflation becoming embedded in expectations. The best way of anchoring inflation expectations is to maintain low, stable money growth.

Another argument is that a period of weak money growth is warranted to offset excess expansion in 2020-21. Such attempts at monetary fine-tuning are hazardous and liable to create more volatility. The suspicion here is that “excess” money balances have already been largely absorbed by asset price / wealth gains (and an associated rise in the portfolio demand for money) and the current inflation surge.

*M4 holdings of the household sector and private non-financial corporations.

The Omicron variant of COVID-19 has caused some short-term weakness in the travel industry. The reintroduction of lockdown measures in some parts of the world, and the continuation of travel restrictions have once again penalized the industry. After a slightly tougher start to the year, we still expect the travel industry to begin its recovery by March or April.

One area of travel that surpassed the pre-pandemic era is the overall outdoor living and leisure products sector, and with it, recreational vehicles (RVs). Demand for RVs has remarkably increased over the past two years. Even before the pandemic, this market segment benefited from favourable structural changes.

We believe that future demand for RVs and outdoor products should remain strong, in part because of sustained consumer interest, as well as the fact that the profile among RV owners and outdoor enthusiasts has changed. The RV Industry Association (RVIA) noted that half of the 11.2 million households that own RVs are less than 55 year old, with the 18-34 years old category representing 22% of the market. The RVIA’s survey also showed that an additional 9.6 million households said they were considering buying an RV in the next five years, combined with over 10 million households that camped for the first time during 2020.

Thanks to the growing popularity of leisure vehicles among younger consumers and families, there has been an increased preference for local destinations, and more interest in eco-friendly vacations. We anticipate demand for outdoor products will remain strong.

Companies offering sustainable solutions designed for consumers interested in outdoor adventures and exploring nature more frequently, should do well in that context. Dometic, a company we initiated at the end of 2021 in our international portfolios, could benefit from that trend.

Dometic is a Swedish manufacturer of products within the climate, hygiene and sanitation, and food and beverages sectors. The products are used in recreational vehicles, pleasure boats, work boats, trucks, and premium cars. Some of Dometic’s products include: refrigerators, barbecues, heating solutions, air conditioning, blinds, power solutions, safety solutions, and much more.

Dometic operates 28 plants in nine countries, and 85% of products sold are manufactured in-house. The products are sold in close to 100 countries through Original Equipment Manufacturers (OEM), aftermarket, and distributors. The company generates 32% of its sales in Europe, 30% in the Americas, 9% in Asia, and 29% in global markets such as marine, residential, hospitality, mobile deliveries, coolers. During the last 12 months, the company reported sales of SEK 20,187 million (USD 2,229 million) and an EBIT of SEK 2,937 million (USD 324 million).

Market size

Growth strategy

  • Signing more customers and increasing its product portfolio by developing new products.
  • Entering new product categories or new applications.
  • Growing the distribution network.
  • Bolt-on acquisitions.

Strengths

  • Strong market leading position (number 1 or 2 in most markets).
  • Growing share in aftermarket channel, which carries a higher margin profile.
  • High barriers to entry due to high product requirements and tailor-made product dimension.
  • Strong relationships with clients.

Sales diversifications amongst RV, recreational boating, and commercial vehicles. 

The strategy’s performance in the year was shaped by a continuation of some of the themes that underpinned returns in 2020 and others which had a less favourable impact on historical returns but now appear to be turning the corner. In the former, portfolio companies that offer digital services (payments and software), healthcare, and consumer staples have been big winners in the pandemic with many likely to experience a step change in their long-term cash flow generation capacity. With digital services companies, we’ve maintained our focus on profitable companies that are delivering valuable solutions to their consumer and business clients through the deployment of technology that is scaleable and adapted to local market dynamics. In health and consumer staples, we gained more confidence in companies we owned prior to the pandemic as management excellence, market leadership, distribution prowess, and brand equity all played nicely into consumer habit changes that were brought about by the pandemic.

In the latter, the late reopening of economies in many Asian and African markets we invest in has meant that earnings have remained below potential for longer (compared to similar companies in more developed countries). As a result, those companies trade at deeply discounted valuations, presenting an opportunity to own them as they recover back to pre-pandemic levels of earnings. Naturally, those are businesses that sell products and services in an offline environment and typically require a high degree of mobility (alcoholic beverages, education, retail, and snacking are good examples). Management teams at these companies did not rest on their laurels and have adapted their businesses to be more agile, more digital and more available to their customers. We expect these initiatives to be generously rewarded as economies begin to reopen.

This mix of businesses complements the geographically diverse nature of our concentrated portfolio and mitigates the impact that a change in the market environment can have on returns. For example, as we enter a higher interest rate environment globally, valuations of our digital services companies might be capped but we expect that to be compensated by higher margins (i.e.: earnings growth) from our financial services companies. The portfolio’s investment in a wide range of market capitalisations and exposure to different ownership structures (owner-operator or multinational) adds to factor diversification and sensitivity to the ebbs and flows of liquidity. Within the portfolio, our job then is to ensure that capital is allocated to probabilistically optimise these factors, with the objective of producing a net positive outcome that is consistent with our and our investors’ return expectations. A less observable benefit of this approach is it allows us to see through periods of volatility which extends our holding period advantage in the market.

Outside the portfolio, our research is focused on identifying companies that can provide a superior risk-reward profile to existing investments or the excess cash position we might be holding at any one time. Our team’s knowledge of the markets and companies we invest in continues to compound and the opportunity set is getting deeper and more interesting for public market investors.

This year’s performance divergence between the strategy and emerging markets (a positive swing of ~13% versus the MSCI EM which was down ~5% in 2021) adds credence to the argument us and others have been making about looking beyond index-driven emerging market classifications when allocating capital outside core developed markets. We’ve put our money behind this thesis with a signification proportion of our Managing Partners’ capital invested in the strategy. We believe that a concentrated, geographically diverse, and benchmark agnostic approach is appropriate for investors looking to capture the growth in the next generation of emerging markets (i.e.: beyond the now “emerged” markets of China, Korea and Taiwan).

As the strategy wraps up its third year, we want to thank our clients, partners, and colleagues for their support and wish all a prosperous 2022.

Vergent Asset Management LLP


DISCLOSURES

  1. Unless otherwise stated, all data is at December 30, 2021 and stated in US dollars (US$). Source: Connor, Clark & Lunn Financial Group, Thomson Reuters Datastream.
  2. Performance history for the Vergent Emerging Opportunities Strategy is that of the Vergent Emerging Opportunities Composite. The Composite has an inception and creation date of August 2018.
  3. Net performance figures are stated after management fees, estimated performance fees, trading expenses and before operating expenses. Operating expenses include items such as custodial fees for pooled vehicles and would also include charges for valuation, audit, tax and legal expenses. Such additional operating expenses would reduce the actual returns experienced by investors. Past performance of the strategy is no guarantee of future performance; Future returns are not guaranteed and a loss of capital may occur. For illustrative purposes, performance fee of 20% on added value over the hurdle rate of 6% plus the management fee of 1.25% have been assumed. Actual management fees charged to a particular account may vary.
  4. There is no benchmark for the Vergent Emerging Opportunities Strategy because it has an absolute return objective
  5. Standard Deviation measures the dispersion of monthly returns since the inception of the strategy.

Benchmarks and financial indices are shown for illustrative purposes only, are not available for direct investment, are unmanaged, assume reinvestment of income, do not reflect the impact of any management or incentive fees and have limitations when used for comparison or other purposes because they may have different volatility or other material characteristics (such as number and types of instruments) than the Strategy. The Strategy’s investments are not restricted to the instruments comprising any one index and do not in all cases correspond to the investments reflected in such indices.

These materials (“Presentation”) are furnished by Vergent Asset Management (“Vergent”) on a confidential basis for informational and illustration purposes only. This Presentation is intended for the use of the recipient only and may not be reproduced or distributed to any other person, in whole or in part, without the prior written consent of Vergent. Certain information contained in this Presentation is based on information obtained from third-party sources that Vergent considers to be reliable. However, Vergent makes no representation as to, and accepts no responsibility for, the accuracy, fairness or completeness of the information contained herein. The information is as of the date indicated and reflects present intention only. This information may be subject to change at any time, and Vergent is under no obligation to provide you with any updates or amendments to this Presentation. This Presentation is not an offer to buy or sell, nor a solicitation of an offer to buy or sell any security or other financial instrument advised by Vergent. This Presentation does not contain certain material information about the strategy, including important risk disclosures. An investment in the strategy is not suitable for all investors, and before making an investment in the strategy, you should consult with your professional advisor(s) to determine whether an investment in the strategy is suitable for you in light of your investment objectives and financial situation. Vergent does not purport to be an advisor as to legal, taxation, accounting, financial or regulatory matters in any jurisdiction, and the recipient should independently evaluate and judge the matters referred to in this Presentation. Vergent Asset Management LLP is registered in England and Wales with its registered office address at 8th Floor, 1 Knightsbridge Green, London SW1X 7QA, United Kingdom (Companies House number OC418829) and is authorized and is an Exempt Reporting Adviser in the USA. It is regulated by the Financial Conduct Authority (FRN: 791909).

THIRD-PARTY DATA PROVIDERS

This report may contain information obtained from third parties including: Merrill Lynch, Pierce, Fenner & Smith Incorporated (BofAML), S&P Global Ratings, and MSCI. Source: Merrill Lynch, Pierce, Fenner & Smith Incorporated (BofAML), used with permission. BofAML permits use of the BofAML indices related data on an “As Is” basis, makes no warranties regarding same, does not guarantee the suitability, quality, accuracy, timeliness, and/or completeness of the BofAML indices or any data included in, related to, or derived therefrom, assumes no liability in connection with the use of the foregoing, and does not sponsor, endorse, or recommend CC&L Canada, or any of its products. This may contain information obtained from third parties, including ratings from credit ratings agencies such as S&P Global Ratings. Reproduction and distribution of third party content in any form is prohibited except with the prior written permission of the related third party. Third party content providers do not guarantee the accuracy, completeness, timeliness or availability of any information, including ratings, and are not responsible for any errors or omissions (negligent or otherwise), regardless of the cause, or for the results obtained from the use of such content. THIRD PARTY CONTENT PROVIDERS GIVE NO EXPRESS OR IMPLIED WARRANTIES, INCLUDING, BUT NOT LIMITED TO, ANY WARRANTIES OF MERCHANTABILITY OR FITNESS FOR A PARTICULAR PURPOSE OR USE. THIRD PARTY CONTENT PROVIDERS SHALL NOT BE LIABLE FOR ANY DIRECT, INDIRECT, INCIDENTAL, EXEMPLARY, COMPENSATORY, PUNITIVE, SPECIAL OR CONSEQUENTIAL DAMAGES, COSTS, EXPENSES, LEGAL FEES, OR LOSSES (INCLUDING LOST INCOME OR PROFITS AND OPPORTUNITY COSTS OR LOSSES CAUSED BY NEGLIGENCE) IN CONNECTION WITH ANY USE OF THEIR CONTENT, INCLUDING RATINGS. Credit ratings are statements of opinions and are not statements of fact or recommendations to purchase, hold or sell securities. They do not address the suitability of securities or the suitability of securities for investment purposes, and should not be relied on as investment advice.

Source: MSCI. The MSCI information may only be used for your internal use, may not be reproduced or re-disseminated in any form and may not be used as a basis for or a component of any financial instruments or products or indices. MSCI makes no express or implied warranties or implied warranties or representations and shall have no liability whatsoever with respect to any MSCI data obtained herein. This report is not approved, reviewed or produced by MSCI.