UK monetary statistics for September were heavily distorted by cash-raising by LDI funds to meet collateral requirements for derivative contracts. 

The headline M4ex broad money aggregate surged by £91 billion, equivalent to 2.7% after seasonal adjustment, between end-August and end-September. Money holdings of non-bank financial corporations* accounted for £71 billion of this increase. 

The long-standing practice here has been to focus on non-financial monetary aggregates, where available, because movements in financial sector money holdings can be erratic and usually have little bearing on near-term economic prospects. 

Non-financial M4, encompassing money holdings of households and private non-financial businesses, rose by £21 billion, or a seasonally adjusted 0.3%, in September. Annual growth eased to 3.5%, with the aggregate expanding at an annualised rate of 3.2% in the latest three months – see chart 1. 

Chart 1
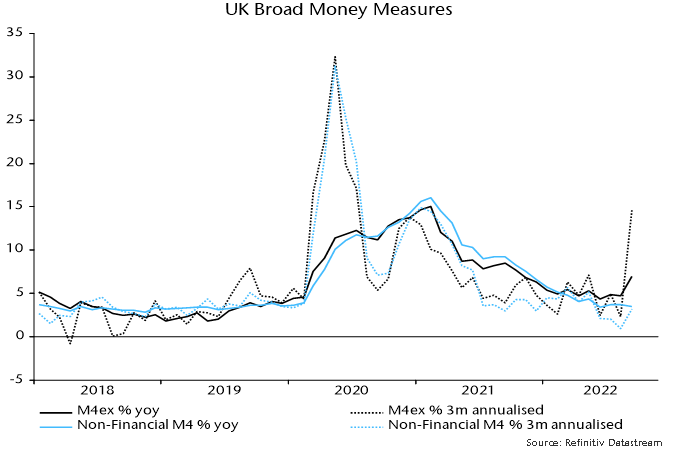
Chart 1 showing UK Broad Money Measures

The Bank publishes an industrial breakdown of sterling deposits at commercial banks. The LDI cash-raising is reflected in large monthly increases in deposits of insurance companies, pension funds, fund managers and securities dealers (LDI funds posted margin to dealers, with the dealers placing the funds with banks). This group added a combined £39 billion to sterling deposits in September. 

However, the rise in aggregate deposits of non-financial corporations, according to this table (C1.1), was £46 billion in September – far short of the £71 billion increase in their total M4 holdings (A2.2.3). This represents a record divergence – chart 2. 

Chart 2
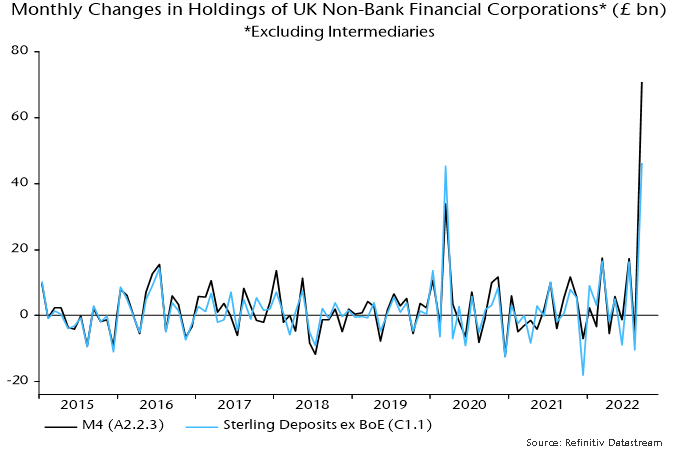
Chart 2 showing Monthly Changes in Holdings of UK Non-Bank Financial Corporations* (£ bn) *Excluding Intermediaries

The “missing” funds show up on the Bank’s balance sheet: private sector sterling deposits held at the Bank jumped by £28 billion in September (B2.2.1), also a record movement – chart 3. 

Chart 3
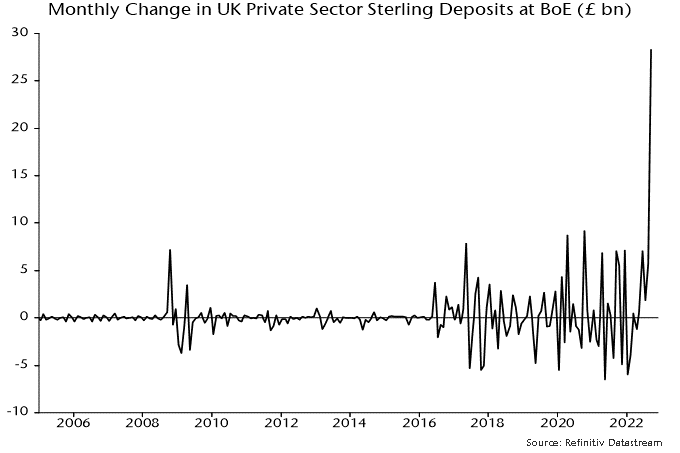
Chart 3 showing Monthly Change in UK Private Sector Sterling Deposits at BoE (£ bn)

Securities dealers and clearing houses have accounts at the Bank, which they appear to have used to deposit a portion of the margin cash received from LDI funds. 

Note that this increase in deposits is not attributable to the Bank’s gilt-buying operation, which started on 28 September: the Bank’s holdings of public sector securities fell by £5 billion during September. 

Sterling cash-raising related to the LDI crisis may have totalled about £67 billion – the sum of the £39 billion increase in commercial bank deposits of insurance companies, pension funds, fund managers and dealers and the £28 billion placed at the Bank. 

LDI funds were also scrambling to raise foreign currency liquidity. The rise in foreign currency deposits of the same group of institutions rose by £25 billion in September. 

Not all the cash-raising represents sales of assets – LDI funds were also borrowing to meet margin requirements. Sterling bank lending to the same group rose by £16 billion in September, with foreign currency lending up by £18 billion. 

Was the Bank involved in facilitating the supply of liquidity to the funds, over and above its gilt-buying operation? It is unlikely to have played a direct role but banks may have borrowed from its discount window to onlend to LDI funds. 

This possibility is suggested by partial data on the Bank’s sterling liabilities and assets – it no longer publishes a full balance sheet on a timely basis. Identified sterling liabilities, including bank reserves and the sterling deposits referred to earlier, rose by £14 billion, while assets – including gilt holdings – fell by £6 billion. The implication is that unpublished items on the balance sheet resulted in the creation of £21 billion of identified sterling liabilities, with discount window lending a candidate explanation. 

*Excluding intermediaries such as central clearing counterparties.
Relatively speaking, the strategy’s returns for the quarter are respectable. While a single quarter of outperformance versus global and emerging market equities is by no means significant, there are observations that we deem significant in shaping the medium-term outlook for the strategy. Those are summarised below:

  • Investor positioning in frontier and emerging markets is light relative to mainstream emerging markets and developed equity markets. Given the non-core/off-benchmark nature of where we invest, outflows should generally have a less pronounced impact on performance.
  • The political risk premium in key portfolio countries has arguably declined in the last few months. Peaceful and orderly elections in the Philippines and Kenya resulted in business-friendly governments in both countries. Even in Kazakhstan, a country that experienced seismic political shifts earlier this year, there are reasons to be optimistic. President Tokayev continues to consolidate power domestically while masterfully navigating the country’s precarious foreign policy position by pivoting toward China and the West whilst maintaining deep-rooted historical ties with Russia. Tokayev’s call for a snap election reflects increased confidence in his ability to win and push through with policies that are on net positive for the economy
  • By process design, we invest in highly profitable businesses underpinned by sustainable competitive advantages and run by highly skilled and aligned managers. These characteristics are particularly valuable in the current market environment and are translating to market share gains for our companies at the expense of weakening competitors. Aligned ownership has and will continue to prove valuable in this environment. During the quarter, the CEO of a top ten portfolio company added to her already large stake through open market purchases. In October, another top ten portfolio company received a tender offer from its majority owners for part of the free float at over a 30% premium to the 30 day trading volume-weighted average price (VWAP).
  • In a rising rate environment, our portfolio companies experience a net positive carry as most hold more cash than debt. Where there is debt, it is mostly in local currency or otherwise matched with foreign currency income. Of the top ten companies in the portfolio (accounting for ~55% of assets), seven enjoy a net cash position
  • Our portfolio companies operate in sectors that are likely to outperform the general economy due to structural demand drivers underpinned by changing consumption habits and technological advancements. Nearly half the strategy’s assets are invested in consumer staples and information technology companies that we expect will prove more defensive in the next few quarters

The difficulty of investing in this environment is that visibility is particularly poor, and risks are apparent in every direction. Investors in such a market often exhibit paralysis or excessive risk aversion at a time when taking calculated risks can be very rewarding. We emphasise calculated because we believe there is a higher likelihood that markets will trade down rather than up in the next few months. Having experienced the global financial crisis, we understand how historical asset correlations can break down, markets can dislocate, and extreme volatility in one asset class or country can be a harbinger for significant volatility in other asset classes or countries. This is why we do not see the turmoil in British politics and the resulting gilt market volatility as isolated events but very much a result of a shift in global monetary and fiscal conditions that has a way to go. Of course, as Liz Truss has hopefully learned, reckless policy making will only exacerbate the negative impact of these shifts. That being said, we’ve made calculated additions to the portfolio and are well placed to take advantage of further volatility given the long term nature of the assets we manage and the dry powder we built up over the last 6 months.

An additional word on strategy is warranted in this environment: from a buy decision perspective, we are aware that valuations on certain high quality businesses on our watchlist have come down from “excessive” to “high” and that more than a few of those companies are still well-owned. We are making a conscious effort not to get tempted into those opportunities until we think the market has caught up with the economic realities and has adequately captured the meaningful earnings downgrades that are likely to come through in the next quarter.

It is also tempting to think that we are sitting on a portfolio of companies that is immune from further downside. However, our team is constantly looking for signals that we may have overstated our companies’ ability to generate cash flows (relative to the market’s expectations) or that there might be cracks appearing in the long-term thesis we’ve built when we invested in those businesses. This constant monitoring has and will continue to lead to downward position size adjustment and/or exits.  

We believe this environment is ripe for value creation through active engagement with management teams of portfolio companies and other like-minded shareholders in those companies. Our evolving sustainability framework and the research work we conduct in that area is proving to be extremely valuable in guiding our discussions with key stakeholders. We view our work on sustainability as an enabler for better investment decision making and have committed resources in that area to ensure we reinforce our investing edge. Finally, our values as an investment business should serve the strategy well in this environment. Focus, curiosity, humility, excellence, and alignment form the bedrock of our culture and drive our daily pursuit of differentiated value-added returns for our clients.

Vergent Asset Management LLP

Chinese money trends remain moderately favourable but the economy has been held back by covid disruption and now faces an export threat from global recession. Stocks, meanwhile, have been hit by a ramping up of the Biden administration’s war on Chinese tech along with President Xi’s take-over of economic policy-making, which investors have viewed as negative for longer-term growth prospects. “Excess” money has accumulated in the bond market and has the potential to flow into the economy and equities if the covid drag fades and policy-makers signal a continued commitment to private-led economic expansion. 

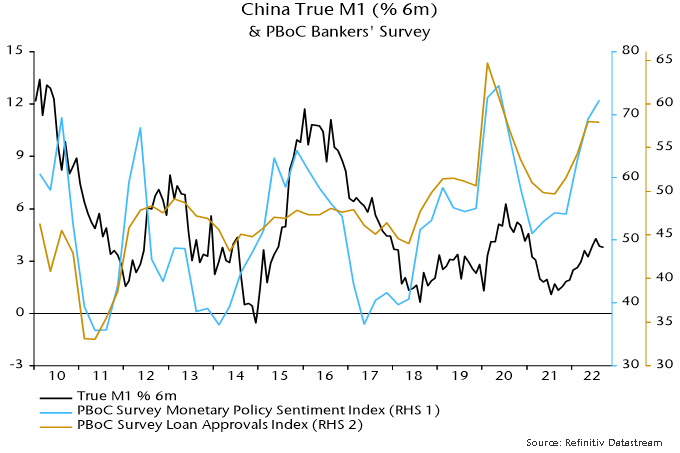
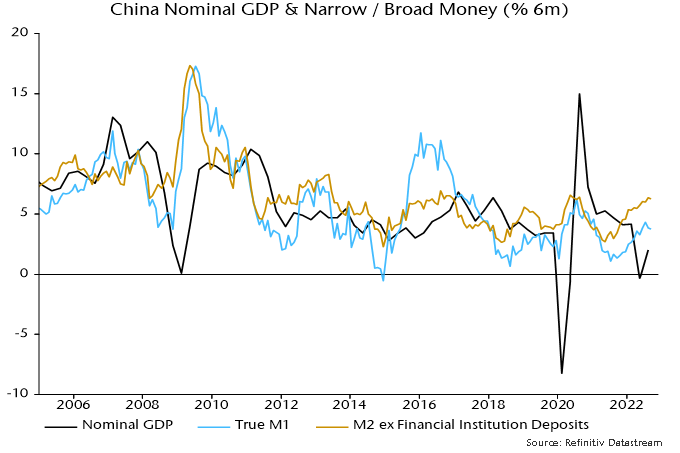
Six-month growth rates of nominal narrow and broad money have risen significantly over the past year, with the recovery reflected in a rebound in two-quarter nominal GDP expansion in Q3 despite further covid lockdowns – see chart 1. August / September numbers hint at a peak in money growth but continuing policy support, including directions to banks to expand lending, argues against a relapse – chart 2. 

Chart 1

Chart 1 showing China Nominal GDP & Narrow / Broad Money (% 6m)

Chart 2

Chart 2 showing China True M1 (% 6m) & PBoC Bankers’ Survey

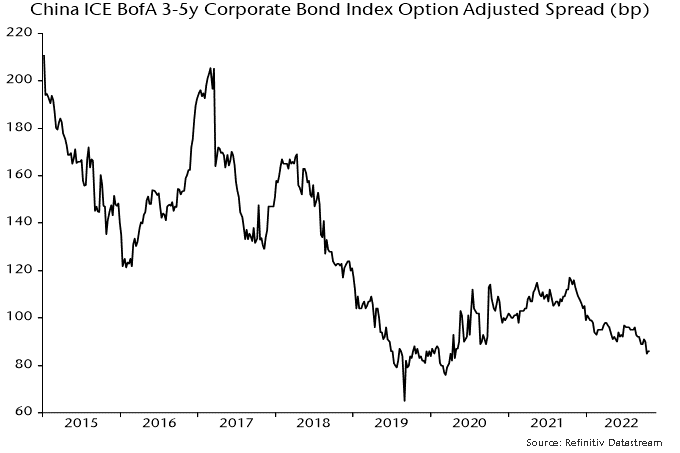
The faster growth of money than GDP, and of broad money relative to narrow, indicates that the transmission of monetary stimulus is incomplete and “excess” money is currently trapped in the financial system. The key reason for the impaired transmission, of course, is the zero covid policy. With economic activity suppressed, excess money has flowed into the bond market, reflected in a fall in government yields despite the global surge and a tightening of onshore credit spreads – chart 3. 

Chart 3

Chart 3 showing China ICE BofA 3-5y Corporate Bond Index Option Adjusted Spread (bp)

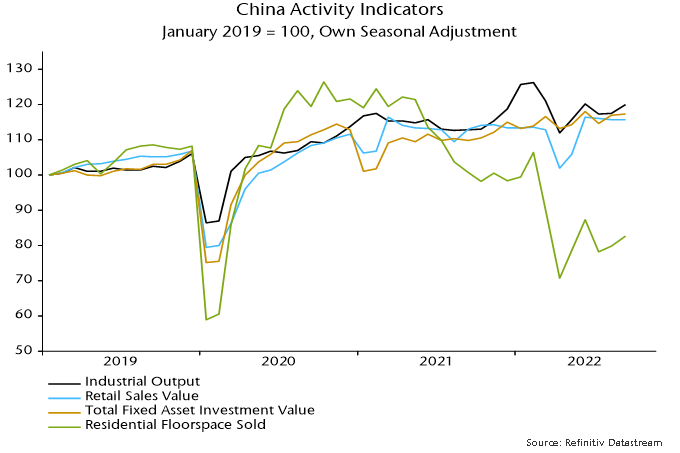
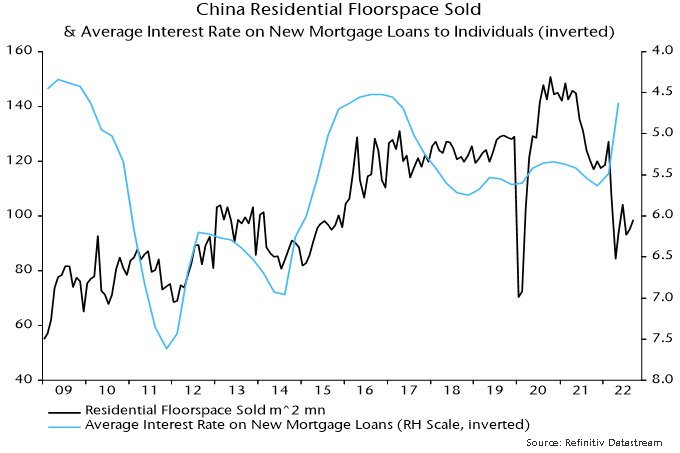
The economy, nevertheless, has been less weak than many feared, as confirmed by the Q3 GDP number and September monthly activity data, showing a pick-up in industrial output and a stabilisation of new home sales – chart 4. A H1 fall in the interest rate on new mortgages and other easing measures are supporting housing market activity, with secondary sales reportedly growing strongly – chart 5. 

Chart 4

Chart 4 showing China Activity Indicators January 2019 = 100, Own Seasonal Adjustment

Chart 5

Chart 5 showing China Residential Floorspace Sold & Average Interest Rate on New Mortgage Loans to Individuals (inverted)

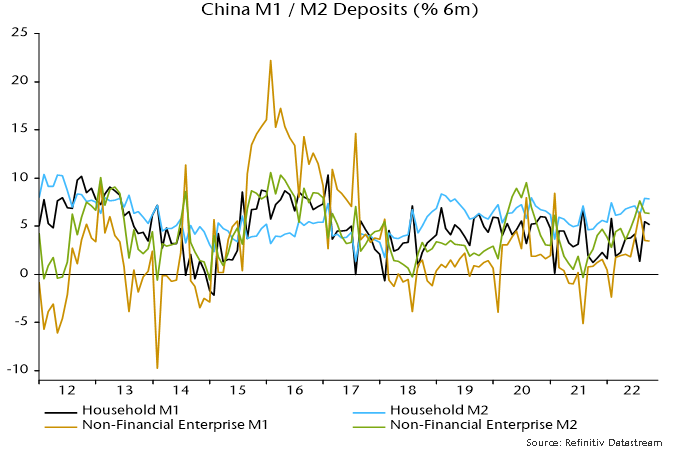
Retail sales remain weak but household money holdings are growing solidly, suggesting fire-power to lift spending if / when covid disruption eases – chart 6. 

Chart 6

Chart 6 showing China M1 / M2 Deposits (% 6m)

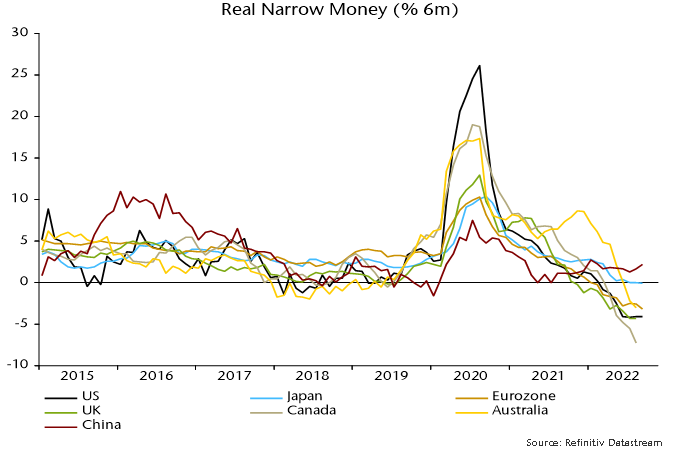
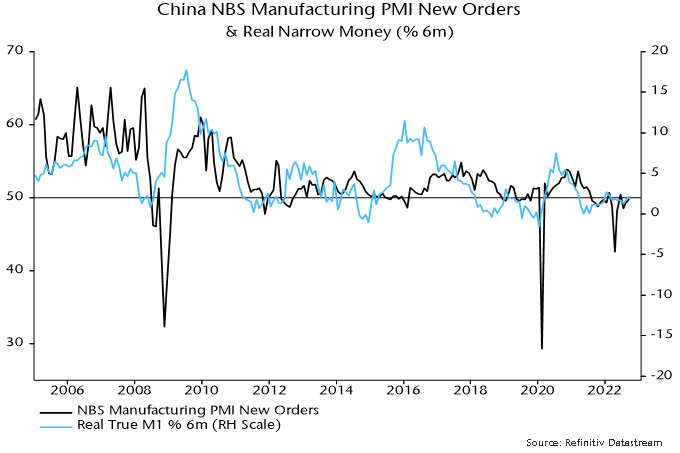
Six-month growth of Chinese real narrow money contrasts with contractions in most major economies – chart 7. The level of growth, however, is modest by historical standards, suggesting moderate economic expansion at best: current growth, for example, has been consistent with a manufacturing PMI new orders index of about 50 – chart 8. 

Chart 7

Chart 7 showing Real Narrow Money (% 6m)

Chart 8

Chart 8 showing China NBS Manufacturing PMI New Orders & Real Narrow Money (% 6m)

Export weakness due to global recession could drag the PMI lower, as occurred during the GFC. The Chinese reading, however, would be expected to hold up relative to global PMI new orders, which may be heading to 40. 

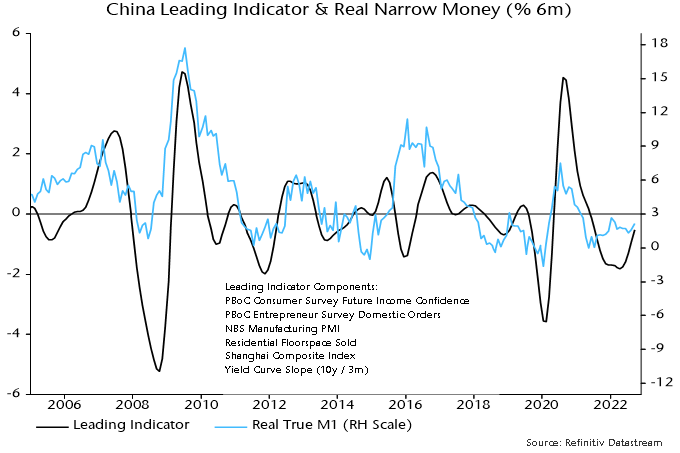
The moderately positive message for economic prospects from real money trends is supported by a recent recovery in a composite leading indicator calculated here, which attempts to mirror the components of the OECD’s US leading indicator – chart 9. 

Chart 9

Chart 9 showing China Leading Indicator & Real Narrow Money (% 6m)
Close-up of a pile of copper rods.

Recently, we have seen a pullback in commodity prices after the rally they experienced earlier in the summer. As many global economies are forecasted to enter recessionary environments, the demand trajectory for commodities remains uncertain. Over the longer time horizon, we believe some commodities will outperform others due to resilient demand, despite short term volatility. This week, we would like to highlight one metal that we are closely monitoring.

Following the general direction of metal prices this year, copper is down a little under 20% year to date, according to Bloomberg. The recent down trend in copper prices has mainly been attributed to the slowdown in Chinese demand. Economic doubts in the region and many other factors have been attributed to the disruption in the Chinese economy.

The troubles started this summer when the country suffered its worst heatwave in years. Being one of the regions most vulnerable to physical stress, the heatwave in China resulted in many energy generation sources going offline, causing widespread power shortages. Additionally, the country continues to keep tight COVID controls in place, with no end in sight for their zero-COVID policy. As cases spike in certain regions, they have not shied away from locking down affected areas. Finally, Xi Jinping’s political agenda to push greater state control at the expense of the private sector growth cast questions on what rate of GDP growth the country can actually achieve. 

With the rapid acceleration of the Chinese economy in the last decade, their demand for copper followed suit. The outsourcing trend accelerated in the 2000s further bolstered demand in the region. China currently accounts for 53% of the global copper demand, an increase from 38% in 2010. So, it is no surprise that downgrades in the speed of their economic development have caused a nervous sell off in the copper markets.

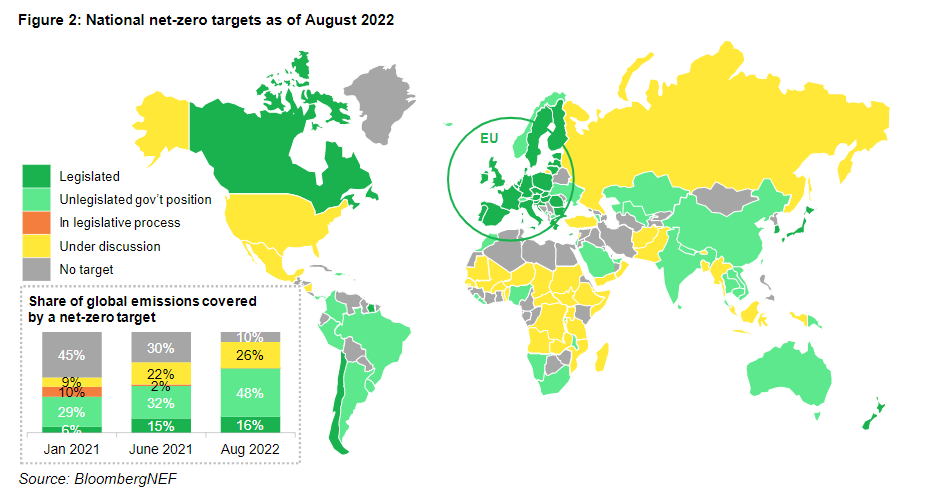
Traditionally, copper has been highly correlated to economic growth as it is an important material for construction, consumer durables, industrial equipment and ventilation and air conditioning. This type of demand for copper is called traditional demand. We are now seeing a more prominent demand driver for copper emerge, and it stems from the energy transition. Countries committing to net zero goals and setting strategies to achieve these ambitious targets will give copper demand an additional boost. Over 50% of countries around the world have net zero targets. Most are not yet legislated, but momentum is increasing as many feel the firsthand effects of climate change.

Map showing national net-zero targets as of August 2022.

Energy transition enabling technologies are highly reliant on copper. For instance, electric vehicles require three times as much copper as internal combustion engine cars. Additionally, with wind and solar becoming more widely adopted energy generation sources, transmission and distribution lines require an increasing amount of the metal as well. These transport and infrastructure needs will experience a 3.9% compounded annual growth rate between now and 2040, contributing to an overall copper demand growth of 53%.

The supply side, however, is expected to experience a squeeze. Mines have been seeing declining copper grades. Additionally, new mine commissioning takes up to ten years from initial phase to operation as environmental permits, financing and operations are all lengthy processes. Other sources of copper supply will be critical to meet the roughly 14 million tons shortage (BNEF). Solutions such as copper recycling and yield improvement technologies will play a key role.

Aurubis (NDA GR) 

We currently hold Aurubis in our portfolio, a world leading copper smelter and refiner. The company is also one of the largest copper recyclers in the world. As was the case with many European companies, they experienced rising energy costs as a result of the war in Ukraine, weighing on their performance. However, we strongly believe in the positive long-term trend for the industry. Aurubis is extremely well positioned to benefit from the energy transition. Their main smelter is one of the most efficient in the world and the company outperforms its peer group in terms of GHG emission intensity. Suppliers with better performance should benefit as more and more emphasis is put on managing Scope 3 emissions. Additionally, their recycling division is bound to thrive as regulations impose higher recycling rates and natural copper deposits continue to decline. 

We believe that given the strong demand, copper prices should find a floor and stabilize, experiencing a more favorable pricing environment than other metals.

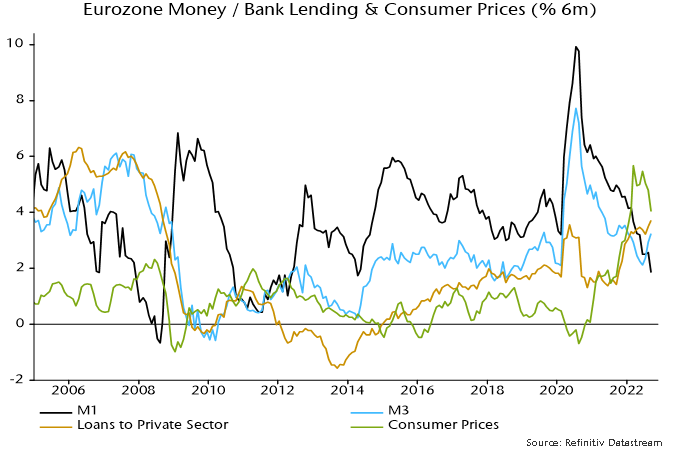
Eurozone money measures are giving mixed signals. Headline broad money M3 rose by a strong 0.7% in September, pushing six-month growth up to 3.3% (6.6% annualised), the highest since December. Narrow money M1, by contrast, contracted on the month, with six-month growth falling further to 1.8% (3.7% annualised) – see chart 1. 

Chart 1

Chart 1 showing Eurozone Money / Bank Lending & Consumer Prices (% 6m)

Broad money reacceleration, on the face of it, suggests an economic recovery towards mid-2023 after a sharp winter recession. The judgement here, however, is that broad money numbers have been boosted by technical / temporary factors and intensifying narrow money weakness is a better representation of current monetary conditions and economic prospects. 

The six-month rate of change of real M3, it should be emphasised, remains negative, with consumer prices (ECB seasonally adjusted series) rising by an annualised 8.2% between March and September. 

The sectoral breakdown of the headline M3 / M1 numbers, moreover, shows a significant recent contribution from rising money holdings of financial institutions. This probably reflects cash-raising related to weak markets and is not an expansionary / inflationary signal for the economy. 

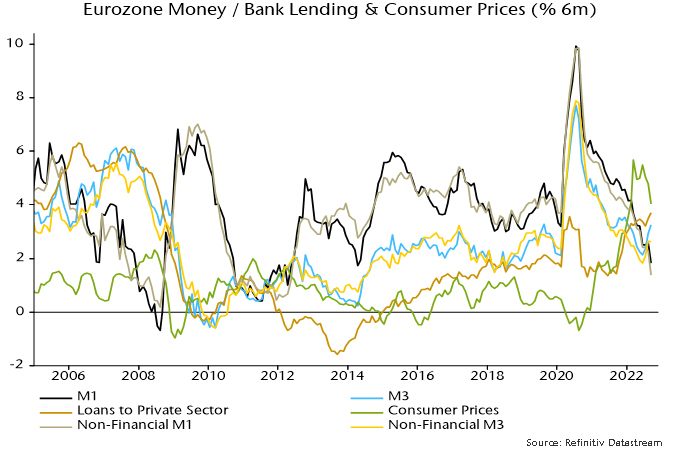
The forecasting approach here focuses on non-financial money measures where available, i.e. encompassing holdings of households and non-financial firms only. Six-month growth of non-financial M3 was 2.6% in September versus 3.3% for M3 and has shown a smaller recent recovery – chart 2. 

Chart 2

Chart 2 showing Eurozone Money / Bank Lending & Consumer Prices (% 6m)

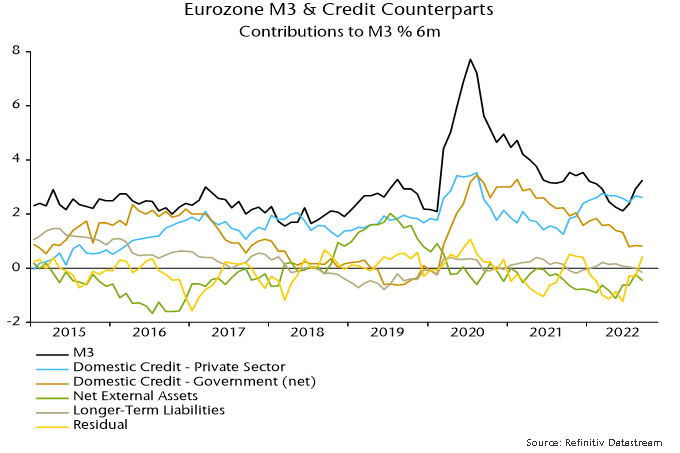
A further reason for playing down the broad money pick-up is that it is not explained by any of the conventional “credit counterparts” – credit to the private sector and government, net external assets and longer-term liabilities. The counterparts analysis shows a positive contribution from unspecified residual items, which behave erratically, suggesting a future reversal – chart 3. 

Chart 3

Chart 3 showing Eurozone M3 & Credit Counterparts Contributions to M3 % 6m

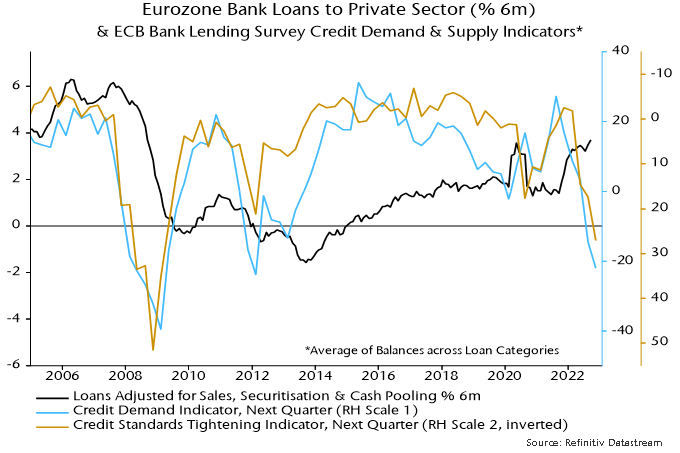
Solid growth of lending to the private sector has been the key driver of recent M3 expansion. The October bank lending survey, however, showed a further plunge in credit demand and supply balances, signalling a future lending slowdown or even contraction – chart 4. 

Chart 4

Chart 4 showing Eurozone Bank Loans to Private Sector (% 6m) & ECB Bank Lending Survey Credit Demand & Supply Indicators* *Average of Balances across Loan Categories

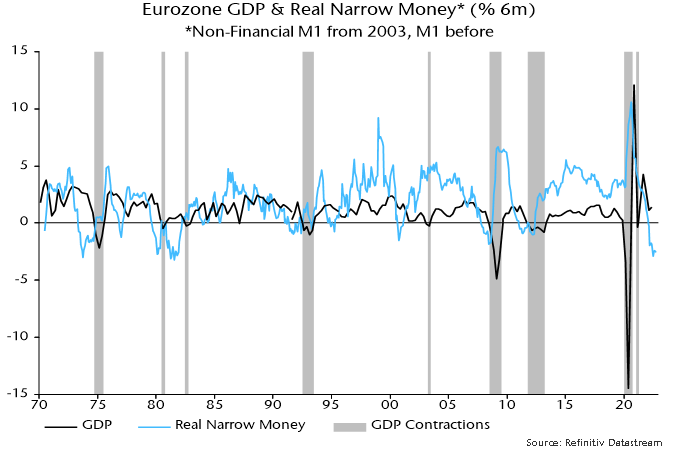
Statistical studies show that real non-financial M1 has the strongest leading indicator properties of the various money and lending measures. Its six-month rate of change remains at the bottom of the historical range, suggesting no economic recovery before H2 2023 – chart 5. 

Chart 5

Chart 5 showing Eurozone GDP & Real Narrow Money* (% 6m) *Non-Financial M1 from 2003, M1 before

Connor, Clark & Lunn Infrastructure (CC&L Infrastructure) and its partner, Alpenglow Rail (Alpenglow), today announced the acquisition of Alberta Midland Railway Terminal (AMRT), a short-line rail terminal located in Lamont County, Alberta that provides critical first and last mile transportation and logistics solutions to an established local customer base. This is the latest investment through a partnership established by CC&L Infrastructure and Alpenglow in 2019 that has since grown to include six rail terminals across Canada and the United States (U.S.).

AMRT, which has the capacity to store over 1,400 railcars on approximately 300 acres of property, is strategically located to serve one of the largest industrial hubs in North America, composed of 40+ industrial facilities representing over $40 billion in investments. AMRT is served by both CN and CP (the only Class I railroads in the region), and is situated in close proximity to industrial markets and large-scale customers, making the terminal integral to local supply chains.

“Our rail business has continued to deliver strong performance throughout the turbulent market conditions we have experienced over the past three years and AMRT represents an important addition to our growing rail investment portfolio,” said Matt O’Brien, President of CC&L Infrastructure. “We look forward to working alongside our partners at Alpenglow to drive further growth at AMRT and create long-term value across our broader rail business.”

This investment further advances CC&L Infrastructure and Alpenglow’s plan to develop and operate a diversified portfolio of rail businesses across North America. With the acquisition of AMRT, the partnership comprises three terminals in the U.S. Gulf Coast and three terminals in Canada, providing a diverse array of services to a blue-chip corporate customer base. 

“We are excited to expand our North American presence with the acquisition of AMRT,” said CEO of Alpenglow, Rich Montgomery. “We see opportunity to leverage our expertise to pursue significant growth including new customer service offerings. AMRT has some unique features that are difficult to replicate, including dual Class I service, a strategic location in Alberta’s premier industrial hub, and ample land for development and expansion. These features coupled with our proven approach focused on customer service and safety provides potential to add significant value over the life of the asset.”

About Connor, Clark & Lunn Infrastructure

CC&L Infrastructure invests in middle-market infrastructure assets with attractive risk-return characteristics, long lives and the potential to generate stable cash flows. To date, CC&L Infrastructure has accumulated over $5 billion in assets under management diversified across a variety of geographies, sectors, and asset types, with over 90 underlying facilities across over 30 individual investments. CC&L Infrastructure is a part of Connor, Clark & Lunn Financial Group Ltd., a multi-boutique asset management firm whose affiliates collectively manage approximately CAD$98 billion in assets. For more information, please visit www.cclinfrastructure.com.

About Alpenglow Rail

Alpenglow Rail develops and manages freight rail businesses and related transportation assets across North America. Alpenglow Rail currently owns and operates six rail terminals strategically located in leading industrial markets within Canada and the U.S. Gulf Coast. Alpenglow Rail was founded by seasoned railroad executives Rich Montgomery, Darcy Brede, Henning von Kalm, and Josh Huster. For more information, please visit www.alpenglowrail.com.

Contact

Vrushabh Kamat
Connor, Clark & Lunn Infrastructure
(437) 928-5184
[email protected]

Rich Montgomery
Alpenglow Rail
(720) 328-0944
[email protected]

Big crowd of people gathered together in one place (top view).

“Demography is Destiny.”

– August Comte1

From the dawn of mankind to the 1960s, it took approximately 60,000 years for the Earth’s population to hit the 3 billion mark. All it took was just 60 more years to add 4 billion more inhabitants and we remain on track to hit 10 billion by 2060.

Demographics influence everything from politics to sociology to economic growth. In fact, economic or GDP growth is essentially driven by two factors – growth in population and increase in productivity. 

While Europe and Japan have lately been associated with aging societies, declining populations and slowing growth, emerging markets continue to be associated with mega cities and limitless demographic dividends acting as investment tailwinds far into the future. However, the stark reality is that most emerging markets have already exhausted their demographic dividends. According to research by Aberdeen, even among emerging markets, only Pakistan and Nigeria are expected to reap dividends far into the future.

In fact, we think there could be a downward bias to population growth estimates for most emerging markets for reasons that are both societal and structural. Let’s take a look at the two emerging market giants – China and India.

China’s rapid rise has been facilitated by a demographic dividend that has not sustained for as long as most analysts predicted. To the contrary, China’s population has begun to decline a full nine years earlier than expected, with the population shrinking for the very first time in 2022. From the beginning of President Xi Jinping’s term in 2012 to 2021, the number of babies born each year fell more than 45%. 

Meanwhile, India’s population is expected to surpass China in 2023, a good seven years earlier than expected. With India, one would expect the opposite trajectory with the promise of a rich demographic dividend ready to be encashed for decades to come. But according to the United Nations, India’s population is actually expected to peak a decade earlier than expected (in 2050) and at a lower level (1.6 billion vs 1.7 billion). Given how badly statisticians and demographers have been off the mark with China, it would be reasonable to assume that these numbers could be revised downwards very soon.  

The downward revisions stem from our underestimation of some of the structural factors driving this decline in both countries. These factors include: 

The last point, as surprising as it may sound to some readers, could be a swing factor in decision making for the next generation of parents. According to a survey published by GlobeScan, four in ten people are not willing to bring children into a world suffering from the disastrous effects of climate change. Even growing emerging market populations in Egypt (61%), Turkey (54%), India (52%) and Vietnam (49%) are expressing doubts about having children in an uncertain world.

While no doubt many EM countries will have large growing middle classes, we remain mindful of opportunities that might arise from trends brewing beneath the surface. In some countries, the era of “easy” GDP growth might be over. This means we need to focus either on opportunities that cater to servicing aging populations or those that enhance the productivity of a smaller working age population. Below, we look at an example that services an aging population. 

Fu Shou Yuan (1448 HK) 

One of our holdings is Fu Shou Yuan (FSY), which is the largest death care provider in China. With a rapidly aging population, we expect FSY to benefit as the government slowly exits this market and releases cemetery land to the private sector. FSY operates in the premium segment, offering a full range of afterlife services, from funerals and cemetery plots to digital services, where customers can keep memories of their loved ones alive digitally.

China is the world’s largest aged society, with 10 million deaths per annum. The death care industry in China is expected to grow at 8% compound annual growth rate (CAGR) until 2024. With 3.4 million square feet of space and a valuable land bank around Shanghai, FSY has a reputation for operating clean, spacious, aesthetically designed cemeteries. In an industry where acquiring business licenses is difficult, FSY is able to leverage both its reputation and size to acquire government and private operations. 

FSY shows us that even in an industry such as death care, it is possible to differentiate a generic product through value-added services like landscaping and sculpture design, cremation jewelry, digital services and insurance coverage. At Global Alpha, we recognize that demography is not destiny and not all emerging markets are on the same trajectory. Finding horses for courses is one of the key elements of our investment process.


1August Comte (1798-1857) was a 19th century French philosopher whose ideas helped develop the modern field of sociology. He was one the first people to connect population trends with the future of a country. 

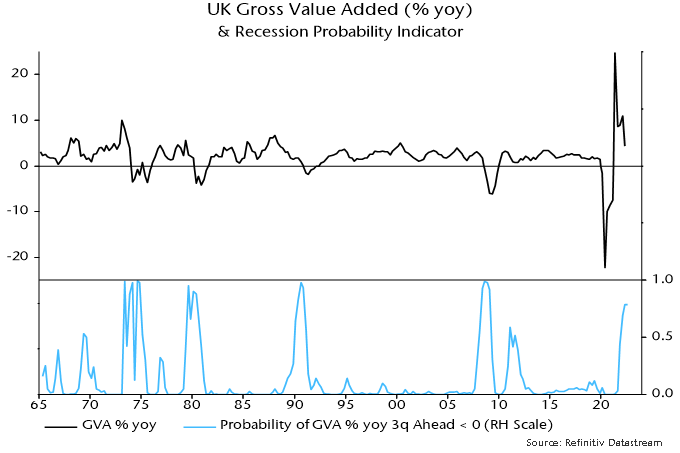
A “monetarist” UK recession probability model used here signalled a 70% likelihood of a recession in 2022 back in March. Coincident data suggest that contraction began in the summer. The model now indicates that the recession will last through Q2 2023, at least. 

Monthly GDP figures have been affected by holiday distortions and are often revised significantly but current data show a peak in May and a 0.9% drop by August. 

Employment is a lagging indicator so further growth in the PAYE jobs measure (also subject to large revisions) through September does not preclude a recession having begun*. Job vacancies, by contrast, are coincident. The ONS vacancies series peaked in May, falling steadily through September. 

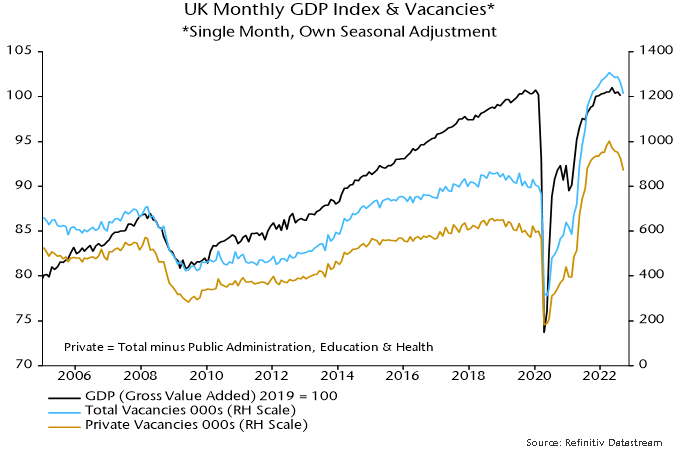
The published ONS series is a three-month moving average but single-month numbers are available on a non-seasonally-adjusted basis, to which an adjustment procedure can be applied. The resulting total vacancies series peaked in April, falling modestly through July before plunging in August / September– see chart 1. The suggestion is that economic conditions worsened sharply at the end of Q3. 

Chart 1

Chart 1 showing UK Monthly GDP Index & Vacancies* *Single Month, Own Seasonal Adjustment

The decline in total vacancies reflects a larger fall in private sector openings, which were down by 13% in September from a May peak, offset by a further rise in the public sector driven by health and social care. 

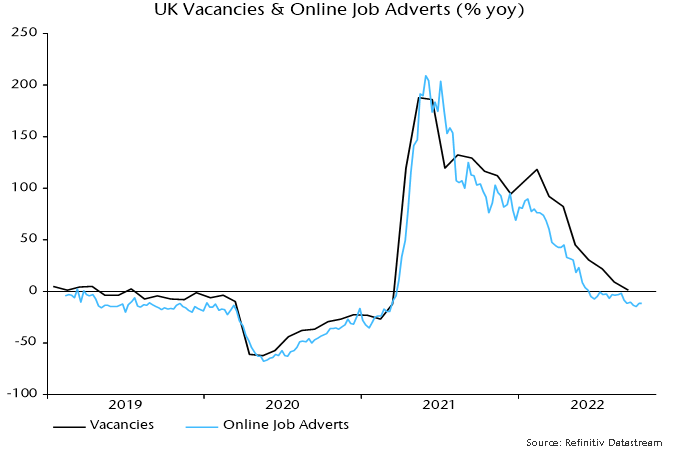
The official vacancies numbers are from a survey of employers but the ONS also compiles weekly indices of online job adverts from data supplied by Adzuna. These indices have a short history and are not seasonally adjusted but the year-on-year change in total job adverts mirrors that of total vacancies – chart 2. 

Chart 2

Chart 2 showing UK Vacancies & Online Job Adverts (% yoy)

Inputs to the recession probability model include real money measures, interest rates, credit spreads, share prices, house prices and the effective exchange rate – see previous post for more details. The model looks out three quarters and the probability estimate stood at 79% at end-Q3, suggesting that the economy will still be in recession in Q2 2023 – chart 3. 

Chart 3

Chart 3 showing UK Gross Value Added (% yoy) & Recession Probability Indicator

House price strength was a moderating influence on the model reading until recently but coming weakness may contribute to the probability estimate remaining in recession territory. 

*The Labour Force Survey measure of employees in employment fell between May and July but recovered in August.

The “monetarist” rule of thumb that monetary changes feed through to prices with a lag of about two years suggests that G7 consumer price inflation will fall steeply from early 2023. 

G7 headline annual CPI inflation, as calculated here*, moved back up to 7.6% in September, just below a June high of 7.7%. 

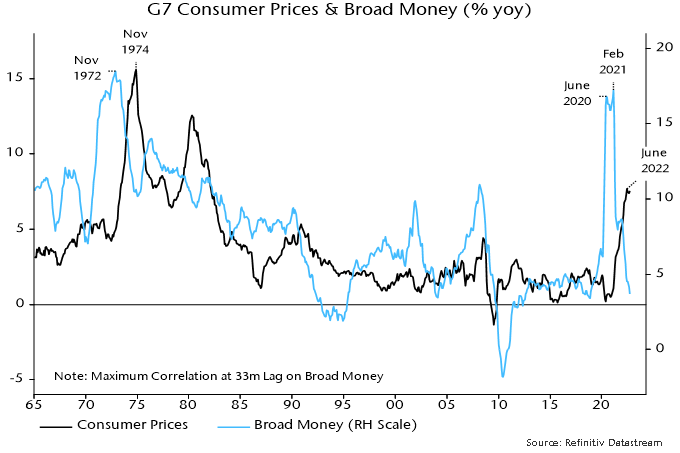
A QE-driven surge in G7 annual broad money growth in 2020-21 was similar in magnitude to a bank lending-driven surge in the early 1970s. A peak in money growth in November 1972 was followed by an inflation peak exactly two years later – see chart 1. 

Chart 1

Chart 1 showing G7 Consumer Prices & Broad Money (% yoy)

The 2020-21 money growth surge was largely complete by June 2020, although the final peak occurred in February 2021. The expectation here is that the June 2022 peak in CPI inflation will hold but the two-year norm suggests that a big fall will be delayed until after February 2023. 

Annual broad money growth collapsed from February 2021, falling much faster and further than after the 1972 peak. Then, money growth bottomed above 10% in 1975 and rebounded into 1976, remaining in double digits until 1980. Sustained strength allowed high inflation to become entrenched. 

Annual broad money growth is now below 4% (September estimate), with QT plans and a likely credit crunch suggesting further weakness. 

Money growth was relatively stable between 2013 and 2018, averaging 4.3% pa. CPI inflation averaged just 1.2% over 2015-20 (i.e. allowing for a two-year lag). Current monetary weakness suggests similar or lower inflation outturns in 2024. 

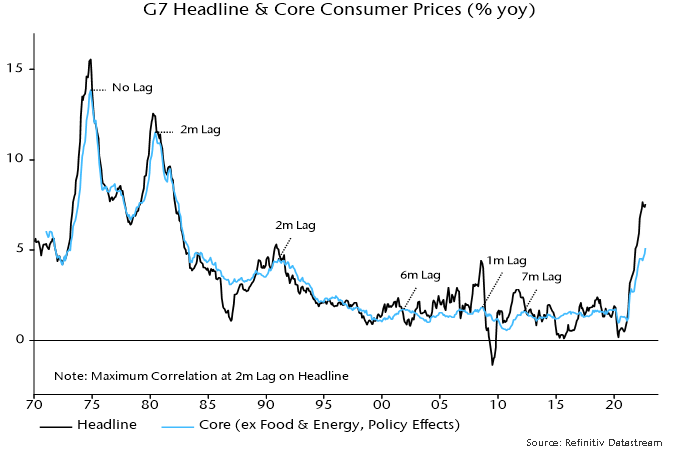
While headline probably peaked in June, core inflation continued to rise into September – chart 2. Core strength is feeding pessimism about inflation prospects, but shouldn’t. Contrary to popular mythology, core usually lags headline at turning points. Base effects boosted the G7 core annual rate over July-September but turn more favourable from October through next May (seasonally adjusted, the core index rose by an average 0.44% per month over October 2021-May 2022 versus 0.19% over July-September 2021). 

Chart 2

Chart 2 showing G7 Headline & Core Consumer Prices (% yoy)

*GDP-weighted, Japanese September CPI estimated from Tokyo data.

Recent dramatic tightening of UK credit conditions along with Bank of England plans for large-scale QT and a “significant” rate hike could tip current weak broad money growth over into contraction, in turn threatening a deflationary depression. 

To recap, the preferred broad measure here – non-financial M4, comprising sterling money holdings of households and private non-financial firms – grew at an annualised rate of just 0.8% in the three months to August. 

The Bank’s broad measure, M4ex, also includes money holdings of financial institutions, which may rise sharply in September / October, reflecting pension funds’ “dash for cash”. Any such strength is not expansionary / inflationary, increasing the importance of focusing on non-financial money measures. 

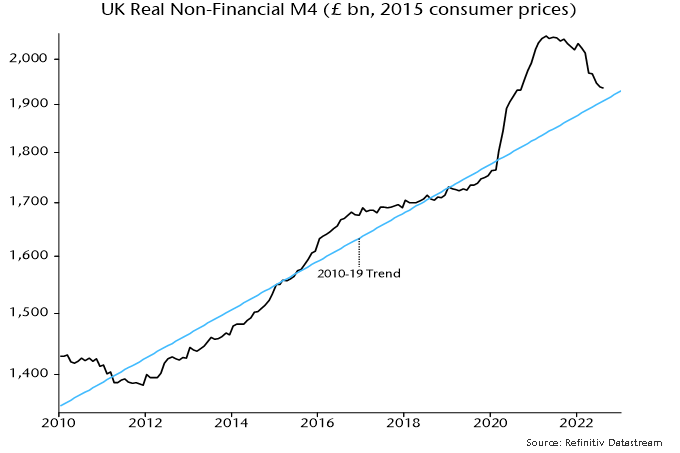
In real terms, non-financial M4 has retraced almost back to its pre-pandemic trend as the 2020-21 money surge has passed through to prices – see chart 1. There is no longer a monetary “excess” to support spending or sustain high inflation. 

Chart 1

Chart 1 showing UK Real Non-Financial M4 (£ bn, 2015 consumer prices)

Current monetary weakness will take time to be reflected in slower price momentum. Prices may continue to outpace nominal money expansion near term, sustaining the real-terms squeeze. 

How likely is it that nominal broad money will begin to contract? 

The “credit counterparts” analysis links movements in broad money to changes in four other components of the banking system’s balance sheet: lending to the public and private sectors, net overseas assets and non-deposit funding. 

Lending to the public sector includes QE / QT. The Bank plans to reduce its gilt holdings by £80 billion over the next 12 months, equivalent to 3.4% of non-financial M4. 

The monetary drag will be smaller to the extent that there is a compensating rise in commercial banks’ gilt holdings. Banks bought £13 billion of gilts in the year to August. Purchases reached a maximum 12-month rate of £50 billion in the wake of the GFC when banks were under strong regulatory pressure to boost their liquid assets. A plausible scenario is that banks will absorb between a third and a half of the QT supply, in which case lending to the public sector would have a contractionary impact on broad money of 1.7-2.2% over the next 12 months. 

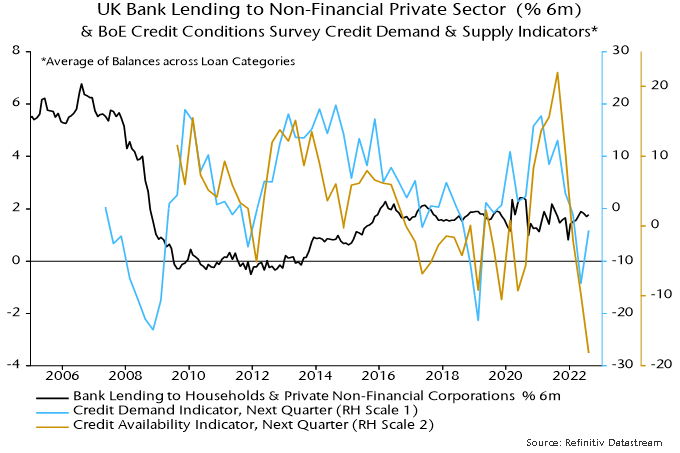
Bank lending to the private sector has been supporting broad money growth recently: lending to households and private non-financial firms expanded at a 3.1% annualised rate in the three months to August. The Bank’s Q3 credit conditions survey, released yesterday, signals weakness ahead: future credit demand balances remained soft while availability plunged – chart 2. 

Chart 2

Chart 2 showing UK Bank Lending to Non-Financial Private Sector (% 6m) & BoE Credit Conditions Survey Credit Demand & Supply Indicators* *Average of Balances across Loan Categories

The survey closed on 16 September so does not capture the further surge in market rates and spreads in the wake of the mini-Budget. 

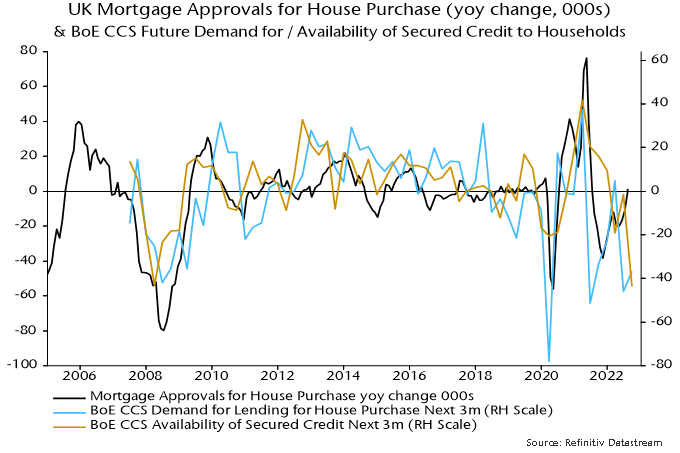
Residential mortgages account for 70% of the stock of lending to households and non-financial firms. The future demand and availability balances for secured credit to households last quarter were comparable with the lows reached at the depths of the GFC – before recent turmoil. Mortgage approvals could halve – chart 3.

Chart 3

Chart 3 showing UK Mortgage Approvals for House Purchase (yoy changes, 000s) & BoE CCS Future Demand for / Availability of Secured Credit to Households

Bank lending expansion, therefore, could plausibly grind to a halt, as it did in the wake of the GFC. The combined monetary impact of public and private sector lending would then become contractionary.

The other credit counterparts – banks’ net overseas assets and their non-deposit funding – are volatile and difficult to forecast but have had a combined contractionary impact over the last 12 months. The joint influence, however, tends to correlate inversely with lending to the private sector, so could become supportive as lending weakens. 

The “best case” scenario appears to be weak broad money expansion with a significant risk of contraction. 

The warranted policy response is to cancel QT and rate hikes. The Bank, instead, has boxed itself into a restrictive stance in a misguided effort to rebuild its shattered credibility and avoid a charge of “fiscal dominance”. 

The hope is that a government U-turn on the mini-Budget together with an easing of global interest rate pressures result in a reversal of recent market-driven credit tightening. A Bank policy shift is coming but may have to wait for evidence of sharply contracting economic activity.