post last month argued that a pick-in Eurozone broad money M3 growth into September reflected temporary factors that would reverse. October numbers delivered the expected turnaround, with M3 falling by 0.4% on the month. Narrow money measures, meanwhile, lost further momentum, with Italian data particularly weak.

The summer pick-up in M3 growth had been discounted here for two reasons: the numbers had been boosted by rapid and probably unsustainable expansion of financial sector deposits; and the pick-up was inconsistent with the behaviour of the credit counterparts (bank lending to government and the private sector, net external lending etc), instead reflecting a statistical “residual”.

October numbers showed a large drop in financial M3 holdings, correcting earlier strength, while the credit counterparts residual turned negative.

The preferred money measures here exclude financial sector holdings, which correlate poorly with near-term economic performance. Six-month growth of non-financial M3 was stable in October at 5.2% annualised; growth of non-financial M1 slumped further to 2.1% annualised, the weakest since the 2011-12 Eurozone crisis / recession – see chart 1.

Chart 1
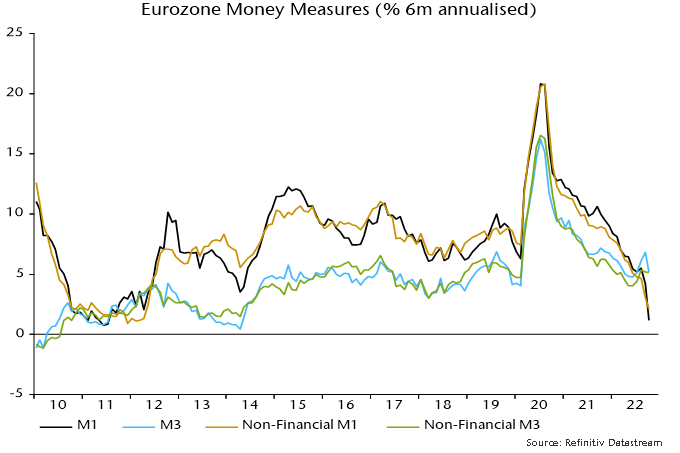
Chart 1 showing Eurozone Money Measures (% 6m annualised)

Real narrow money is contracting much faster than during that crisis: the six-month rate of decline reached a new record in data extending back to 1970 – chart 2.

Chart 2
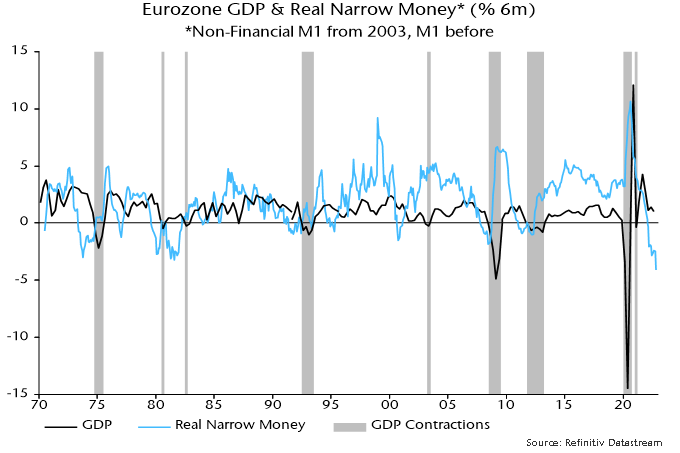
Chart 2 showing Eurozone GDP & Real Narrow Money* (% 6m) *Non-Financial M1 from 2003, M1 before

Country data on real overnight deposits (including financial sector holdings) show particular weakness in Italy, reflecting both nominal contraction and a larger recent inflation spike than elsewhere – chart 3.

Chart 3
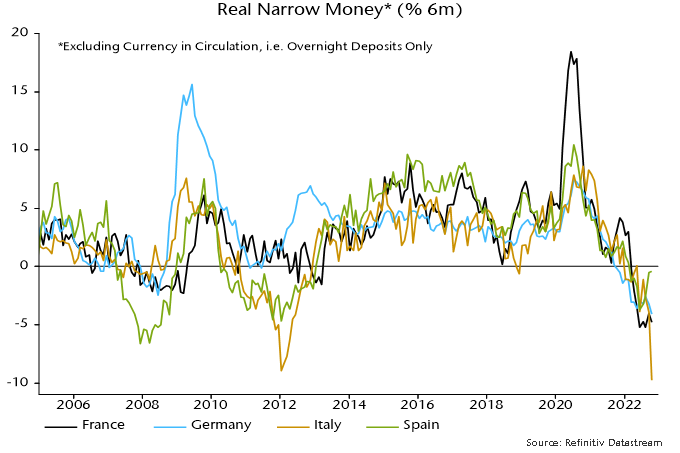
Chart 3 showing Real Narrow Money* (% 6m) *Excluding Currency in Circulation, i.e. Overnight Deposits Only

The previous post suggested that a lending slowdown would act as a drag on broad money growth. Bank loans to the private sector were unchanged on the month in October.

Cyclical sectors of European equity markets have recovered some relative performance recently, possibly reflecting a belief that a grim economic outlook was becoming less dire at the margin. A minor recovery in the expectations component of the German Ifo business survey might be viewed as supporting reduced pessimism – chart 4.

Chart 4
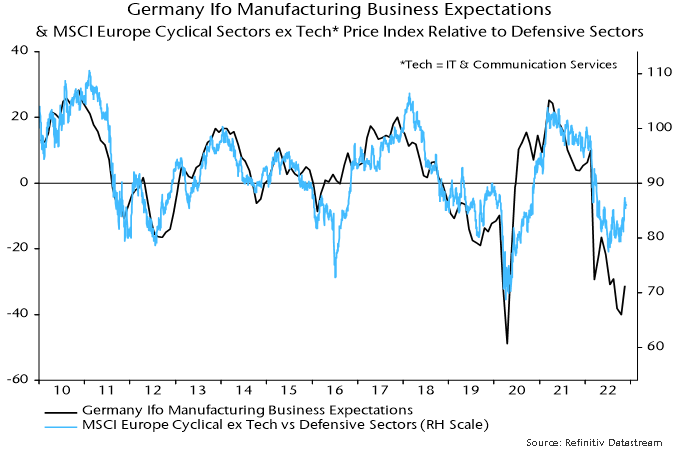
Chart 4 showing Germany Ifo Manufacturing Business Expectations & MCSI Europe Cyclical Sectors ex Tech* Price Index Relative to Defensive Sectors *Tech = IT & Communication Services

The level of Ifo expectations, however, remains historically weak and a further fall in Eurozone / German six-month real narrow momentum argues that economic stabilisation, let alone a recovery, remains distant – chart 5.

Chart 5
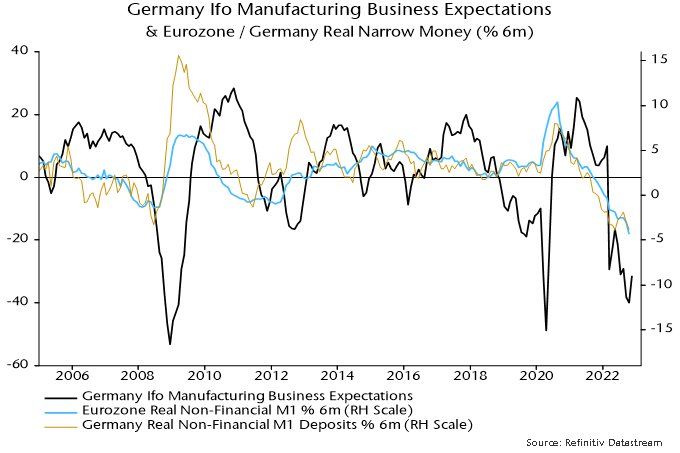
Chart 5 showing Germany Ifo Manufacturing Business Expectations & Eurozone / Germany Real Narrow Money (% 6m)

Nominal money trends and prospects suggest that monetary conditions are already restrictive, contrary to the ECB’s assessment*. Likely policy overtightening is another reason for fading the cyclical rally.

*See speech by Executive Board member Isobel Schnabel.
The major fiscal tightening announced by Chancellor Hunt in the Autumn Statement was motivated by a markedly more pessimistic OBR assessment of medium-term prospects for the economy and public finances. Even if its latest forecasts prove “correct”, revisions on this scale between six-monthly forecasting rounds are questionable and result in undesirable volatility in policy-making.

The economic outlook has deteriorated since the March Budget but the OBR’s fiscal assessment is based on the projected level of potential output four to five years ahead. This relies on assumptions about trends in productivity and labour supply and should be little affected by the prospect of a near-term recession.

The OBR has revised down its projection for potential output growth over the forecast horizon by a whopping 1.7 pp since March, mainly reflecting an assumed hit to productivity from energy prices staying high over the medium term. An associated loss of receipts accounts for almost a third of the £75 billion upward revision to borrowing in 2026-27 based on unchanged policies.

The OBR ignored the productivity implications of high energy prices in March on the grounds that it was unclear whether they would persist. The outlook is no less uncertain now yet the OBR has chosen to incorporate the full hit. A better approach would be to phase in adjustments over several forecasting rounds, varying the pace depending on energy price developments between rounds.

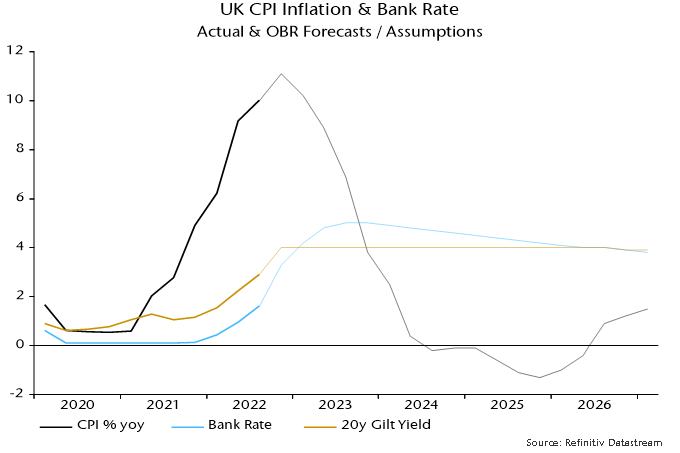
The most significant forecasting change since March was a substantial upward revision to the path of interest rates, with Bank rate and long-term (i.e. 20-year) gilt yields now averaging 4.4% and 4.0% respectively between 2023-24 and 2026-27, versus 1.5% for both previously. An increased debt interest bill accounts for £47 billion of the £75 billion boost to 2026-27 borrowing.

The interest rate assumptions are derived from market rates but they are clearly inconsistent with the OBR’s economic forecasts – particularly its projection that the annual change in consumer prices will turn negative in Q3 2024 and remain below zero for a further seven quarters.

Chart showing UK CPI Inflation & Bank Rate Actual & OBR Forecasts / Assumptions

The MPC’s latest forecasts show CPI inflation falling below target two to three years ahead if Bank rate remains at the current 3.0%*. An assumption of a 3.0% average for Bank rate is a more sensible basis for the medium-term fiscal forecast. If long-term gilt yields were also to average 3.0%, the interest bill in 2026-27 would be £21 billion lower than the OBR has projected, according to its debt interest ready reckoner. This is equivalent to three-quarters of the extra tax raised in 2026-27 from measures announced in the Autumn Statement.

A possible interpretation is that Chancellor Hunt has been bounced into unnecessary fiscal retrenchment by a combination of a questionable downgrade to the OBR’s productivity projection and its punctilious adherence to a forecasting convention – of using yield curve-derived interest rate assumptions – that made little sense in the context of recent stressed markets.

Chancellor Hunt, however, may have had an incentive to collude with the OBR’s doom-mongering, since it has allowed him to “kitchen sink” fiscal bad news in the reasonable hope that another OBR forecasting swing will open up space for him to reverse course and announce tax “cuts” before the next general election.

*CPI inflation falls below 2% in Q2 2024 in the MPC’s modal (i.e. central) forecast and in Q3 2025 in its mean forecast (which incorporates a risk bias to the upside).

Image of human hand pointing at touchscreen with business document.

In times of market challenges, companies are taking steps to reduce their cost structure. Over the past weeks, we have seen several layoff announcements. As companies review and adopt their operating budgets for next year, other non-personnel costs could be at risk.

With many economies on the brink of recession, executives could be inclined to decrease their marketing expenditures. As shown in the latest International Business Barometer, more than half of corporations expect to reduce marketing expenditures over the next year in fear of recession.

As seen in previous downturns, companies maintaining their marketing expenditures increase their likelihood of emerging from recessions in a better position than competitors. As the competitive landscape becomes less intense, companies maintaining these expenditures could differentiate themselves and gain market share.

Market research is vital in finding new customers or launching new products. Market research expenditures represent a small proportion of the total marketing expenditures. For that reason, they tend to be more resilient compared to advertising expenditures. For example, P&G spent $7.9 billion on advertising during its fiscal year 2022, as opposed to $2 billion for research and development costs. In our view, market research expenditures could be one of the most strategic expenditures inside marketing budgets. Market research is the starting point for the launch of new projects, and it drives commercialization.

Ipsos, a company we own in our International Small Cap strategy, is one of the largest market research companies globally. The company is active in 90 different markets and employs more than 18,000 people. We believe that Ipsos benefits from secular growth driven by strong demand for reliable information to solve more complex issues. Corporations need to access that information to position themselves in a fast-changing world. The new 2025 plan unveiled by Ipsos aims to have the company grow faster than the market research industry, notably through market share gains and the development of digital and tech-based services.

Market size

  • The global market research services industry is expected to reach $90.8 billion by 2025. That industry is expected to grow 5.3% per annum.

Growth strategy

  • Expanding its client base or grabbing more share of wallet from their existing customers.
  • Adding new tech-based services, such as: SaaS offering, advisory, DIY research, social intelligence.
  • Bolt-on acquisition.

Strengths

  • Recognized as one of the most innovative market research companies, as published in a recent GreenBook Research Industry Trends report.
  • Thanks to its global reach, Ipsos is one of few companies with capacity to manage worldwide market research programs.
  • Well-diversified geographically and by client types. Its exposure to defensive sectors like the pharma and public sectors represents close to 30% of revenues.
  • Long-term client contracts with high recurrency.
  • Strong balance sheet with a low leverage ratio of 0.4x net debt to EBITDA.

Opportunities

  • Fragmented market with lots of opportunities to conduct M&A, especially in DIY research.
  • Digitization trend in the market research industry. Digitization helps bring down costs associated with data collection while providing new source of revenue.
  • Its revenue from new services has grown rapidly over the years. Through these new services, Ipsos has met corporates’ needs in term of data collection in real time, quickly analyzing large amounts of information, leveraging measurement of social media, and providing advice for clients. The company can build on that expertise and experience to increase market share. 
  • With 32% of its revenue being generated in the U.S., Ipsos has room to gain more market share in the biggest market research industry globally. 
  • Emerging markets are expected to outpace the growth in developed markets.

Risks

  • The industry is somewhat exposed to the cyclicality of its clients’ marketing budgets.
  • Failure to develop new services or falling behind on technology would negatively impact its revenue.
Riyadh skyline at night, showing Olaya Street Metro Construction

Background

The Gulf region is comprised of six nations that sit on some of the largest and most profitable hydrocarbon resources in the world. Large and successful investments in the extraction and commercialisation of those resources created tremendous wealth for the region in the last 50 years, with average GDP per capita growing from around $1,000 in 1970 to over $30,000 in 2021.

This transformational growth in a relatively short period of time far exceeded the region’s human capital capacity and necessitated that those nations attract foreign workers to fill the gap. Today, over 30% of the region’s ~50 million population is comprised of expatriate labour (ranging from ~90% in the UAE to ~35% in Saudi), the majority of which are employed in the private sector. In the last ten years, governments in the Gulf have embarked on a series of initiatives to promote the localisation of the private sector workforce (Saudisation) through schemes that encourage businesses to hire local citizens. A bloated public sector funded by dwindling oil revenues pushed labour localisation initiatives to the centre of domestic economic and social policy in the Gulf.

In this research, we focus on Saudi Arabia which is home to the largest population in the Gulf region (~35 million in 2021 according to the World Bank), and where Saudisation is a key policy pillar.

Saudisation has been negative for labour-intensive businesses that rely on foreign workers. That, naturally, has been the area that the market has most focused on. In this paper, we move the conversation to the top of the organisational hierarchy by examining the changes in the nationality of the CEOs of publicly listed main market Saudi companies. While Saudisation does not directly determine the nationality of a CEO, the underlying theme of localisation is indeed relevant and consequential for investors in the Saudi equity market.

Academic research measuring the performance of expatriate CEOs has found that executive characteristics have a measurable effect on company performance. One notable study by Sekuguchi et al. demonstrated that expat executives at multinational companies operating in Japan were more effective at increasing subsidiary revenues compared to their native counterparts[1]. Given the limited breadth of data on this subject, our aim -for now- is to use the data available to present a practitioner’s view on the subject.

Investment considerations

At Vergent, we place great emphasis on understanding the culture of the companies we are invested in. This is a difficult task that we reserve for the companies that we believe have compounding potential and we want to own for the long term. It takes years of interactions with business leaders and their teams to begin to appreciate a company’s culture. As such, our process combines quantitative analysis that captures the manager’s capital allocation track record with an understanding of their incentive structures, what drives them, and what irritates them (generally, we don’t invest in irritable CEOs). In Saudi, a country our team has been investing in for over a decade, this is a particularly difficult area to explore and is made more complicated by the fact that CEO tenures are generally short, they rarely own stock, and there is a reasonable likelihood they are expatriates. This does not compromise the quality of CEOs in Saudi, but simply requires a reframing of traditional management evaluation frameworks to reflect the nuances of the market.

The expatriate CEO

  • Expatriate CEOs come from neighbouring Arabic-speaking countries or from the West. American CEOs are a rarity, given the tax treatment of U.S. citizens’ incomes abroad which makes tax-free destinations like Saudi less attractive.
  • Many of the Arab expat CEOs built their careers in the region, and so naturally have an advantage over their western peers in the form of a more developed local network and a deeper understanding of consumer behaviour and culture.
  • Western CEOs are typically appointed directly into a CEO role. Most would have spent time in emerging markets with a multinational company previously. The advantage those CEOs have over their Arab expat and Saudi CEO counterparts is they tend to have a better grasp of global trends and a global multinational managerial experience.
  • The proportion of expat CEOs leading main market Saudi companies has decreased since 2016. Breaking that down, we find that IPOs contributed six expatriate CEOs by 2021, but that their net number dropped from 15 to 13 because of de-listings/mergers and a churn of expatriate CEOs that was filled by their Saudi peers.

Figure 1: Expats lead a decreasing proportion of Saudi main market companies (%)

Source: Saudi Exchange Filings, Bloomberg

Sector dynamics

  • Certain sectors have historically had an above average percentage of expatriate CEOs. For example, in telecoms, two of the three listed companies are majority owned by multi-regional companies (UAE’s Etisalat and Kuwait’s Zain) that have tended to appoint expatriate leadership from within their broader group to run the Saudi units. In addition, the telecom industry requires global experience and technical knowledge that is less likely to be found among Saudi CEOs.
  • Banking is another area where expatriate CEOs are over-represented (relative to the average). We attribute this to the presence of global banks in Saudi. Selective appointments made by leading banks to execute on transformational and highly complex growth strategies have also contributed to this over-representation. Al Rajhi Bank, the largest bank in the country by market capitalisation, hired an American CEO in 2015 to help build out and execute their growth strategy before transitioning to a very capable Saudi CEO in 2020.
  • Banking as a sector has the highest percentage of Saudisation in the economy. It is therefore expected that we will see more Saudi leadership, even at the traditionally expat-led global banks. Our conversations with those banks suggests that they are increasingly looking to localise at the top. Saudi banks like Al Rajhi have displayed much more agility in the market in the last five years and have materially outperformed global banks who are realising that this competitive environment requires local expertise at the top. A recent example is Saudi British Bank (majority-owned by HSBC) which hired Lama Ghazzaoui, a female Saudi, as CFO in March 2021.
  • We find that asset-heavy and cyclical industries have a greater proportion of Saudi leadership. Cement and petrochemicals are traditionally Saudi-led sectors. This is because these are established sectors with a good supply of capable Saudi managers with relevant educational and technical backgrounds. Many of these companies tend to be majority-owned by the state, and so naturally Saudi leadership is desired.

Figure 2: Proportion of Saudi main market companies who have had an expatriate CEO at any time since 2016 by sector

Source: Saudi Exchange Filings, Bloomberg

Family business

  • Family-controlled businesses are a notable feature of the Saudi main market. From a list of 169 main market companies with a market cap of over $200 million (excluding REITs), we found that 84 are family-controlled. For clarity of methodology, we define family control as companies where one or more families sit at the top of the shareholder list.
  • It is expected that the universe of family-controlled companies will grow as the stock exchange becomes a more desirable growth and exit option for those families. Therefore, an understanding of management dynamics in this area will only grow in importance.
  • Family-owned companies are particularly prominent in sectors like building materials, retail, real estate, education, and healthcare.
  • Of the 84 family-owned companies, 17 are still run by CEOs from the controlling family (family CEO). We expect the proportion of family CEOs to decline over time as businesses evolve and shareholder structures fragment with the entry of a new generation of family members who are less interested in being involved in the business. In the last two months, family CEOs of two retail companies resigned from their positions on account of operational and institutional underperformance.
  • Outsider CEOs (from outside the family) are primarily Saudis rather than expatriates. In fact, 94% of family-controlled companies are run by outsider Saudi CEOs, which is in line with the overall market average.
  • Saudi CEOs are better placed to fill professional CEO roles in family-controlled companies as they can manage the different stakeholders and processes involved in a traditionally family-run business.
  • We believe there are significant value unlocking opportunities for companies that effectively transition from a family CEO to a professional CEO. Irrespective of nationality, CEOs will need the freedom to operate, and an aligned compensation that preferably includes stock ownership.

Figure 3a: Proportion of CEOs by nationality in family-controlled businesses

Source: Saudi Exchange Filings, Bloomberg

Figure 3b: Proportion of family CEOs leading their family business today

Source: Saudi Exchange Filings, Bloomberg

Tenures

  • Intuitively, one would expect the tenure of Saudi CEOs to exceed their expatriate counterparts. Expats often return to their home countries for a variety of reasons and so leave the labour force more frequently. However, the data is inconclusive and suggests nationality is not a determining factor in CEO tenure. It should be noted that we are comparing a small population of expatriate CEOs to a large population of Saudi CEOs and so any observations should be noted in the context of that limitation.
  • Family-owned and operated businesses with family executives have less turnover. One example is Jarir Marketing where the founding family has occupied the chairmanship of the Board and role of CEO since it listed the company in 2003.
  • A few Saudi business leaders have been called to serve in government. Just this September, SABIC, the largest petrochemical company in the country, announced the resignation of CEO Yousef Al Benyan after he was appointed Minister of Education by royal decree. This impacts the tenure profile of Saudi CEOs.
  • We believe that limited stock ownership among professional (non-family) CEOs is a contributing factor to the overall short tenure observed in Saudi.
  • We observe that demand for the services of Saudi CEOs is high in the market. In the absence of stock ownership, Saudi CEOs are more likely to entertain and accept competing offers, resulting in tenures continuing to be relatively short.

Figure 4: Tadawul Main Market CEO tenure by sector (Since 2016)

Source: Saudi Exchange Filings, Bloomberg

Summary

  • The measurement of management performance in Saudi is an area of research that is nascent and limited by data constraints (i.e., a small number of observations). Any conclusions we make in this paper are therefore largely based on anecdotal evidence, with data used to sense check those conclusions and provide context.
  • Localisation and a new generation of Saudi business leaders is likely to see expatriate CEOs become less of a feature in the market. We believe this is positive as it should create more stability in tenures if coupled with aligned compensation structures and less competition for Saudi executives from the public sector.
  • Family-controlled businesses run by family CEOs have a great opportunity to unlock shareholder value through effective professionalisation of management.
  • We find that analysts and investors in the Saudi market are sanguine about management quality and alignment. There are numerous examples of the market looking through changes in management and not expecting negative future fundamental performance as an outcome.
  • We believe management changes carry strong predictive power of future company fundamental performance. Developing an understanding of the people and culture of Saudi companies can contribute to generating significant insights on the quality of a company. This leads to better investment decisions and improves the prospect of generating investment alpha.

[1] Sekiguchi T, Bebenroth R, Li D. (2011). Nationality Background of MNC affiliates’ top management and affiliate performance in Japan: Knowledge-based and upper echelons perspectives. International Journal of Human Resource Management 22 (5), pp. 999—1016.

Great Hall of the People (Chinese Parliament) in Bejing, China.

Summary

We have been discussing the news flowing out of China’s 20th Party Congress (held from 16th-22nd October) at length over the past few weeks. While the press and market reaction was poor, there are some positives from the event that are underappreciated by the press/market. While political and structural risks remain elevated, we have kept our China weighting at neutral given positive signs of economic bottoming and improving liquidity data.

The event is important as the Congress report outlines high level, long term structural issues with more detailed economic policy due for release at the Central Economic Work Conference in December this year. Xi’s speech to Congress, a shortened version of the report, signalled no dramatic changes to policy. In addition, the new Central Committee of the CCP and Politburo Standing Committee were both announced at the conclusion of Congress. The Standing Committee, which is the apex of China’s political system, were all Xi loyalists and with Shanghai Party chief Li Qiang touted as the next Premier being the major surprise.

Below we list the positive, negative and neutral points which emerged from Congress.

Positives

  • Reiteration of development (implies economic growth) as a top priority and the real economy is the cornerstone (vs. pessimistic market speculations that this will come in second place after national security, or China would reject opening up). However, it seems that they’re calibrating the balance between development and security.
  • Continued emphasis on education, technology and innovation (in fact, higher priority vs. 19th congress). More support to semis and IT.
  • Relationship between consumption and investment: strengthen the fundamental role of consumption in economic development and the key role of investment in optimizing the supply structure.
  • Reiterated target that in 2035, China’s GDP per capita should reach that of a “medium-level developed country”, target was first announced 3yrs ago with no specific definitions, but it will carry more weight given it’s in the opening report of the congress this time.

Negatives

  • Major shock was the composition of the new Politburo Standing Committee – all belong to Xi’s faction, some are relatively young (by CCP standards) and perceived to lack central government experience.
  • The market reacted negatively to the news despite this direction of travel having been made clear years earlier when Xi changed the Party constitution in 2018 to remove the two term limit for the presidency. However, most China watchers were hoping to see some checks and balances in the Politburo make-up as per historic precedent.
  • Foreign investors were quick to dump Chinese stocks once the list of Standing Committee members was announced – especially H-shares and US ADRs, while A-share declines were more moderate.
  • Appointments broke unwritten precedent that any officials aged 67 or under at the time of a party congress can be promoted, while anyone aged 68 or over is expected to retire (Xi turned 69 this year). 
  • Appeared to double down on zero covid.
  • Plenty of mentions of common prosperity (basic requirement of China’s modernisation).
  • Reiterates policy continuity in the housing market (housing is for living, not for speculation).
  • More security (89 times in his speech, vs. 55 in 2017), less reform (48 vs. 69 before). National security a higher priority (vs. 19th congress). The concept of national security is comprehensive, covering political, economic, military, technology, cultural and social aspects and integrating external and domestic issues. Including key aspects like energy, self-reliance of food & technology.
  • Relationship between the market and the government: the market plays a determining role in resource allocation, and the role of the government should be improved.

Neutral

  • Relationship between SOE and non-SOE sectors: consolidate and develop the public sector economy; meanwhile, encourage, support and guide the non-public sector economy.
  • Chinese-style modernisation (more mentions vs. 19th congress).
  • Li Qiang is the de facto Premier (officially appointed in March next year). He is a Xi loyalist and the ex-Shanghai chief who presided over the city’s 2-month lockdown earlier this year. Li will be expected to steer the economy out of its current slump, relying on extensive experience in regional economic management in a number of business hubs.
  • No change of rhetoric on Taiwan – will make every effort to foster a peaceful resolution, seek more exchanges with Taiwan, but use of force cannot be ruled out.

Other observations

  • First time Xi didn’t read out full report (1.8h speech yesterday vs 3.3h 5yr ago), full report is more important – hasn’t released the official version, a 72pg version available on internet.
  • Zhao Lijian (spokesman for Chinese Ministry of Foreign Affairs) said: “China will never follow the old path of being closed and rigid, instead China’s door will only open wider. We will maintain high quality development and high level of opening up to provide a sustainable driving force for global economy.”

Conclusions

Long term investment implications

  • Congress does nothing to reduce the risk of China becoming stuck in the so-called “middle income trap”.
  • No clear sign that historic tendency for pragmatic policy making will change.
  • Cold War 2.0 with US to persist.

Short term investment implications

  • Short to medium term returns will be driven by the economy and Covid.

According to research by the Bank of America, global risk assets have lost over $35T since November 21, 20211. This should come as no surprise as we are seeing: the co-dependency of Wall Street and the Fed, stop-go economic policies, zero COVID policy in China, headline inflation, political instability, war, oil and food shocks, fiscal excess, and industrial unrest.

Given all this volatility, recession is a common topic of conversation among investors and companies. The general consensus? Avoid small cap stocks and stick to the so-called safer large cap companies.

In today’s weekly, we’re busting this myth by explaining why small cap is back and why exposure to this asset class is your best bet during a recession. We’ll begin with a brief trip down memory lane.

1970s – Small caps shine amid economic volatility

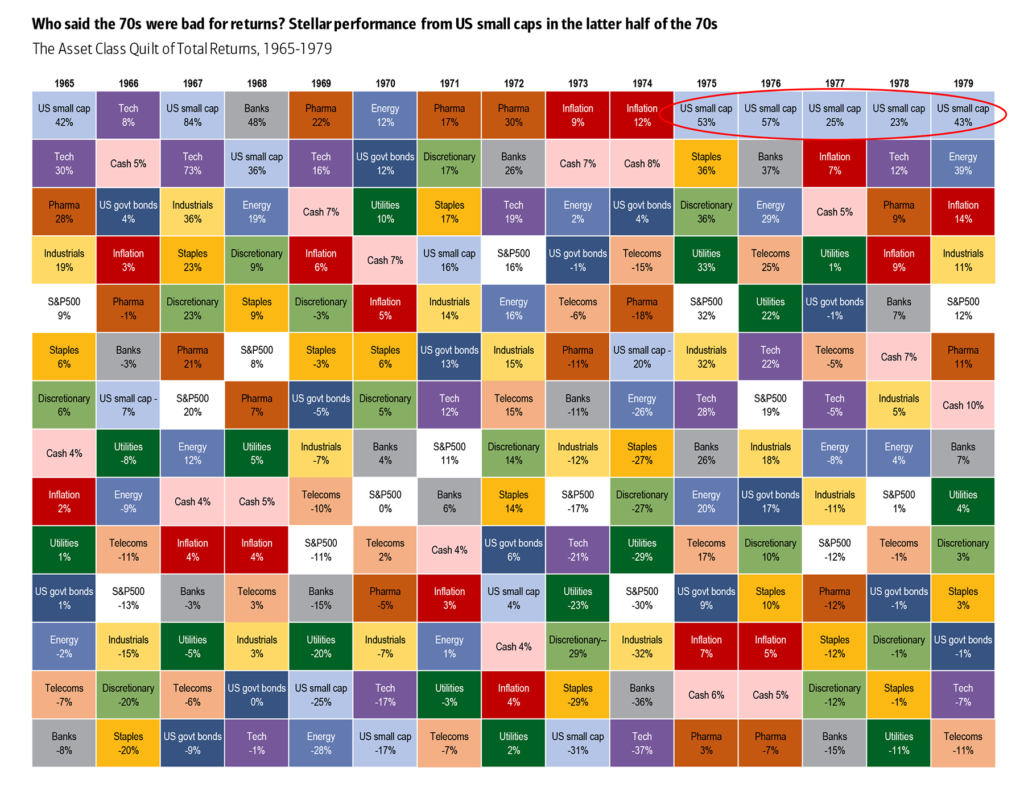
Investors assume that for small cap to outperform, we need economic certainty, lower rates and better credit conditions. But history proves otherwise. The 1970s were one of the best decades for small cap, and yet this era was plagued with a wide variety of economic volatility.

Throughout the 70s, inflation averaged 7.1% with a high of 13.3%. Fed rates peaked at 14% in 1979 from 3.5% in 1971. The economy faced oil shocks, embargoes, and taxes were high. Real economic growth was below the previous decade by 1%, and productivity was even lower. Meanwhile, President Richard Nixon became the first U.S. president to resign, and the dollar abandoned the gold standard and devalued.

Incredibly, in the midst of all this uncertainty, small cap outperformed large. Why?

Table showing stellar performance from US small cap in the latter half of the 70's.
Source: BofA Global Investment Strategy, Bloomberg

Why small cap succeeds during unexpected inflation

What really helped small cap outperform during the 70s was the unexpected inflation. According to Aswath Damodaran, a finance professor at NYU Stern, there are two reasons why unexpected inflation benefits small cap companies.

  1. Nimbleness in price adjustments – Large cap stocks, with their layers of management, have very entrenched pricing models. On the contrary, small cap can quickly change pricing structures to reflect the new inflationary environment. Hence, small cap reports much better margins.
  2. Less long-term investment projects – Large cap generally undertakes investment projects, which can have a 10 to 30-year timeline. They need to think much longer term just to maintain their growth rates. The problem is during high inflationary and interest rate environments, the Net Present Values for the projects drop drastically as cost and revenue inputs change. By contrast, small cap companies are in growth ramp-up mode and have a long runway for potential expansion.

Why is now the time to buy small cap?

With inflation at 8.3%, the probability of a recession in the U.S. is almost certain. Earning season is already indicating lower earnings growth, especially for large caps.

Meanwhile, central banks are raising rates across the globe. It goes without saying, we are in a very uncertain economic environment. So let’s break down the top seven reasons to invest in small cap right now.

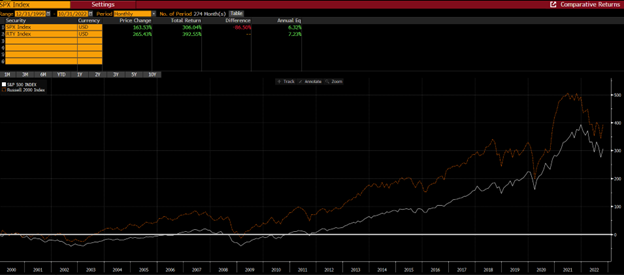
1. A history of long-term outperformance – small cap stocks have consistently outperformed large cap over the long term by a considerable amount.

Source: Bloomberg

2. Unexpected inflationary environment – The data shows that small cap consistently outperforms large cap during unexpected periods of inflation.

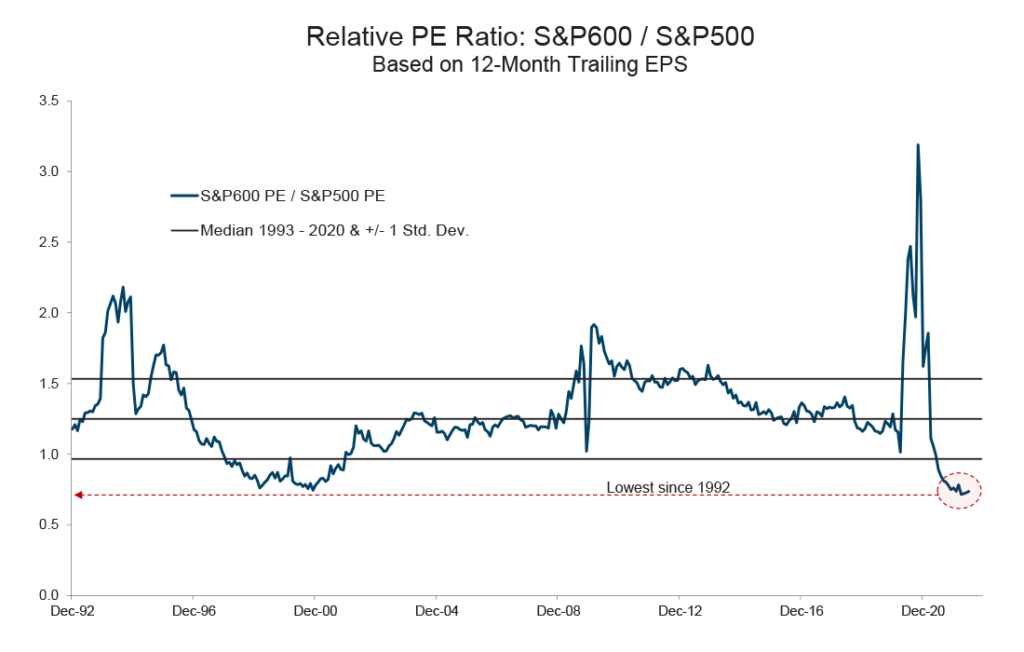
3. Valuation – Perhaps most compellingly, small cap is very cheap compared to large cap stocks. The below chart shows that the relative P/E of the S&P 600 (which excludes negative P/E stocks) versus the S&P 500 is the lowest since at least 1992.

Chart showing Relative PE Ratio: S&P 600 / S&P 500 based on 12-month trailing EPS.
Source: Bloomberg, William Blair Equity Research

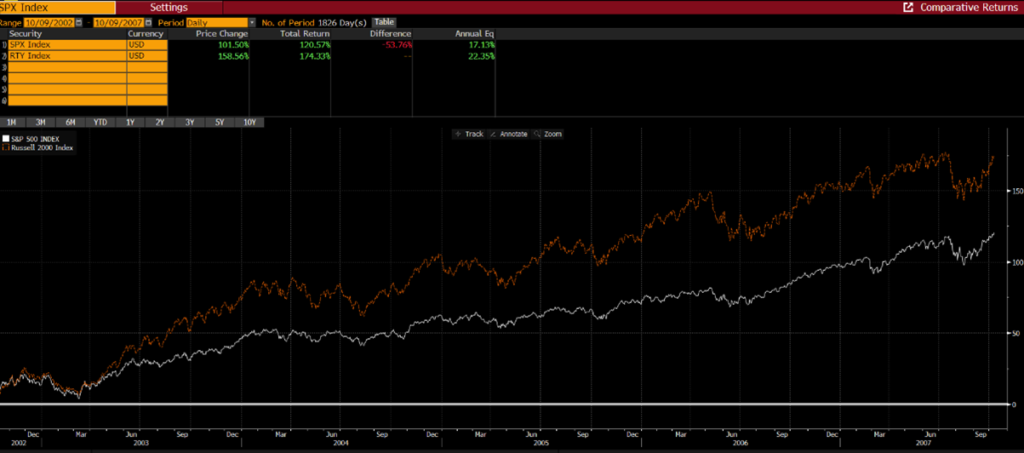
The story is similar if we look at the Russell 2000. The last time it traded at this depressed relative multiple to the S&P 500 was during the dot-com bubble burst. From 10/9/2002 to 10/9/2007, Russell 2000 outperformed the S&P 500 by more than 50%.

Source: Bloomberg

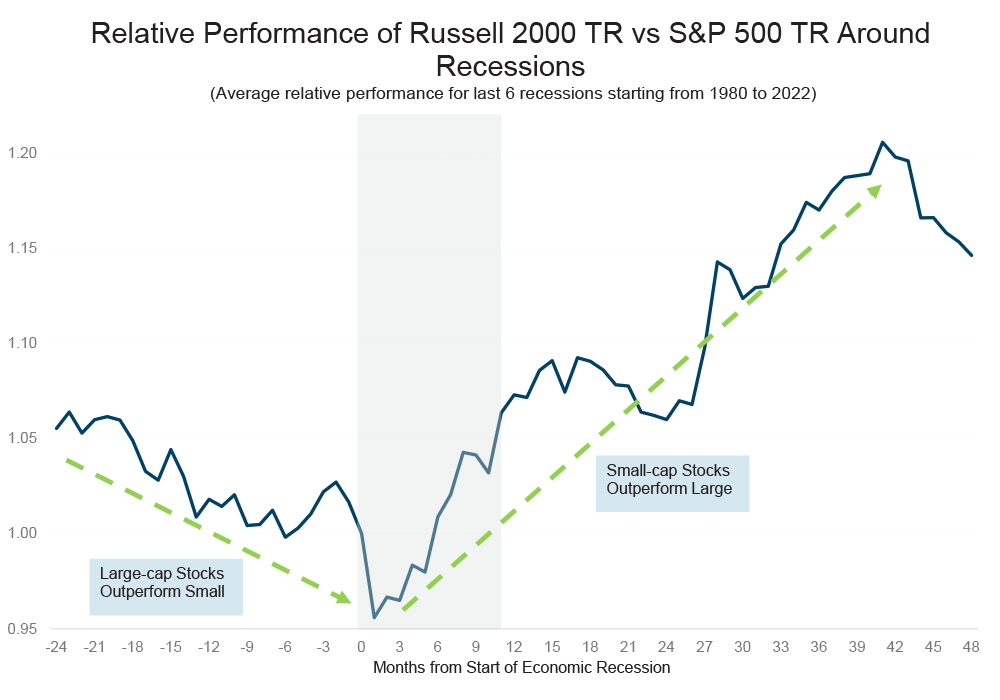
4. Small cap does well from early in the recession – While we do not know exactly when a recession will begin, it certainly feels like we’re getting close. So, getting exposure to small cap now would be a great idea for long-term investors. Small cap stocks have outperformed large cap in each of the previous six recessions that we have data for, going back to 1980.

Chart showing relative performance of Russell 2000 TR vs S&P 500 TR around recessions.
Source: Bloomberg, Willian Blair Equity Research

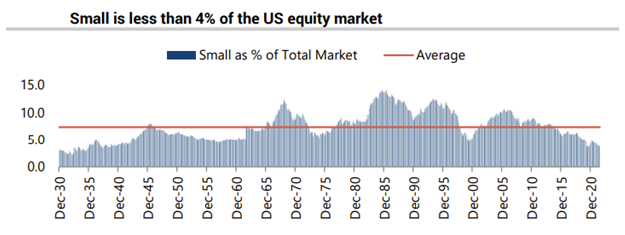
5. Low exposure – The percentage of small cap in the U.S. equity market now stands below 4%, a level last seen at the COVID bottom. Prior to this point, we must go back to the 1930s to see such little exposure to small cap. As investors will increase their allocation to the asset class, patient investors will be rewarded.

Source: Center for Research in Security Prices (CRSP®), The University of Chicago Booth School of Business; Jeffries

6. M&A is another consistent tailwind for small cap – Small cap represents approximately 95% of all deal volumes globally. The average acquisition premium is in the range of 35-40%.

7. Undercovered – Small cap is far less researched than large cap. Globally, small cap is covered on average by three brokers, versus 16 that cover the average large cap. There are hundreds of small caps in any region still not covered by a single broker. This provides bigger alpha opportunities for investors.

Final thoughts

When it comes to small cap outperforming large cap during recessions, we see the same trends play out across the globe. For example, valuations in Europe have dropped to levels last seen during the Global Financial Crisis (GFC).

So, now is the time to increase exposure to small cap, as most investors are underweight in this asset class. At Global Alpha, we are patient long-term investors who should benefit as small caps return to their historical outperformance and take a market leadership position.

1BoA Securities Global Research: The Flow Show – The Next Big Thing is Small, November 3, 2022

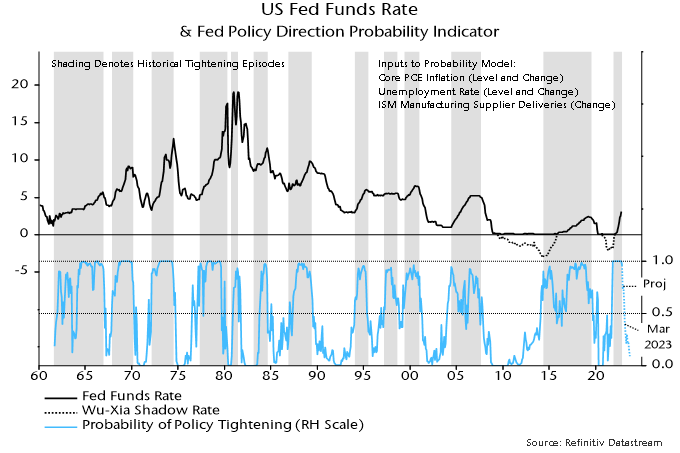
A simple model of the Fed’s past behaviour suggests a shift in policy direction from tightening to easing in March 2023, assuming that the economy evolves in line with its forecasts.

The Fed could delay cutting rates for several months but the model suggests a strong likelihood of action by Q3.

The model is based on the following observations / judgements about the Fed’s historical behaviour:

  • Policy direction alternates between tightening and easing and is rarely “on hold” for long.
  • Fed officials aren’t guided by a “target” level of rates; rather, they continue to tighten or ease until incoming data prompt them to stop / reverse.
  • The Fed places little weight on forecasts, focusing instead on recent trends in variables related to its mandate objectives.

The aim of the model is to estimate the probability that the Fed will tighten or ease in a particular month based on data available at the time of the decision. It does not attempt to predict the size of any move (although extreme probability readings suggest larger moves).

The model assesses the relative probability of tightening versus easing – “on hold” is excluded by design. As noted, periods of stable policy have been infrequent and usually short-lived historically. (The long period of Fed funds stability in the 2010s is misleading because the Fed was easing / tightening via QE and other “unconventional” policies during this period, as reflected in movements in “shadow” rates.)

To estimate the model, history was divided into alternating unbroken episodes of tightening and easing. This division was made judgementally based on the timing of peaks and troughs in official or shadow rates. Shaded areas in the chart below denote tightening episodes.

A decision was made to limit the model inputs to a small number of “obvious” variables, rather than cherry pick from a large data set to achieve maximum fit. The model, nevertheless, performs adequately, with the probability estimates consistent with policy direction in 88% of months (i.e. above 50% in tightening months and below 50% in easing months).

Chart 1 showing US Fed Funds Rate & Fed Policy Direction Probability Indicator

The key inputs are the levels and rates of change of core PCE inflation and the unemployment rate. The rate of change of the ISM manufacturing supplier deliveries index – an indicator of production bottlenecks – was also found to be significant.

The model assessment was that there was a 96% probability of tightening in November. This estimate incorporated a September number for core PCE inflation and October readings for the unemployment rate and ISM supplier deliveries.

The median forecast of FOMC participants in September was for core PCE inflation to average 3.1% in Q4 2023, versus 5.1% in September 2022. The unemployment rate was forecast at 4.4% in Q4 2023 versus 3.7% in October 2022. The probability projections in the chart assume straight-line movements in the two variables from their latest levels to the Q4 2023 forecasts. Additionally, the ISM supplier deliveries index is assumed to be stable at its October 2022 level.

The forecast probability of tightening falls to 74% in December, suggestive of a smaller rate hike of 50 or even 25 bp next month.

The first FOMC meeting in 2023 is on 31 January-1 February. The forecast tightening probability is little changed from its December level in January but falls further in February and moves below 50% in March – the 40% reading implies a 60% likelihood that the Fed will by then have shifted to an easing bias.

The implied easing probability increases further after March, exceeding 90% in September, suggesting a strong likelihood that the Fed will be cutting rates by then.

Alternative assumptions can be examined. If the unemployment rate were to rise to 4.4% in Q2 rather than Q4, the easing probability would reach 90% three months earlier, in June.

An unlikely worst case scenario is that core inflation and the unemployment rate remain at current levels. Interestingly, even in this scenario the tightening probability falls below 50% in April, fluctuating around the 50% level over the remainder of the year. (This reflects a downward pull from the rate of change terms, which offsets continued upward pressure from levels of core inflation and unemployment.)

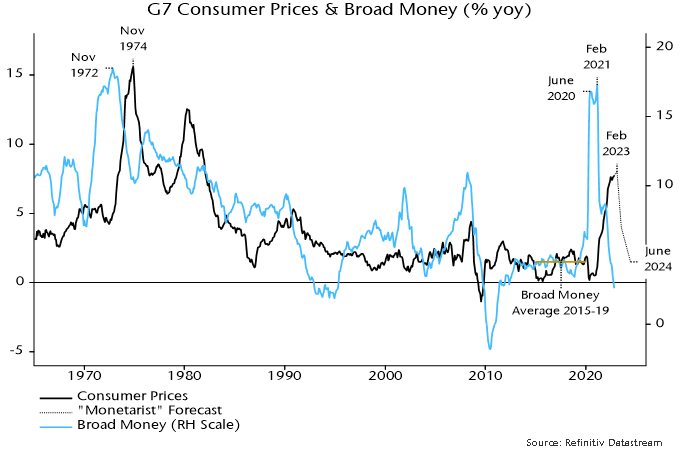
The “monetarist” rule of thumb that broad money growth leads inflation by two years suggests a rapid fall in G7 CPI inflation in 2023 and an undershoot of targets by H2 2024.

Annual growth of the G7 broad money measure calculated here is likely to have fallen below 3% in October, based on US and Japanese data. The money stock appears to have stagnated in the latest three months, with a contraction in the US offsetting weak growth elsewhere*.

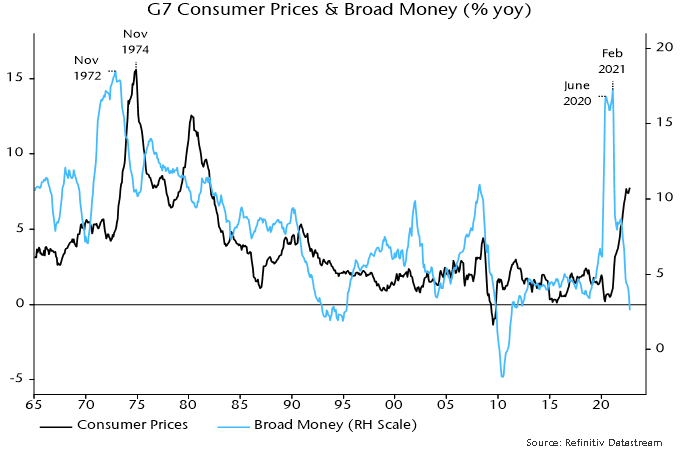
The monetarist rule worked perfectly in the early 1970s, when a surge in annual money growth to a peak in November 1972 was followed by a spike in annual CPI inflation to a high exactly two years later – see chart 1.

Chart 1

Chart 1 showing G7 Consumer Prices and Broad Money (% yoy)

Inflation fell sharply from its 1974 peak, mirroring a big decline in money growth in 1973-74. The difference from now is that annual money growth bottomed above 10%, resulting in inflation stalling at a still-high level.

The money growth surge in 2020-21 was almost complete by June 2020 but a final peak was delayed until February 2021. Consistent with the two-year rule, CPI inflation spiked into June 2022, since moving sideways. It may or may not make a final peak but the rule suggests that a major decline will be delayed until after February 2023.

Broad money growth averaged 4.5% in the five years to end-2019. CPI inflation averaged 1.9% in the five years to end-2021 (i.e. allowing for the two-year lag). Money growth returned to the 2015-19 average in June 2022 (4.4%). The monetarist rule, therefore, suggests that inflation will be back below 2% by mid-2024 and will continue to move lower later in the year, reflecting the further decline in money growth since June.

How fast will inflation fall? A reasonable assumption is that its decline will mirror the rapid drop in money growth two years earlier, consistent with the 1970s experience. An illustrative projection is shown in chart 2. Inflation, currently at 7.8% (October estimate), falls to 4% in July 2023 and below 3% by December.

Chart 2

Chart 2 showing G7 Consumer Prices & Broad Money (% yoy) with “Monetarist” Forecast

Some monetarist economists expect inflation to be stickier in 2023. They argue that there is still a monetary “overhang” from the growth surge in 2020-21. Inflation, according to this view, will remain high into H2 2023 to “absorb” this excess. The impact of current monetary weakness will be delayed until 2024-25.

The assessment here is that the overhang is much reduced and its removal is consistent with the optimistic inflation projection shown in chart 2 as long as money trends remain as weak as currently, which is likely.

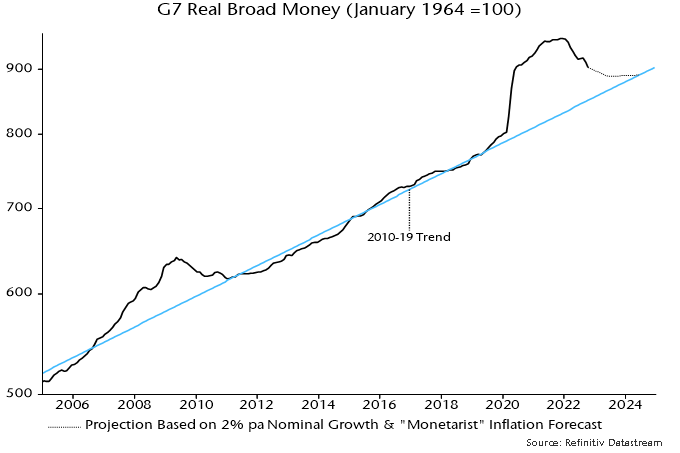
One measure of the monetary overhang is the deviation of the real broad money stock from its 2010-19 trend. This deviation peaked at 16% in May 2021 and has since narrowed to 6% as inflation has overtaken slowing nominal money growth – chart 3. 

Chart 3

Chart 3 showing G7 Real Broad Money where January 1964 = 100

The projection in chart 3 is based on the inflation profile in chart 2 and an assumption that broad money grows by 2% pa. The deviation of the real money stock from trend falls below 2% in H2 2023 and is eliminated by mid-2024.

Is the assumption of 2% money growth realistic? As noted, there has been no expansion in the latest three months.

As the chart shows, there was a larger deviation of real money from trend than currently at the end of the GFC in 2009. The adjustment back to trend was driven by nominal money weakness rather than high inflation – the money stock contracted by 1.9% between July 2009 and June 2010.

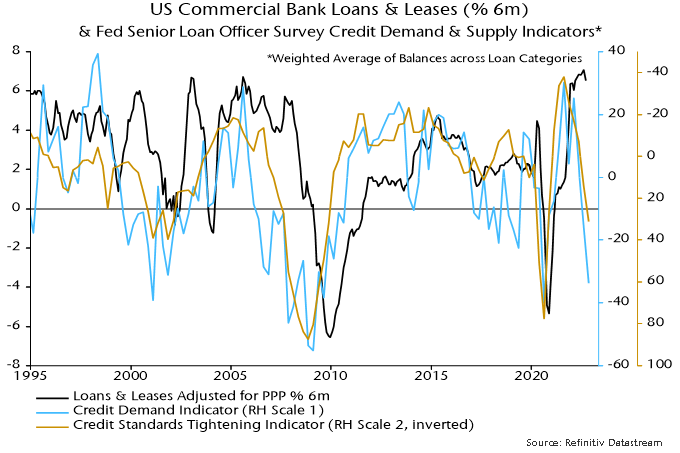
Bank lending has been supporting money growth but central bank loan officer surveys suggest a sharp slowdown ahead: October Fed survey results released this week echo weakness in earlier ECB and BoE surveys – chart 4.

Chart 4

Chart 4 showing US Commercial Bank Loans and Leases (% 6m) with Fed Senior Loan Officer Survey Credit Demand and Supply Indicators* *Weighted Average of Balances across Loan Categories

Continued monetary stagnation – or worse – would confirm that G7 central banks, with the honourable exception of the BoJ, have overtightened policies, compounding their 2020-21 policy error.

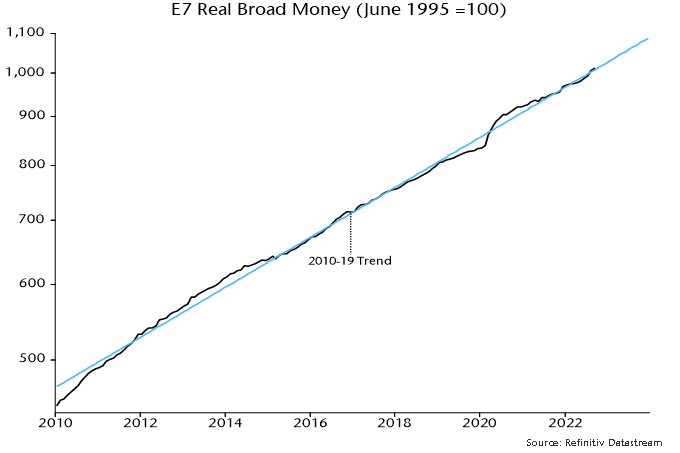
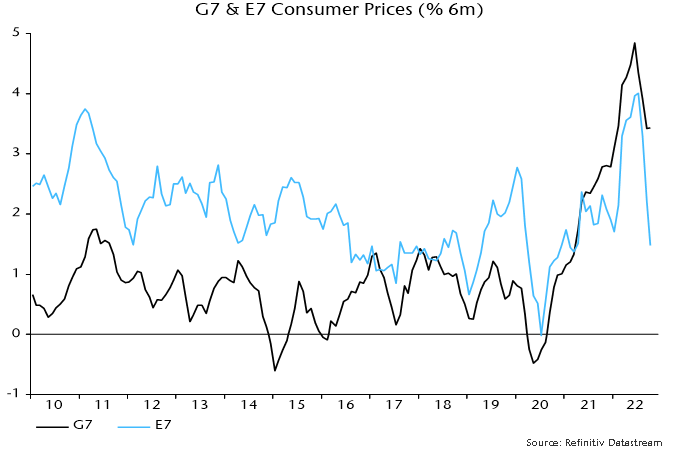
G7 monetary gyrations may be contrasted with relative stability around trend in E7** real broad money – chart 5. E7 central bank eased policies conventionally in 2020 and were quick to reverse course as economies rebounded and / or inflationary pressures emerged. This has been reflected in lower average inflation than in the G7 and a faster turnaround – chart 6.

Chart 5

Chart 5 showing E7 Real Broad Money where June 1995 = 100

Chart 6

Chart 6 showing G7 and E7 Consumer Prices (% 6m)

*Money measures used: US M2+ (M2 plus large time deposits and institutional money funds), Japan M3, Eurozone non-financial M3, UK non-financial M4, Canada expanded M2+ (M2+ plus non-personal time deposits).

**E7 defined here as BRIC plus Korea, Mexico and Taiwan.

Financial district of London and the Tower Bridge.

The UK has been going through an unprecedented time. From the death of the Queen, to three prime ministers in a little over two months, what the country needs now more than ever is stability and unity from both the new monarch and incumbent governing party.

A disastrous 44 days as prime minister by Liz Truss led to tremendous turmoil in the gilt and sterling markets. The pound hit a record low against the US dollar towards the end of September, forcing the Bank of England to step in and stabilize markets. 

New Prime Minister Rishi Sunak has an unenviable task ahead of him. While being the sole candidate to achieve enough support from MPs to stand for the Prime Minister position prevented further infighting within the Conservative Party, the fact remains that there are still factions and loyalties pitted against each other. With this as a backdrop, it is even more difficult to regain the confidence of voters ahead of the next general election. Latest opinion polls show the Conservative Party facing a 26-point deficit.

Perhaps the most difficult task of all will be to reassure investors and increase credibility concerning public finances. Initial reactions to Sunak’s appointment were positive due to some goodwill built up through his handling of COVID and furlough schemes as Chancellor, a reputation for being fiscally conservative and the belief that he and the current Chancellor, Jeremy Hunt, are both singing from the same hymn sheet. Contrary to his predecessor, Sunak has already stressed the importance of government policy working hand in hand with the central bank to combat inflation, while emphasizing the independence of the Bank of England over interest rate decisions.

The next financial statement, due on November 17, will go a long way to re-establishing some credibility. Difficult, but necessary decisions on increased taxes and spending cuts are to be expected. Even freezing income tax thresholds will see more people enter the income tax system, or into a higher tax band, due to the wage inflation currently being experienced. Only one area has been designated as off limits for cuts – the National Health Service. Other areas such as welfare, education and­—perhaps controversially given the current geopolitical environment, defense—could be in the firing lines, as well as reviewing the HS2 rail project. 

Fiscal responsibility is at odds with regaining the favour of the voting public. Just this week the Bank of England hiked interest rates by 75 basis points to 3%, the largest hike since 1989, and said that the UK is potentially facing its longest ever recession. Unemployment is expected to almost double, albeit from its lowest level in 50 years.

The instability surrounding the UK government and future economic prospects means investors want a discount on UK equities to compensate for current additional risk and uncertainty. However, based on the forward price-to-earnings ratio, the UK is at its lowest valuation versus global peers since records began. The attractive valuations combined with weak sterling and/or strong dollar leads us to believe that there is a significant opportunity for international and more specifically U.S. corporates or financial institutions to increase takeover activity. Longtime holding, Clipper Logistics (CLG.LN), was acquired by U.S. peer GXO Logistics (GXO.US) earlier this year. Current holding, Biffa (BIFF.LN) is being acquired by a private equity firm, with the transaction expected to close by the end of Q1 2023 at the latest.

The larger question is if there remains compelling reasons to own UK equities right now given the warning of a deeper recession than other regions. We would argue that this is a good environment for bottom-up fundamental stock pickers. Some quality international companies are now available at a significant discount. The FTSE 100 derives around 70% of its revenues internationally, while the FTSE 250 is at 50%.

When looking at our holdings in the UK, we have a diverse mix of companies, many of which have diversified their source of revenues away from just the UK. Often the market leaders can capitalize in economic downturns and increase market share while competitors struggle. This could also be the case for our holdings, briefly summarized below.

Our UK holdings with significant overseas revenues include:

Coats Group (COA.LN) is the world’s leading industrial thread manufacturer with market-leading position in apparel and footwear, plus a leading and growing position in performance materials. The company derives the overwhelming majority of its revenues from Asia and the Americas.

IWG Pls (IWG.LN) is the world’s largest provider of hybrid workspace with a network of 3,323 locations across 120 countries. The UK accounted for 16% of group revenues in 2021.

Oxford Biomedica (OXB.LN) is a leading cell and gene therapy group and does not disclose the geographical segmentation of revenues.

Safestore (SAFE.LN) is the UK’s largest self-storage group with 130 stores located in the UK and 48 stores located in Europe, mostly in Paris but with locations in the Netherlands and a growing presence in Spain. Around 25% of revenues come from overseas.

Savills (SVS.LN) is one of the leading real estate advisors in the world with 57% of revenues coming from outside the UK.

Our UK holdings with largely domestic revenues include:

Biffa (BIFF.LN) is a UK-based waste management company whose operations include collection, recycling, treatment, disposal and energy generation. As mentioned above, the company is in the process of being acquired.

CVS Group (CVSG.LN) is one of the largest integrated veterinary services providers in the UK (plus a small presence in the Netherlands and Republic of Ireland). The firm has four main business areas: veterinary practices; diagnostic laboratories; pet crematoria; and e-commerce (non-prescription medicines, pet foods and pet care products).

Onesavings Bank (OSB.LN) is a UK specialist lender which targets market sub-sectors that are underserved by the mainstream banks, most notably the professional landlord buy-to-let market.

Printed circuit board and chip.

In the past year or two, semiconductors have been under the spotlight across industries and countries, even in our everyday conversations. People around the world have started to realize just how much this small component affects their daily lives in significant ways, from long lead times in car purchasing, to being unable to get hold of a PS5 game console. Modern defense capabilities also rely on sophisticated electronics systems powered by advanced semiconductor components. No wonder semiconductors are considered the new oil, given their wide-spread consumer, military, and strategic significance.

However, the key difference is that chipmaking is even more concentrated geographically than oil production. The three biggest oil producing countries, the United States (U.S.), Russia, and Saudi Arabia, accounted for 15%, 13% and 12% respectively of global production in 2021. Taiwan, on the other hand, supplies 20-25% of the world’s semiconductors every year, while the U.S. only accounted for 12% in 2021. When it comes to leading-edge chips (10 nanometers and smaller), Taiwan has 92% of global production capacity. Meanwhile, China is expected to emerge as a leading player in chip manufacturing. The country plans to add about 40% of the global new capacity by 2030 and is expected to reach 24% of world’s total capacity by that same year, according to Semiconductor Industry Association. China’s potential leading position has raised concerns that it might threaten the economic advancement and national securities of other countries, especially the U.S.

In light of these threats, the U.S. government has been tightening regulations on chip exports to China. Last month, on October 7, the U.S. Department of Commerce announced reinforced regulations on cutting-edge semiconductor technology exports to China. Export controls to China already existed before this new round. So what’s new this time, and why has the market been so nervous about it? Well, this new set of restrictions have been broadened substantially. First, the expanded list of restricted exports to China now includes the most cutting-edge chips as well as chips that are one to two generations behind the cutting edge. In addition, the new rule restricts the ability of Americans to support the development or production of Integrated Circuits (ICs) at China-located semiconductor fabrication facilities without a license.

The cumulative effects of these restrictions could have major implications on the industry. For example, many scientists and engineers with U.S. citizenship or permanent residency work in the Chinese semiconductor industry, including several top executives in Chinese companies. The new controls will likely force them to choose between their U.S. citizenship or their jobs.

The new rules will affect Chinese companies the most. Without new supplies of equipment from the U.S., Chinese chipmakers could be unable to expand their production lines and wind up stuck with existing capacity for the time being. Even for existing capacity, they may not be able to get maintenance services from the U.S. suppliers, which could affect the quality of the products.

The global market for wafer fabrication equipment is also expected to be hurt by these regulations. According to Jefferies, total investment value by Chinese companies in this market in 2022 is projected to be US$18 billion. This makes China the largest investor in this global sector by far.[1] However, the impacts of these new regulations on chip exports might affect around US$5 billion of Chinese investments in wafer fabrication.

American companies could suffer as well. China is the largest market for the three biggest U.S. semiconductor equipment manufacturers, accounting for roughly 30% of the revenue at Applied Materials, Lam Research and KLA Corp. Applied Materials declared the new regulations will reduce its fourth quarter net sales by US$250–$550 million, and a similar impact is to be expected for the following quarters. Applied Materials’ 2021 annual sales, as a reference, was about US$23 billion. Similarly, Lam research also warns the U.S. ban could lead to sales loss of US$2–$2.5 billion in 2023 (their 2021 annual sales was about US$17 billion).

Japan also has a major presence in the semiconductor production equipment (SPE) industry. At present, Japanese companies are not subject to regulatory constraints if U.S.-made parts and software are 25% or less of their products. This may potentially give Japanese SPEs a boost versus their U.S. counterparts. However, a regulation-induced slowdown of investment by Chinese companies could eventually diminish overall orders with Japanese SPEs.

What is the potential impact of all this on our portfolio?

While we do not invest in semiconductor manufacturing companies directly, a few companies we invest in Japan do have semiconductor equipment manufacturers as their clients.

Horiba (6856 JP) is a Japan-based manufacturer of measurement equipment. We have introduced their automotive emission measurement business in previous commentaries. Horiba is also a leading supplier of mass flow controllers, with 60% global market share. Their measurement equipment is used to regulate gas and liquid flow rates and is a key component in the production of high-quality semiconductors. Over half of the segment revenue comes from their Japanese customers, but Lam Research and Applied Materials are also among their key customers. The revenue from its semiconductor segment is over 40% of total revenue, the demand for this segment has been strong, and the company has revised up its 2022 guidance as a result. Horiba will report its third quarter result on November 11 and is expected to comment on the impact of the new regulations.

Kurita Water (6370 JP) is a Japanese manufacturer of water treatment equipment and chemicals. There is a growing need in the water treatment industry for advanced, comprehensive solutions, especially in the semiconductor and electronics manufacturing industries. Kurita is the only company in the world that has businesses in both water treatment chemicals and facilities. The company is the leading manufacturer in the water treatment industry in Japan, and over the past several years, Kurita has expanded its presence in the U.S. and European markets. As the semiconductor makers and other U.S. high-tech companies are bringing production bases home, this will present Kurita with business opportunities. There are still many uncertainties on the magnitude of this new set of restrictions and its potential impact. We will provide updates in future communications as we gain more clarity.


[1] Masahiro Nakanomyo, “Impact of Stricter US regulations on Exports to China”, Jefferies, Oct 16, 2022