US September non-farm payrolls blew through the consensus expectation but the totality of evidence from the employment report suggests that the labour market continues to cool.
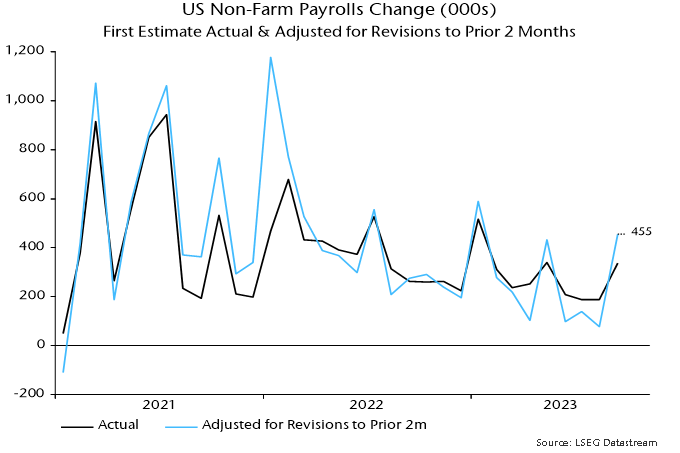
Including upward revisions to the prior two months, 455,000 jobs were added to the payrolls tally in September. However, this follows three weak months when the revisions-adjusted gain averaged 105,000 – see chart 1.
Chart 1
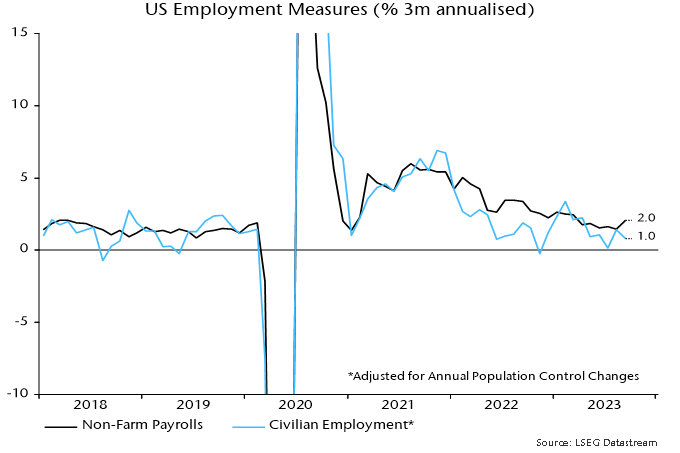
The alternative household survey employment measure – which counts people rather than jobs – grew at half the pace of payrolls in the three months to September – chart 2.
Chart 2
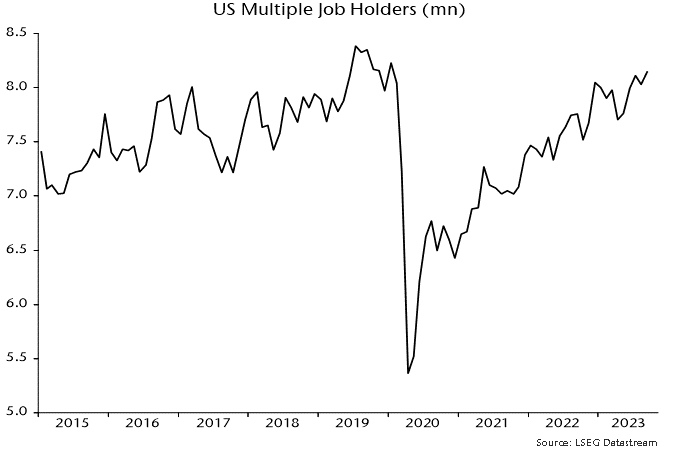
The relative strength of payrolls partly reflects a further rise in multiple job-holding, which is approaching its pre-pandemic peak, i.e. the relative boost may be ending – chart 3.
Chart 3
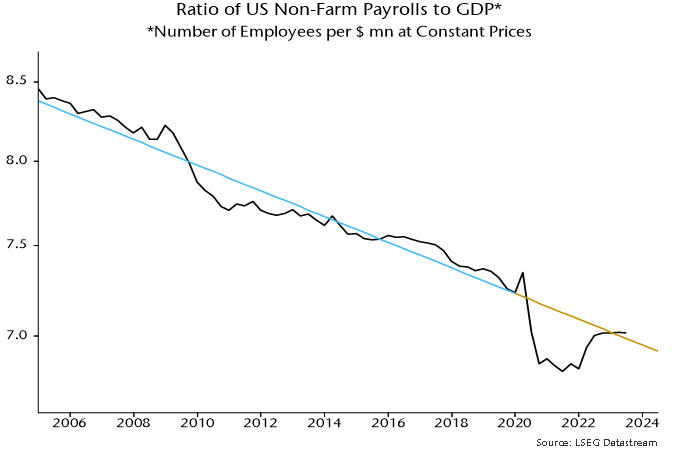
Stepping back, stronger growth of payrolls than GDP since end-2021 represents a catch-up following a big undershoot of trend during the pandemic – chart 4.
Chart 4
The catch-up appears complete, suggesting that payrolls will resume slower growth than GDP. The slope of the trend line implies a fall in payrolls if GDP growth declines below 1% annualised.
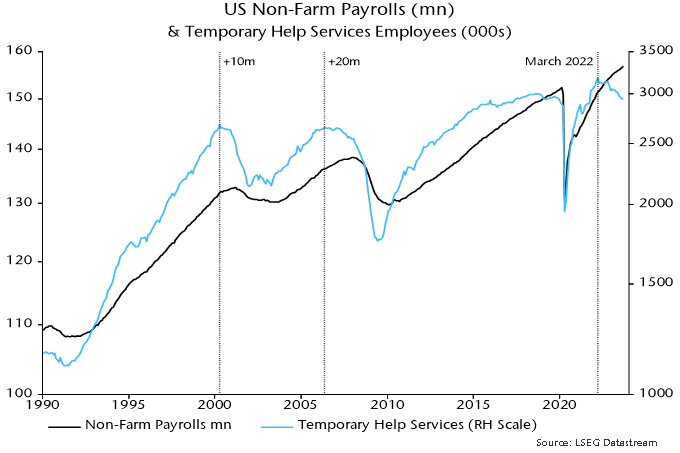
Temporary help jobs have led at prior peaks and troughs in payrolls and continued to decline in September – chart 5.
Chart 5
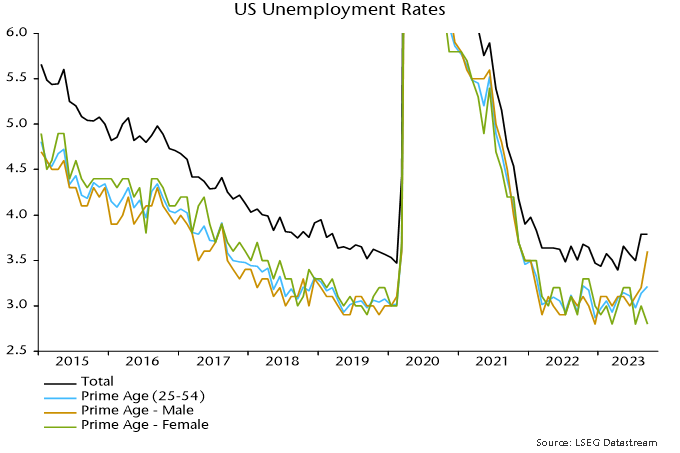
The unemployment rate, meanwhile, held at its higher August level, with the demographic breakdown showing a sharp jump among prime-age males – chart 6.
Following my trip to China in May 2023 and my recent commentary from June, I believe it is important to continue to share our thoughts on China, especially in light of recent disappointing economic developments and the new policy measures aimed at addressing its slowing economy.
Have we reached peak pessimism about China?
The real estate sector, along with its related industries, accounts for 20% to 30% of China’s GDP and has failed to rebound as expected. From January to July, real estate investment fell 8.5% year-on-year. Residential building areas deceased by 7.1% and total new construction areas declined by a quarter according to the National Bureau of Statistics.
China’s government has announced a slew of measures in the past few months to stimulate the sector, including:
Fiscal incentives: The Ministry of Finance on Aug. 18 extended personal income tax rebates for households upgrading their apartment until the end of 2025.
Mortgage easing: Banks no longer exclude those who have a repaid a mortgage from qualifying as first-time buyers if they don’t currently own a property. Big cities including Guangzhou and Shenzhen adopted this policy on Aug. 30.
Home-loan cuts: Starting Sept. 25, first-time homebuyers can renegotiate their mortgage interest rates, as announced by the central bank on Aug. 31.
Downpayment reductions: On Aug. 31, Beijing lowered the minimum downpayment ratio across the country to 20% for first-time homebuyers and 30% for second purchases.
Urban renewal: The State Council announced redevelopment support for older villages within mega cities. Metropolises including Shanghai and Guangzhou are following up.
Other measures: These include a nationwide cap on real estate commissions, allowing private equity funds to raise capital for residential property developments, pledging ¥200 billion (CDN$28 billion) in special loans to complete stalled housing projects and extending some of the 16-point plan to address liquidity issues in the sector.
We should soon find out if these measures prove adequate. The Mid-Autumn Festival from Sept. 29-30 followed by a week-long holiday from Oct. 1-6 for National Day is traditionally the busiest period of the year for real estate sales. But what if the bubble continues to deflate? Could it lead to a collapse contained within China or a long stagnation like Japan experienced? Or to something more globally damaging similar to the Great Financial Crisis of 2008?
Will China crash?
Contrary to these fears, we do not see a huge financial crisis in China. The country is a major creditor, most of its debts are in its own currency and the government controls all of the key banks.
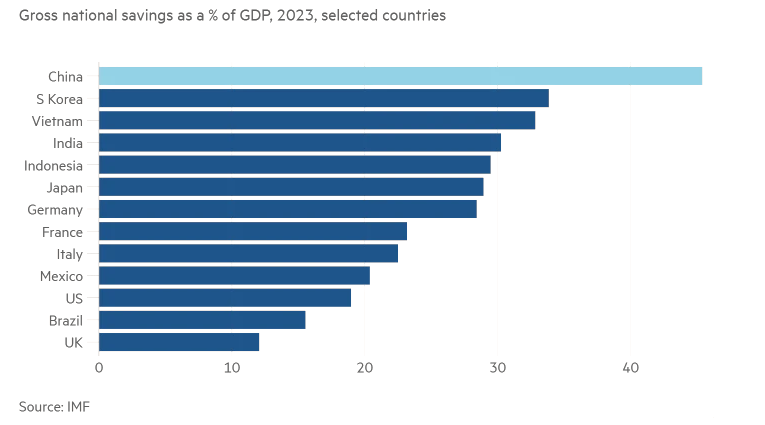
The current risk is the elevated savings rate, which could weaken demand.
Is China’s economic situation a repeat of Japan in the early 90s?
China today and Japan 30 years ago share many similarities: high debt levels, an aging population and a property bubble pop after years of growth. But China’s asset bubbles are comparatively smaller. And, in some cases, one could argue that the US also is in bubble territory. The following table is quite telling:
China
US
Japan (1990 peak)
Property value/GDP
260%
180%
560%
Stock market/GDP
65%
151%
142%
Urbanization rate
65%
83%
77%
Debt/GDP
95%
122%
62%
Source: World Bank and IMF.
Is it all bad? Can China bounce back?
China’s economy was supposed to drive a third of global economic growth this year. Its recent slowdown is sounding alarm bells across the world. According to an International Monetary Fund analysis, when China’s growth rate rises by 1 percentage point, global expansion is boosted by about 0.3 percentage points. Asian economies, along with African countries have been most affected by diminished trade. For example, Japan reported its first drop in exports in more than two years in July after China cut back on purchases of cars and semiconductors. Central bankers from South Korea and Thailand last week cited China’s weak recovery as a reason for downgrading their growth forecasts. The value of Chinese imports has fallen for nine of the last 10 months as demand retreats from the record highs set during the pandemic. The value of shipments from Africa, Asia and North America were all lower in July than a year ago. But is the situation as dire as appears? Some indicators seem to tell a different story.
The price of oil is approaching $100. According to a September report by OPEC, global crude oil demand is expected to reach a record 102.06 million barrels per day in 2023, up 2% from 2022. Demand in China, the world’s second-largest crude oil consumer, is projected to grow by 6% to 15.82 million barrels, an upward revision of 50,000 barrels from August. Official customs data shows that China’s crude oil imports in August reached 52.8 million tons, up 21% from the previous month. This translates to a 31% year-on-year increase and a 25% rise over pre-pandemic levels in August 2019. With overseas travel from China still not back to pre-pandemic levels, further growth in demand for crude oil and petroleum products could be expected as noted by Dominic Schnider, UBS’s head of commodities and Asia-Pacific currency markets.
In terms of metals, China’s refined copper consumption was the second-strongest year to date in August, a month when demand would typically weaken due to hot weather. This was reflected in a 36.6% increase month over month in China’s copper concentrate imports in August.
China’s aluminium imports jumped 38.9% in August from a year earlier, customs data shows. Imports of bauxite, a key raw material for aluminium, totaled 11.63 million tons last month, up 9% from the year prior. Bauxite imports in the first eight months of the year, at 96.62 million metric tons, were up 11.8% from a year earlier.
In our last commentary on China, we highlighted how it is trying to transition its economy away from real estate, infrastructure and exports to a more sustainable model led by domestic consumption, services and tourism. There is a lot of potential to unleash tremendous growth if Chinese consumers decide to increase their spending.
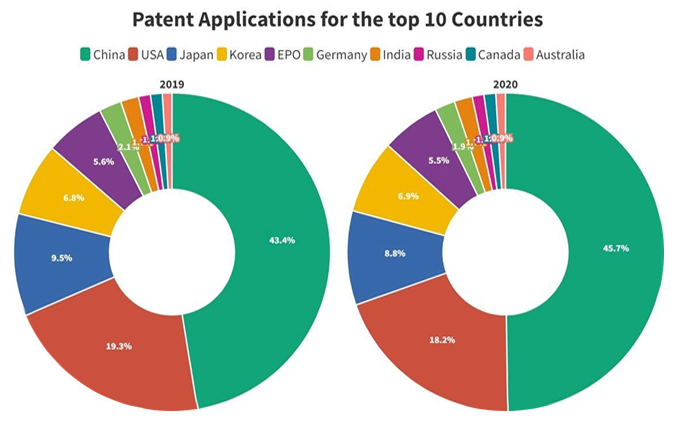
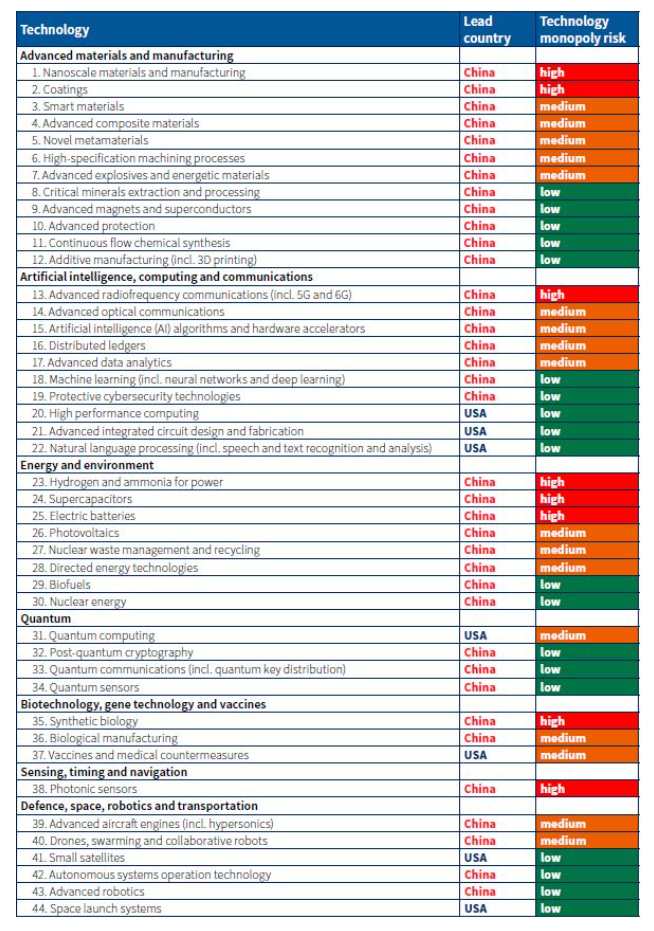
A study by the Australian Strategic Institute earlier this year showed that China leads in 37 of 44 tech fields, ranging from AI to robotics. China graduates 1.4 million engineers each year and leads the world in patent applications.
Source: World Economic Forum.
Technology fields and leading countries
Source: Australian Strategic Institute.
So, while there is a case for optimism, what if relations between China and its trading partners continue to deteriorate. What if trade barriers go up?
Who could replace China as a global economic engine?
Policymakers in the West may view a China slump as a geopolitical respite, but it raises a significant question: what are the global repercussions if China’s economy were to permanently stagnate?
According to World Bank data, China GDP grew by 263% between 2008 and 2021, while global growth was only 30%. China accounted for more than 40% of global growth during that period. Although some experts have pointed to India as a possible successor, it’s not a given. India’s manufacturing sector has contracted in recent years and private investment accounts for a smaller share of GDP than it did a decade ago.
Could this signal the end of global economic growth?
Global growth by period
1962-1973
5.4%
1977-1988
3.3%
1991-2000
3.0%
2009-2023
65%
Source: Capital Economics
We do not think the China growth story is over and believe the China pessimism is too extreme.
Global monetary trends appear inconsistent with economic expansion and recent levels of financial asset prices. Central banks are likely to be forced to reconsider policy stances, by market / financial instability and / or unexpected economic weakness.
Key developments during Q3 included:
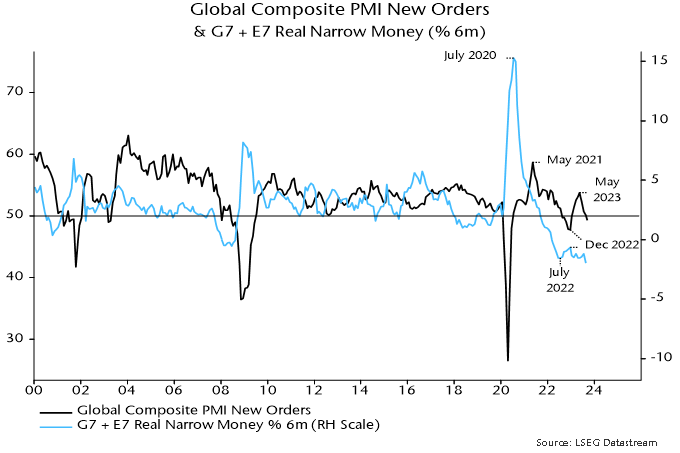
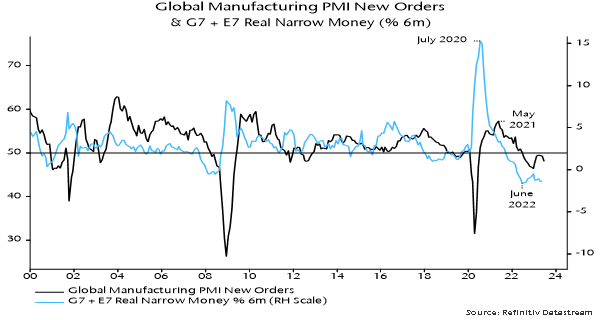
Global composite PMI new orders – a timely indicator of economic momentum – extended a decline from a local peak in May.
Global six-month real narrow money momentum fell to a new low, suggesting a further PMI slide into early 2024 – see chart 1.
Inflation news was favourable, with US and Eurozone core momentum slowing significantly.
Major central banks ignored these developments, tightening policies further and signalling “higher for longer”.
Hopes that Chinese easing would act as a counterweight to G7 restriction were dashed by the PBoC allowing money rates to firm significantly into quarter-end, perhaps reflecting concern about capital outflows.
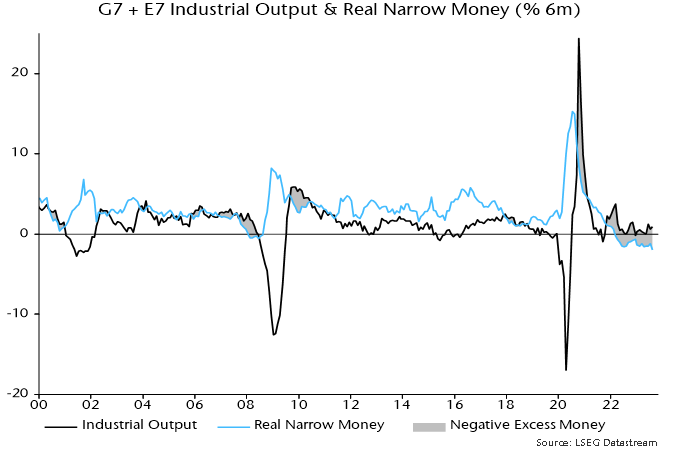
Global “excess” money momentum, as measured by the differential between six-month rates of change of real narrow money and industrial output, became more negative – chart 2.
The stock of excess money, i.e. the ratio of real narrow money to industrial output, fell to its lowest level since February 2020 before the covid policy response and associated monetary surge.
US real Treasury yields extended a third major move higher since late 2021, interpreted here as reflecting the intensified excess money squeeze coupled with higher for longer guidance.
Global equities gave back most of their Q2 gain as higher real yields dragged valuations lower.
The yield surge contributed to underperformance of growth and non-US quality while restraining outperformance of defensive sectors.
Chart 1
Chart 2
Current and prospective monetary trends appear too weak to support recent levels of economic activity and market wealth. Two scenarios for relieving the monetary shortage may be considered.
In the better scenario, a further fall in inflation coupled with modest weakness in activity results in global excess money contraction moderating into end-2023, with an associated reversal lower in real yields. (Equity market performance is related to the sign of the level of excess money momentum while yield movements are related to the sign of the rate of change.)
Inflation progress and softer labour market data prompt central banks to retract higher for longer guidance and cut rates in early 2024, extending the move lower in yields. Falling yields support growth and quality, limiting weakness in equity indices.
Lower rates revive nominal money momentum in H1 2024, laying the foundation for an economic recovery during H2. Inflation continues to fall as core / wage pressures fade, moving to an undershoot in late 2024 / 2025 in lagged reflection of monetary weakness in 2022 / 2023.
Equity markets recover during H1 2024 as excess money momentum turns positive. Near-term outperformance of defensive sectors reverses as improving economic prospects for late 2024 / 2025 lift cyclical areas.
The suggestion in this scenario of modest / short-lived economic contraction is consistent with the cyclical analysis framework employed here: major downturns in the housing and business investment cycles are not expected before 2025, while the stockbuilding cycle is scheduled to recover in 2024.
In the worse scenario, recent policy tightening and surging yields result in a further fall in nominal money momentum, offsetting the impact of lower inflation and declining activity on real / excess trends.
Real yields are stickier and equity markets fall further, with defensive sectors outperforming significantly.
Intensified economic weakness and an ongoing monetary shortage trigger one or more credit “events”, raising financial stability concerns. Central banks cut rates but are viewed as having lost control. Investors price in a tail risk of excessive easing and another inflation surge later in the decade.
Inflation falls faster and further than in the better scenario, contributing to a larger eventual decline in rates and Treasury yields. The beneficial effect on monetary trends, however, is delayed by “endogenous” tightening via wider credit spreads and wealth losses.
The suggestion in this scenario of significant multi-quarter G7 recessions could be reconciled with the cycles framework by arguing that the rate shock advanced the housing cycle peak expected around 2025, i.e. the downswing will play out over 4-5 years rather than a more normal 2-3.
The subjective probabilities assigned here to the two scenarios will be adjusted in response to incoming nominal money data.
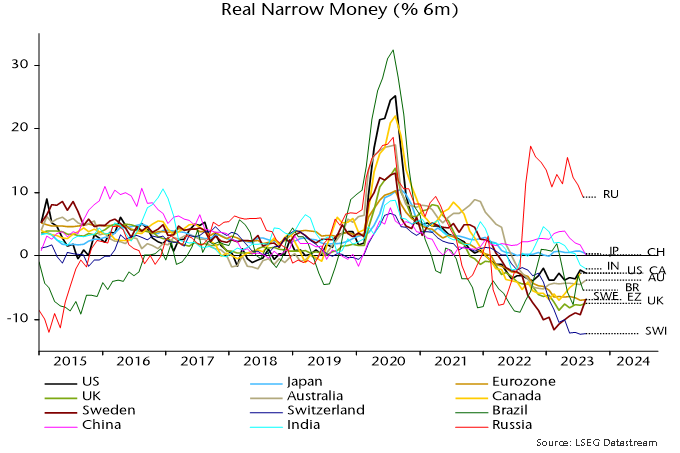
The further fall in global six-month real narrow money momentum in Q3 was mainly attributable to declines in China and India, confirming a need for PBoC easing and questioning consensus optimism about Indian economic prospects. Momentum remains weaker in Europe than the US – chart 3.
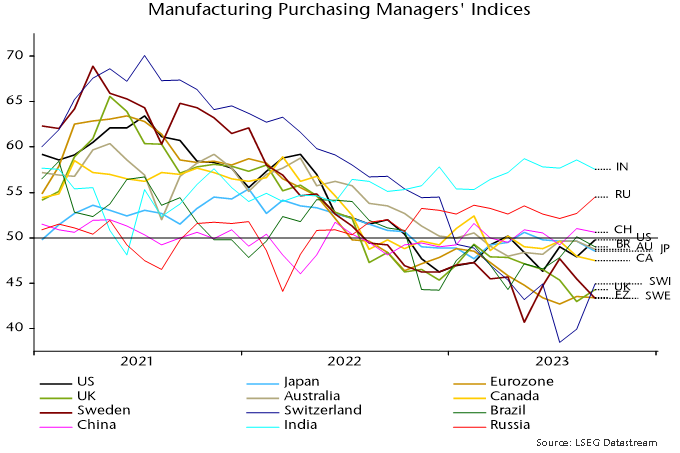
September manufacturing PMI results are broadly consistent with the real money momentum ranking – chart 4 (rank correlation coefficient = 0.76). Minor anomalies include India, Brazil and Switzerland (downside risk to current PMI ranking suggested by money trends), and Japan and Sweden (upside).
Chart 3
Chart 4
Summary
EM equities were down through the month, with Chinese equities continuing to drag.
Foreign investors dumped over US$3 billion of Chinese stocks through the month, despite better-than-expected retail sales figures (up 4.6% year on year) and industrial production numbers (up 4.5% year on year) for August.
Manufacturing PMIs also ticked up to 49.7 from 49.3 (above 50 points signals expansion).
New issues from Chinese banks also surged, beating expectations.
Industrials, staples and communications names in India outperformed wider EM, as did AI-linked semiconductor names in Taiwan and Korea.
Don’t look down
Is this the Wile E. Coyote over the canyon moment for markets? The delayed impact of vertiginous rate hikes across DMs on all maturing debt is now hitting consumption and investment. Yet central banks continue to talk tough and market pundits fret over the implications of “higher for longer rates.” It certainly feels like we are in a critical juncture for markets and the economy. Resilience of assets outside of fixed income appear out of step with the reality of higher rates and a weakening global economy, as illustrated by global PMIs falling for a fourth consecutive month.
Poor money numbers globally suggest that further economic contraction is likely. Despite this, central banks continue to talk tough on rates and many investors cling to hopes of a no landing/immaculate disinflation scenario unfolding, despite the cracks emerging in the global economy.
Echoes of the GFC
Some market commentators are comparing the complacency in markets to the 2006-7 period where investors bought into the idea of a soft landing, just as the lagged effect of excessive interest rate hikes began to roll through the economy.
JP Morgan’s Marko Kolanovic was quoted in the UK’s Financial Times noting the magnitude of change in interest rates in this cycle is around 5x the increase over 2002-2008 (FT Alphaville: Is it good when Wall Street compares today to 2007?). Kolanovic also pulled archive strategy commentary from 2007 which speaks to some of the risks markets face today:
“The economy provides compelling evidence that it is more resilient than many had earlier believed. … [R]enewed momentum is confirmed as economic data over the balance of December 2006 and January 2007 show an economy shaking off the effects of higher interest rates and high commodity prices. Market participants give up the ghost on their hopes for easings, accept that the Fed has engineered a soft landing, and buy (literally) into the view that a Goldilocks economy is in the making. Economic growth is solid at around 3% and led by a reinvigorated consumer; the residential housing sector slowly stabilises; corporate earnings growth moderates but doesn’t collapse; and inflationary pressures ease off but do not dissipate. Risky assets trade at full valuations and remain in a narrow, low vol range. We’ll call this the “head fake” phase — everything feels too good to be true because it is. In case you didn’t notice, this is where we are right now.”
As the article notes, history tends to rhyme rather than repeat and the availability heuristic of taking short cuts through sketchy historical analogies to explain the situation today can lead investors astray.
Indeed, the 1970s were a far from perfect comparison to post-pandemic inflation – we were flagging last year that a crash in broad money numbers would see inflation rattle back and even undershoot in 2024 (see chart below). This forecast remains on track despite the anxiety over rising energy prices. In contrast, broad money (our primary leading indicator for inflation) remained persistently high in the 70s.
In the pre-GFC era, central banks were signalling their commitment to keeping inflation in check while acknowledging that stresses in the system were starting to materialise. Talking tough today about “higher for longer” rate settings looks to us like the equal and opposite error to the excessively loose policy coming out of COVID lockdowns.
We question the widely held assumption that the global economy can muddle through without any shift in monetary policy in the months ahead. Our best bet is that global economic growth is likely to surprise to the downside in the next 3-6 months.
Green shoots
However, there is a silver lining. Unlike in 2007, most of the debt resides with governments and central banks rather than corporates and households. Price insensitive authorities can “extend and pretend”, socialising losses and thus providing some cushion to the impact of rate hikes. It may suggest why rapid rate increases haven’t yet bitten as hard as we initially expected.
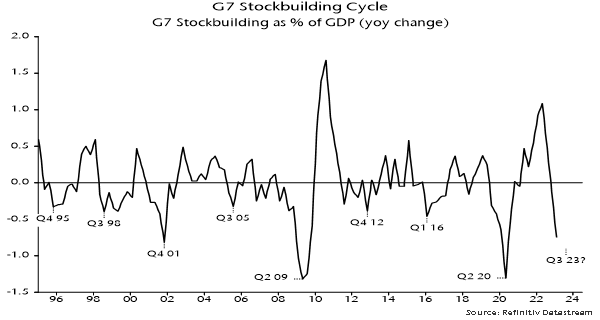
Another positive trend (particularly for EM) is a likely bottoming in the global stock building cycle.
Excessively high inventories in industries from semiconductors to apparel have been in a clean out phase amid weaker consumer demand, which in turn puts downward pressure on commodities prices.
Emerging markets provide the bulk of these goods and commodities, and will therefore benefit from a bottoming out of this downcycle in the next few months.
In Taiwan and Korea, we have seen semiconductor names rallying on reports that the sharp post-COVID inventory destocking cycle is approaching its end, and boosted by demand for high performance chips that power AI. In apparel, Nike recently reported a US$9 billion decline in inventories (down -10% year on year). Nike has up until now been forced to rely on discounts and promotions to clear inventory amid a period of subdued demand and higher competition from rivals like Adidas. Nike will now start to restock with new lines to be sold at higher prices, boosting profitability. Competitors are likely to follow suit, which collectively will boost EM companies that dominate the apparel supply chain.
The long term picture is bright for EM
While the near-term risks brought about by a global slowdown underpin our cautious positioning, there are compelling reasons to expect EM to outperform DM on the other side of this slowdown. Low inflation and higher rates in EM will open the door to rate cuts, while valuations and earnings are supportive. China looks oversold and could rally on more meaningful stimulus. Growth elsewhere, in Southeast Asia and countries like India, look set to outstrip their developed counterparts. As inflation continues to fall and the tightening cycle ends, global money numbers can revert into positive territory. This will be the key ingredient for an emerging market resurgence, as excess liquidity will flow to the superior fundamentals on offer in EM.
french
This is the second in a series of short posts focusing on whether incoming economic news supports or contradicts the forecast of a global “hard landing” suggested by monetary trends.
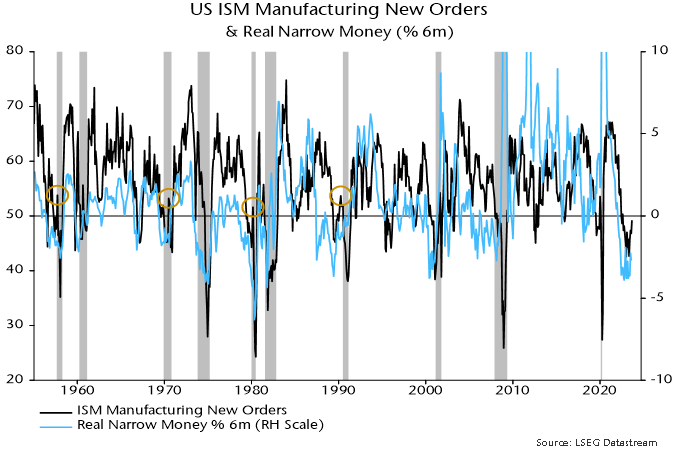
The US ISM manufacturing new orders index rose to a 13-month high of 49.2 in September, apparently supporting soft landing hopes.
A post in July flagged the possibility of a near-term rebound but suggested that this would prove to be a “head fake” preceding a move back below 45.
The main reason for expecting a recovery was that the stockbuilding cycle was judged to be moving towards a low, i.e. a drag on new orders from customer inventory adjustment was likely to abate.
The reason for expecting the recovery to be brief and followed by a relapse was that US real narrow money momentum remained heavily negative, suggesting that a stockbuilding boost would be outweighed by weakness in final demand.
Historical instances of ISM new orders recovering through 50 when real money contraction was negative include 1957, 1970, 1980 and 1990. The orders index subsequently fell back below 45, with the relapses associated with recessions – see chart 1.
Chart 1
Six-month real narrow money momentum has recovered since mid-year but remains significantly negative.
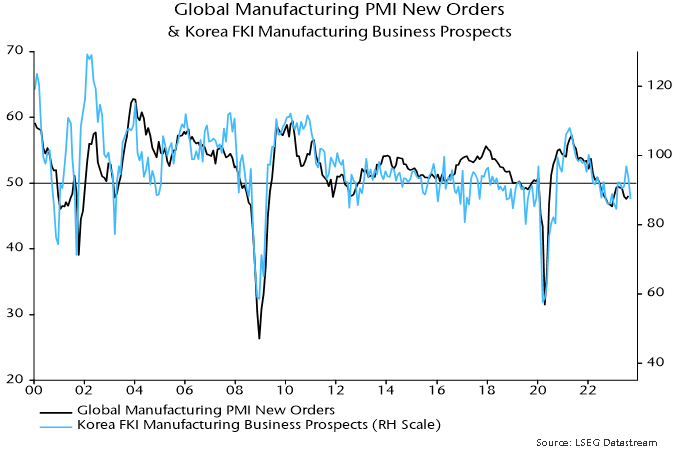
The earlier suggestion of a recovery in ISM new orders was supported by a sharp rebound in Korean FKI manufacturing expectations between February and July – Korean exports are sensitive to changes in global industrial momentum. FKI expectations relinquished most of the February-July gain in August / September.
Verdict: inconclusive.
The CC&L Foundation is pleased to announce a contribution to Canadian Blood Services, exemplifying our commitment to community and creating a positive impact. With the successful conclusion of our August blood drive, we extend our appreciation to participants who supported this important initiative, led by one of our own employees Mohammad Shakeri.
Mohammad is a Specialist on the Corporate Actions team at Connor, Clark & Lunn Financial Group in Vancouver and is passionate about blood donation. He has been a blood donor for ten years, and like over half of Canadians, his close friends and family have been recipients of blood transfusions in the past. Mohammad championed the Partners for Life collaboration between the CC&L Foundation and Canada Blood Services, raising awareness of this service that can affect so many. This was the first blood donation activity at CC&L in recent years and the participation reinforces our firm-wide dedication to giving back to the communities we live and work in.
Quick facts
Each blood donation can save up to three lives.
It can take multiple donors to save a patient’s life.
Given that each process requires less than 30 minutes of each donor’s time, this an excellent investment.
There is a constant demand for blood and blood products. Rolling up your sleeves to donate at anytime is appreciated. As active participants in the Partners for Life program, our collaboration with Canadian Blood Services further strengthens our dedication to community support.
Regulatory risk is nothing new to investors, but it has gained prominence in the current geopolitical climate. Companies globally, especially those with operations or manufacturing facilities in China, are closely monitoring actions their government might take to undermine diplomatic relations. In the banking sector, the situation with SVB has led analysts to expect stricter regulatory frameworks for regional banks. Additionally, the ongoing Hollywood strikes have spotlighted AI as a contentious issue; actors are advocating for regulations that restrict studios from using their likeness for AI-generated content. And the list goes on.
In the 1990s and early 2000s, a laissez-faire attitude prevailed in developed countries, particularly in the US. It was the proof that the capitalist business model was sustainable, a perception supported by the slow pace of regulation during the quickly developing dotcom bubble and the pre-financial crisis housing market. In a hegemonic global environment, smaller nations found few reasons not to strategically align themselves with dominant powers, leading to accelerated deregulation in many developed countries. However, this framework began to shift as the US-led global world order faced challenges from competing political and economic ideologies.
Enter the cycle of protectionism. The consequences of protectionism are well-documented: higher prices due to lack of competition, which leads to persistent inflation; weaker economic growth since international trade isn’t fully offset by domestic consumption, and a more fragile labour market as a result. When various stakeholders voice their discontent with a worsening economic environment, democratic governments often respond by enacting policies, introducing regulations or applying other short-term solutions in an attempt to alleviate the problems they created. These often penalize high-performing industries or companies and may involve levying taxes or setting price ceilings. Such changes catch both company management and shareholders off-guard.
Our clients know that Global Alpha uses a bottom-up approach to stock picking. However, our team also recognizes the increasing need in being risk aware about changes in regulatory frameworks, both at the industry and company levels.
A striking example occurred around this time last year with one of our holdings, Norway Royal Salmon (NRS). The Norwegian government unexpectedly announced a 40% tax rate on resources, which included salmon. Although the company had a solid business model and shareholder satisfaction was high, the stock dropped over 20% in a day, making it one of our worst performers for that quarter. Nevertheless, it was widely understood that NRS was set to merge with one of its competitors, Salmar. We believed this merger would provide for shareholders as it would create one of the largest players worldwide in fish farming and significant advantages, especially given that the larger entity could more effectively adapt to this new tax than smaller competitors. As of March 2023, the Norwegian government lowered its proposed tax rate to 35% to facilitate legislative approval, and we remain happy shareholders of Salmar.
Another recent case involves CVS Group (CVSG LN), a UK-based integrated provider of veterinary care. In early September, the UK Competition and Markets Authority (CMA) announced its review of competitiveness in the veterinary sector, causing CVSG stock to drop more than 25%. Investors immediately assumed that CVS, as the largest player in the space, would be the review’s primary focus. However, our analysis suggests these concerns may be exaggerated. Reviews by the CMA do not always lead to material industry impacts, as shown by its review of UK grocers earlier this year. Furthermore, while CVS has been a major player in consolidating the UK veterinary industry, it has not led to unreasonable price hikes. Average increases for CVS products and services hover around 3% net, which is unlikely to be seen as an outlier. There are minor areas, like lack of transparency in cross-selling and customer awareness regarding chain ownership, where CVS might face some hurdles, but we do not anticipate a substantial impact on the business model.
Lastly, it is worth noting that regulatory and policy shifts can provide positive effects. The waste management industry is expected to benefit as recycling becomes increasingly crucial in creating more sustainable societies. Our portfolios include waste management companies like Casella Waste (CWST US) and Renewi (RWI LN). We expect that new recycling requirements across various commodities will improve margins in what has historically been a low-margin industry.
While no one on Global Alpha’s investment team is a policy expert, our job requires us to consider two important angles: the potential threats to a business model arising from policy shifts, and the actual impact on our investment thesis when a regulatory change happens. One reason for our cautious stance on AI investment opportunities is the level of uncertainty regarding when and how governments will implement regulations. Salmon farming and veterinary care may not capture the public imagination like AI does, but we are confident in our ability to navigate regulatory risks in these industries more successfully.
An Opportunity to Foster Mutual Benefit and Support Sustainable Development
This article was originally published in Issue 33 of the Journal of Aboriginal Management (JAM), it focuses on the theme Infrastructure: Building a Better Tomorrow.
ABOUT THE AUTHOR
Peter Muldowney Head of Institutional and Multi-Asset Strategy at Connor, Clark & Lunn Financial Group
Peter Muldowney is Head of Institutional & Multi-Asset Strategy at Connor, Clark & Lunn Financial Group, and heads the firm’s Strategic Exchange initiative. Peter has over 20 years of investment experience in Canada, the U.S., and the United Kingdom. Prior to joining the firm in 2011, he spent his earlier years in consulting, which included leading two of the major Canadian firms and then moving to the investment management business in 2008, when he established a new investment operation for a Canadian insurance company. Peter completed both the 4 Seasons of Reconciliation from First Nations University of Canada and the Sustainable Investment Professional Certification (SIPC) from Concordia University in 2022.
Indigenous participation in infrastructure projects promotes the economic empowerment of communities while also contributing to a project’s overall success and sustainability. In this article, we delve into some of the ways Indigenous communities can participate in infrastructure investments, and we highlight the benefits that such partnerships can create.
Infrastructure projects are typically large-scale physical assets that meet a basic human need. These assets are essential to the well-being of communities and critical to the functioning of local economies. Infrastructure encompasses projects such as roads, bridges, schools, hospitals, water distribution and treatment as well as power generation and electricity transmission. The development and construction of these assets require significant investment and involve numerous stakeholders. The importance of infrastructure projects to communities, and their long-term nature and size, necessitate a responsible investment approach to secure and maintain a social license to operate.
Stakeholder engagement plays a pivotal role in ensuring that investments incorporate a wide range of perspectives and create positive outcomes. Ultimately, responsible investment is about generating financial returns while also considering the broader impact on society and the environment. An inclusive approach to engagement is essential in ensuring that all relevant parties are consulted.
There is a growing recognition of the importance of including Indigenous peoples as key stakeholders in infrastructure projects, ensuring their rights, cultural heritage, and economic interests are respected and supported. This is particularly critical in countries such as Canada where many infrastructure projects directly impact Indigenous lands and territories, as well as their peoples and communities.
This increased awareness – combined with more intentional inclusivity on behalf of government and business – should help to facilitate greater participation in the responsible development of further sustainable infrastructure projects in Canada. However, it is important that these efforts are focused on a desire for true understanding of Indigenous perspectives and priorities, as well as genuine relationship building that seeks to achieve mutual benefit. Such an approach fosters transparency while also promoting collaboration and consensus-building, which can lead to better decision-making and outcomes.
Collaboration Fosters Mutual Benefits and Sustainable Development
Positive partnerships provide a promising path towards more inclusive investment opportunities that facilitate the economic empowerment of Indigenous communities while also supporting the development, construction, and operation of high-quality and sustainable infrastructure projects.
Increased Indigenous participation can contribute to reconciliation efforts by encouraging Indigenous business development, self-determination, and positive socio-economic outcomes. The steady cash flows generated by infrastructure investments can provide Indigenous partners with funds to address any number of objectives such as housing, healthcare, education, recreational facilities, community centers, economic development and cultural revitalization – or anything that the community values and sets as a priority.
Engaging Indigenous communities also helps to protect the value of infrastructure investments by mitigating some of the associated risks, helping to avoid or address conflicts and legal challenges early while supporting smoother and more efficient project development and operations.
Scott Munro, Deputy Chief Executive Officer of the First Nations Financial Management Board, highlighted this well in his article on evolving ESG standards (JAM 32): “How well a business considers and respects Indigenous rights will determine how its enterprise value is impacted. As well intended and beneficial as these projects maybe, if corporations fail to demonstrate to investors and lenders that they have the free, prior, and informed consent of the Indigenous people who are being impacted, conflict is a certain outcome. Projects may get delayed or encounter costly litigation, and businesses will face reputational loss and discontent shareholders.”
In addition to mitigating some of the risks associated with infrastructure projects, the active involvement of Indigenous communities from the beginning stages of project planning brings valuable local knowledge and perspectives to the table. Indigenous communities possess deep understanding of their lands, resources, and traditional practices. These perspectives contribute to better project design, deeper insight into areas of archaeological significance, sustainable resource management, biodiversity preservation, and more robust environmental impact assessments while also promoting effective environmental monitoring and maintenance.
Collaboration enhances the sustainability of projects and strengthens stewardship efforts by incorporating Indigenous perspectives and practices that have been proven to be environmentally harmonious and resilient over generations. It can lead to more successful outcomes for both the project and the communities involved, fostering collaboration, trust, and shared prosperity.
Indigenous Opportunities in Infrastructure
There are several different ways in which Indigenous communities can participate in infrastructure projects. This includes direct involvement through equity ownership stakes, revenue sharing and other mutually beneficial arrangements, as well as less direct participation through financial investments in public infrastructure companies or private infrastructure funds.
Most commonly, participation is formalized through some form of a negotiated benefit agreement that governs the relationship between the Indigenous community and the infrastructure project. These agreements outline specific benefits and compensation that Indigenous communities will receive in exchange for their support or consent for a project, ensuring their interests are codified and acknowledged as part of the project’s ongoing operations. Successful agreements facilitate community consultation and approval by addressing community social, economic and environmental objectives while also ensuring an equitable distribution of project costs and benefits. Benefits can include financial compensation, employment opportunities, skills training, and community development initiatives.
Equity ownership stakes provide a means for Indigenous communities to share directly in the economics of infrastructure investments. By having ownership in a project, communities receive profits and participate in aspects of the decision-making processes. Revenue sharing agreements are another way in which Indigenous communities can participate in a share of the profits generated by an infrastructure project and can provide an important source of revenue. Both of these types of agreements can empower Indigenous communities economically, foster job creation, and improve resource access.
In addition to equity ownership stakes and royalty payments, there may also be other mutually beneficial arrangements that can be explored. It’s important to recognize that the needs, values and ambitions of each Indigenous community are unique in the same way that each infrastructure project is distinct. While there are benefits to leveraging past experience and best practices, there is no one-size-fits-all approach. Each discussion needs to begin from a place of respect for Indigenous communities and a willingness for open dialogue to reach a place of understanding and productive collaboration.
CC&L Infrastructure’s Focus on Shared Value and Strong Partnerships
CC&L Infrastructure invests in infrastructure assets with attractive risk-return characteristics, long lives, and the potential to generate stable cash flows on behalf of a wide variety of clients — including Indigenous trusts, public and private pension funds, life insurance companies, financial institutions, foundations and endowments, and high-net worth individuals.
As long-term asset owners and stewards of client capital, CC&L Infrastructure focuses on managing its assets responsibly. This includes a systematic approach to evaluating material environmental, social, and governance factors. We believe this approach improves our ability to manage risk, protect the value of our investments, and enhance long-term investment returns.
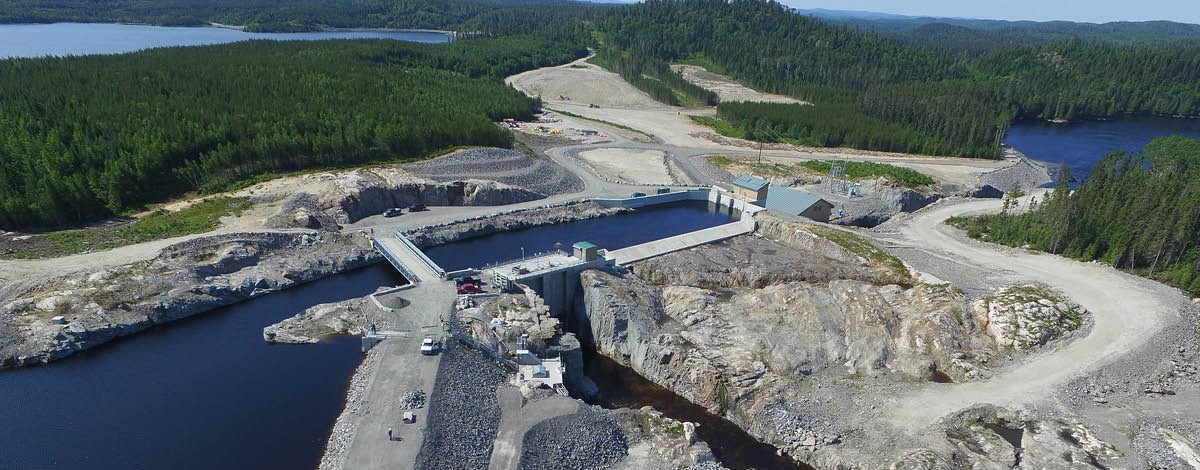
Our firm has a long history of working alongside Indigenous partners. We worked with local First Nations on our first investment more than 15 years ago, and today over half of the Canadian infrastructure assets in our portfolio collaborate with Indigenous communities in some fashion. This includes several run-of-river hydroelectric facilities and solar projects where our Indigenous partners have a direct equity investment alongside us.
CC&L Infrastructure is a part of Connor, Clark & Lunn Financial Group Ltd., an employee-owned, multi-boutique asset management firm whose affiliates collectively manage over CAD$110 billion in assets.
This is the first of a series of short posts focusing on whether incoming economic news supports or contradicts the forecast of a global “hard landing” suggested by monetary trends.
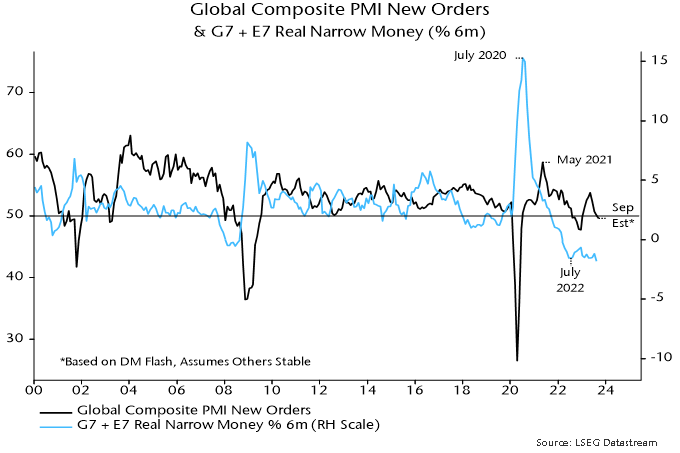
Flash results suggest that the global composite PMI new orders index – a timely indicator of demand momentum – fell for a fourth month in September, consistent with the monetary signal of a slide into early 2024, at least.
The flash results, available for the US, Japan, Eurozone, UK and Australia, imply a decline through 50 to the lowest level since December, assuming no change in all other countries in the global aggregate – see chart 1.
Chart 1
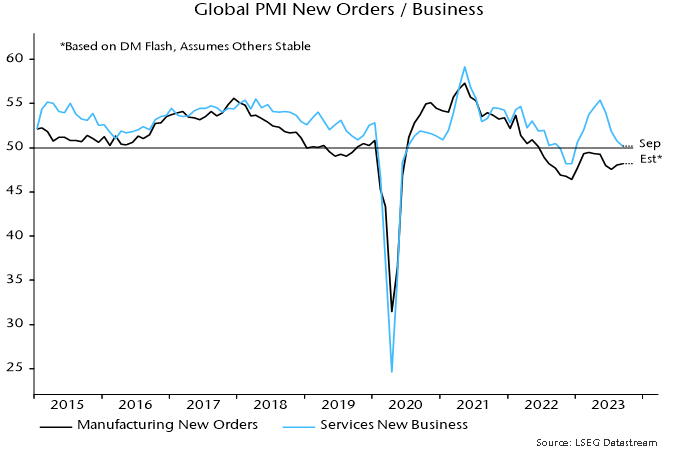
Weakness in the flash surveys was driven by a further slowdown in services new business, with manufacturing new orders little changed – chart 2.
Chart 2
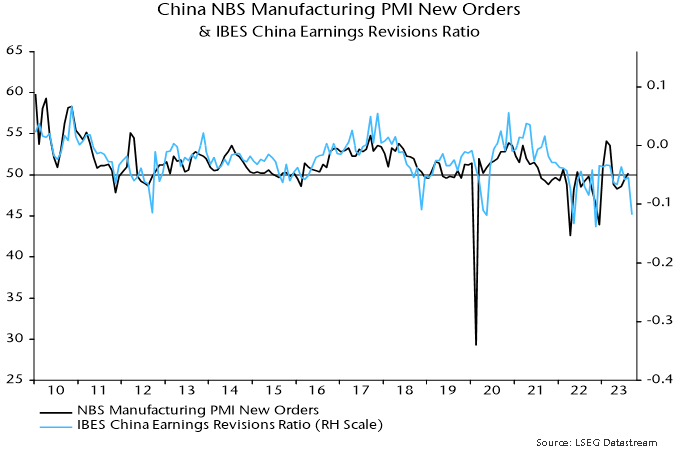
Any hopes of manufacturing stabilisation, however, may be dashed by full September results incorporating China and other emerging economies. The equity analysts’ earnings revisions ratio correlates with Chinese manufacturing PMI new orders and weakened sharply this month – chart 3.
Chart 3
Renewed deterioration in Chinese / Asian manufacturing is also suggested by the Korean FKI survey for September, showing a relapse in the assessment of business prospects to the weakest since February – chart 4.