View of the palace of culture in the Polish capital Warsaw.

The strategy focuses on investing in frontier and emerging market companies that our team expects will benefit from demographic trends, changing consumer behaviour, policy and regulatory reform and technological advancements.

Below, we explore several key factors that influenced returns during the first quarter of 2025 and share observations on the portfolio and the markets.

Internet and technology portfolio

The portfolio’s investments in the internet and technology sector led returns in the first quarter of the year. This was driven by Fawry for Banking Technology & Payments S.A.E. (FWRY EG), the Egyptian payments company. Fawry’s strong execution over the past few years culminated in a record 2024, with revenue and operating profit growing 68% and 160% y-o-y respectively. The value of the payments ecosystem that Fawry’s management team developed over the last few years is now being validated by strong financial results, to which the market is reacting positively. While Fawry’s multi-faceted suite of products, services and business verticals is admittedly complicated to grasp for investors, we believe it is also a source of competitive advantage. Fawry is scaled across several use cases and has a large balance sheet that gives it an advantage in a market with high interest rates and tight liquidity. The company’s ability to leverage technology and deep local expertise to provide their customers (merchants and consumers) with several financial products and services in a seamless online/offline environment is still understated by the market, in our opinion.

The portfolio experienced positive returns from our investment in Allegro.eu S.A. (ALE PW), the leading Polish e-commerce company. Allegro posted a strong fourth quarter results report which included a confident medium-term guide, and a capital allocation policy that was both thoughtful and ahead of the market’s expectations. Allegro also announced a new CEO who, unlike his predecessors, is a native of Poland and comes with 25 years of relevant experience in that market – our preference is always for local talent to lead a company we own if that talent is available. Allegro is the most polarising stock in our portfolio with enough fodder for the bulls and the bears to make a credible case. The recent positive developments contribute to a partial de-risking of the investment thesis and with it, the dial moves closer to the bull camp in which we are situated.

The portfolio’s largest drag in the quarter came from our long-held investment in FPT Corporation (FPT HM), the Vietnamese IT services company. Entering 2025, FPT was the portfolio’s third largest holding (~6% of AUM). We recognised early on in the year that we had too much exposure to a company we liked but with a stock that was becoming increasingly difficult to justify owning as much of, having run up ~150% in USD terms since January 2023. We also began to notice some cracks in the AI universe with Nvidia’s shares beginning to roll over in mid-January and we were well aware that a big part of the multiple expansion in FPT’s shares last year is explained by the company’s proximity to the AI theme.

Putting all that together, we began selling the stock in the first week of February and did another round of selling in mid-March. The selling, while preventing a larger negative impact on the portfolio, was not sufficient to protect the portfolio from a reasonable bps drawdown from the balance of the shares we decided to hold onto in the quarter. While Vietnam has been in the news for the all wrong (tariff) reasons as of late, we have determined that FPT’s service-based business and diversified geographical exposure (including a strong presence in Japan, where the company is long an appreciating JPY) will mean that its earning power remains relatively intact, and that the valuation on the shares we decided to hold onto are now reasonable.

A major highlight from the quarter in the internet and technology portfolio was our decision to finally exit from Kaspi.Kz (KSPI.KZ US), Kazakhstan’s super-app and a truly incredible business. We’ve owned Kaspi since its early days as a London-listed company and continued to own it (in different percentages) through the turbulence in the country in January 2022, to its listing on the Nasdaq in January 2024, and until our eventual full exit early this year.

We were the first foreign investors to visit Almaty and meet with Kaspi in its HQ (according to the company) after the unrest that toppled the regime of Nursultan Nazarbayev in 2022 and have spent considerable time and resources to understand the ins and outs of the business. At this point, we believe that Kaspi will experience slower growth in its home market as it exhausts its ability to monetise its well-penetrated userbase, while digesting an increase in the cost of capital that is essential for the profitability of its lending business. Kaspi’s decision to enter the Turkish market, by way of acquiring Hepsiburada.com, is strategically sound and we will certainly not bet against Kaspi’s management to turn this into a successful venture. However, a slowing home market in Kazakhstan and a competitive and new market in Turkey might prove to be (at least in the short term) too much for even Kaspi to manage. As a result, we chose to watch from the sidelines, hoping to get a chance to re-enter the stock (which is reasonably lower than our exit price now), but pleased with the results of our investment since we acquired our first shares.

Financials portfolio

The financials portfolio was the second largest contributor to returns in the quarter. Our investment in Boursa Kuwait Securities Co. (BOURSA KW), the owner and operator of the Kuwait Stock Exchange and the Kuwait Clearing Company, delivered solid returns. Boursa’s natural monopoly position and its embedded operating leverage to the country’s banking sector market capitalisation and average daily traded value makes it a very good proxy for Kuwait’s reform story. After nearly a year’s wait, the country’s reform program is beginning to take shape with the cabinet approving the long-awaited debt law that is counted on to unlock a significant proportion of the financing required for a much-needed infrastructure spending program. The approval of the debt law also paves the way for the new mortgage law, which is expected imminently. These are very positive developments for Boursa via the prospect of new products being introduced in the market (e.g., fixed income trading and margin lending) and is supportive for valuations and trading activity in the stock exchange (YTD value traded ending March is up over 30%).

On the other hand, the portfolio experienced a drag from our investment in Indonesia’s Bank Syariah Indonesia Tbk Pt (BRIS ID). BRIS is a state-owned entity that has been forged through the merger of Indonesia’s three largest Islamic banks in the country back in 2021. The bank is the largest player in the Islamic financing market with over 40% market share. Indonesia is home to the largest Muslim population in the world (along with Pakistan) and so BRIS has a natural right-to-win in that market. Of course, much rests on management’s ability to execute on its strategy of building a market-leading banking proposition so that they can gain share from the dominant conventional banks in the country (BRIS’ share of the total system assets is only ~6%). We bought BRIS shares last year as we became familiar with their strategy and appreciated the clarity with which they articulated it. We also noticed that there was a visible increase in profitability with return on equity increasing by nearly 400 bps between 2021 and 2024 (to 16.4%) and concluded that there is still another 400 bps of improvement in the next three years that management can deliver that the market did not fully appreciate.

Unfortunately, the Indonesian market had a difficult quarter with the Jakarta Composite Index down 10.3% in USD. Concerns about the country’s political and economic direction weighed on the market and on sentiment. These concerns are valid; the new administration embarked on a series of big projects, including the implementation of a new sovereign wealth fund (Danantara), changes to the 2004 military law (allowing military officers to serve on boards of state-owned companies), and the rollout of the President’s flagship ambitious and fiscally burdensome free school meal program.

Fortunately, the final shape of these initiatives seems to be much better than the market feared. For example, concerns on who would run the new sovereign wealth fund were dispelled quickly when a credible team composed of technocrats and business-friendly professionals was announced. There was also some relief from the details of the appointment of an advisory board that includes the 6th and 7th presidents of Indonesia (especially the popular Jokowi), and an advisory council that includes the likes of Ray Dalio and Jeffery Sachs. We see a lot of value in Indonesia at the moment and are sticking with our investments in that market with a potential to increase our investment as the dust settles, including in BRIS.

Healthcare and education portfolio

The weakness in the ASEAN markets in the first quarter was particularly visible in the negative price action experienced in our healthcare and education portfolio. In Thailand, the portfolio experienced a large drawdown in the shares of Singapore International School Bangkok PCL (SISB BK), the operator of K-12 schools that teaches the Singaporean curriculum to over 4,500 students in six locations in and around Bangkok. SISB is a founder-led business that has built a small (in public listed company terms; the company made $25 million net income in the last 12 months) but successful business. It has operating and free cash flow margins in excess of 30% and a healthy return on invested capital of 23%. SISB is a small-/mid-cap Thai stock and so was implicated in the weak sentiment around the market (FTSE Small Cap Thailand is down 30% from September 30, 2024 to March 31, 2025).

SISB built a strong international student base (~30% international) and since Covid-19 received a large influx of students from China. This proved to be a double-edged sword in 2025 as news of the abduction of a Chinese actor in Thailand spread like wildfire on social media, culminating in a sharp decline in tourism from China and raising safety concerns among Chinese nationals living in the country. While SISB’s business is intrinsically defensive, the link to China via its student body (which we gather is about 20%) meant the stock was caught up in the fallout of the news. SISB did see some Chinese students leave, but we believe the market had overly punished the stock for its exposure to that market. We have been in communication with SISB’s CEO and met him in Bangkok in February. Our conclusion is that some of the pressure they are seeing (on the business and the shares) will be temporary as they digest the impact of the China exposure.

Outlook

Looking forward, the investment outlook has been muddied by the ongoing escalation and volatility in US trade policy. From a portfolio standpoint, our direct exposure to tariffs is limited. We estimate that 85% of the portfolio is invested in service-based industries, 9% in product-based, and the rest in cash. Across the portfolio, 87% is invested in companies that make no money outside of their core region. At a country level, nearly half the fund is in countries that were not named in the first tariff announcement. Of course, we are well aware of second-round effects on our companies’ fundamentals from slowing global trade which can come in the form of lower disposable incomes, lower oil prices (on our Middle East portfolio specifically) and a lower wealth effect across the board. We also know (from experience) that markets dislocate and that prices can deviate significantly from intrinsic values. This is especially true now as long-held assumptions about world-order and the established American role in it are being questioned.

On the other hand, as with any crisis, there will be opportunities. We cannot help but feel bullish about the implication of a weak US dollar and the prospect of an end to US exceptionalism. We see a lot of value in our markets today and believe there is a scenario where the current dynamics can favour certain countries and companies that we believe the strategy is over-indexed to.

We look forward to updating you on the strategy in the next letter.

Global monetary trends suggest demand support for economic activity in late 2025 / early 2026. Such support could offset the negative impact of the US trade policy shock. Growth could bounce back solidly should tariffs be scaled back.

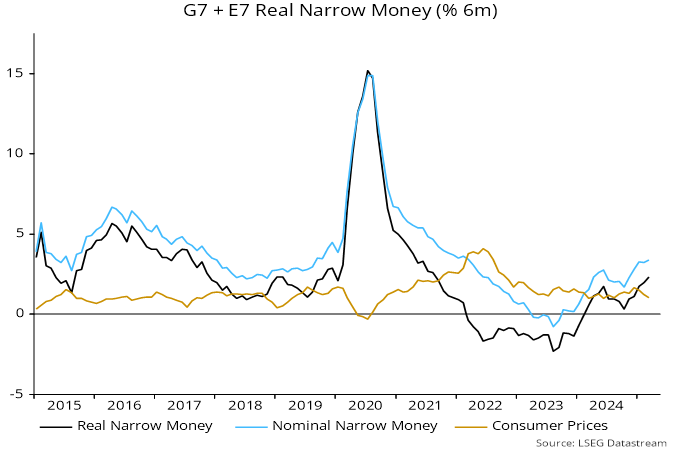
Global (i.e. G7 plus E7) six-month real narrow money momentum is estimated to have risen further in March, reaching its highest level since August 2021, based on monetary data for countries accounting for three-quarters of the aggregate. Nominal money growth appears to have ticked up in March while six-month consumer price momentum slowed – see chart 1.

Chart 1

Chart 1 showing G7 + E7 Real Narrow Money (% 6m)

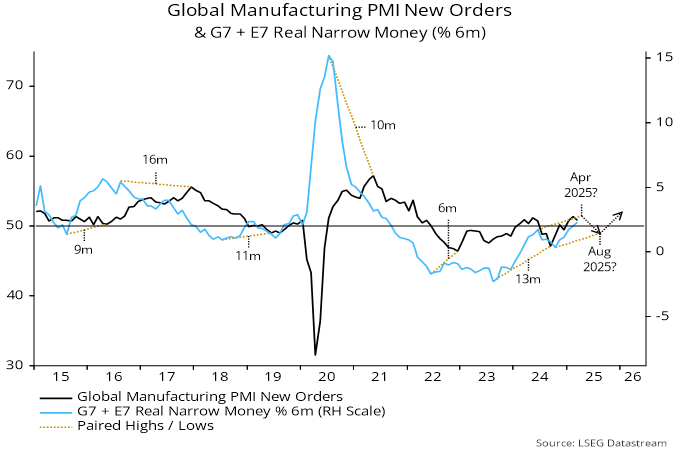
A fall in global real money momentum between June and October 2024 was expected here to be reflected in an economic slowdown in spring / summer 2025 – chart 2. The US policy shock, therefore, is occurring at an inopportune time, threatening a much more serious downturn.

Chart 2

Chart 2 showing Global Manufacturing PMI New Orders & G7 + E7 Real Narrow Money (% 6m)

Real money reacceleration since late 2024, however, suggests a short, sharp hit to economic activity rather than a sustained recession. A recovery in domestic demand could outweigh net export weakness by late 2025, particularly if the tariff regime that eventually emerges is less onerous than currently feared, or at least allows businesses to plan with less uncertainty.

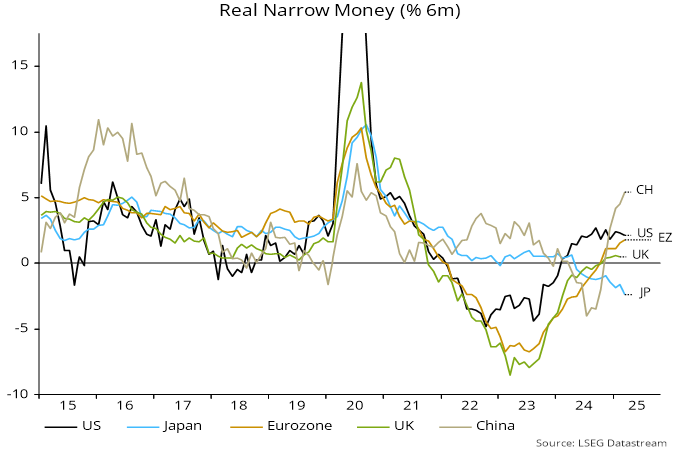
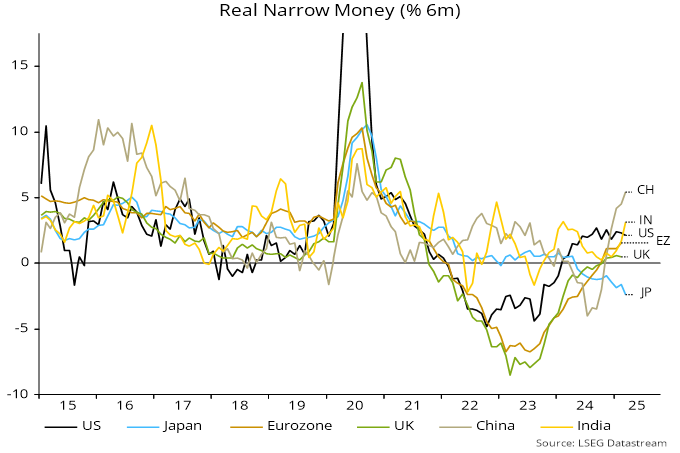
The estimated March rise in global six-month real narrow money momentum was driven by China and India, with the US little changed and Japanese weakness becoming more extreme – chart 3. (Eurozone and UK March numbers will be released next week.)

Chart 3

Chart 3 showing Real Narrow Money (% 6m)

Could the monetary pick-up reverse? US broad – and possibly narrow – money growth has been supported by an enforced run-down of the Treasury’s cash balance at the Fed, which will be rebuilt if / when agreement on lifting the debt ceiling is reached.

Tariffs will have a temporary impact on CPI numbers, squeezing real money momentum. Still, effects should be small outside the US and offset by recent weakness in energy prices.

The trade shock, meanwhile, is resulting in faster monetary policy easing outside the US, reflecting both economic fears and US dollar weakness.

Prospective influences, therefore, are mixed and a further rise in global real money momentum appears as likely as a relapse.

Wooden blocks spelling TARIFFS placed on a map of the United States with US and China flags.

The end of “US exceptionalism” as an investment narrative, the value on offer in EM, and the potential for these maligned markets to enter a virtuous circle of performance are themes that we have been banging on about for months now.

While the unwinding of the “Trump trade” was in keeping with our outlook published to investors in past months, we clearly did not anticipate how the chaotic imposition of tariffs on “Liberation Day” would serve as such a potent accelerant.

This was a radical outcome

Markets expected a gradual and predictable rollout of tariff measures, but what we got was random and unpredictable. The economic fallout, should the 90-day tariff reprieve fail to yield de-escalation, will hit the United States harder than most other countries as the affected share of GDP is much higher. US goods imports alone are equivalent to c.11.5% of US GDP versus total bilateral trade (exports plus imports) with the US of 3.5–5.5% of respective GDPs in Japan, Europe and China.

Exports plus imports of goods as % of GDP
US – total, others – bilateral with US
Line graph illustrating exports plus imports of goods as a percentage of GDP for the United States, Japan, the European Union, the UK and China.
Source: NS Partners and LSEG Datastream.

Unless there is a dramatic reversal, a return to protectionism threatens a supply shock in the United States, which will drive the price of many things higher and create shortages for many basic goods. This will be destructive for demand and ultimately deflationary unless the Fed accommodates the shock by increasing the money supply.

What is the tariff endgame?

Is President Trump willing to risk a financial crisis in the pursuit of reindustrialising America? Or is this all in the “Art of the Deal,” a negotiating tactic designed to secure better trade terms? Or is it about completely decoupling from and isolating China?

Uncertainty over the outcome sought, the potential fallout from American businesses pausing investment and consumers reining in spending are undermining sentiment for all US assets.

The soft economic underbelly of the United States is being exposed. Liberation Day saw the dollar falling along with bond and equity markets. This is how emerging markets are meant to behave on political risks spiking, and not the global market safe haven.

If Trump truly seeks a dramatic reduction in the US trade deficit, this will be accompanied by a reduction in the capital account surplus, meaning that foreign investors do not need to buy the same quantum of US assets as before.

The trouble is that a falling capital account surplus as foreigners repatriate funds (or simply invest less in US assets) puts upward pressure on government bond yields. It was persistent demand for US Treasuries irrespective of the fiscal profligacy of the government that allowed it to build up a debt pile of $36 trillion, with $9 trillion of that due to be refinanced this year.

So President Trump wants a weaker dollar to boost domestic manufacturers, but what to do about yields? The most simple solution will be financial repression, by forcing domestic financial institutions to increase their holdings of US Treasuries. Where do the funds come from for these purchases – from selling US equities perhaps?

The damage is done

Course corrections were inevitable. As former President Clinton’s political advisor James Carville famously said:

“I used to think that if there was reincarnation, I wanted to come back as the President or the Pope or as a .400 baseball hitter. But now I would want to come back as the bond market. You can intimidate everybody.”

President Trump backed down in the face of spiking bond yields with his 90-day tariff pause to everyone but China, but it is likely that damage has been done here that cannot be undone.

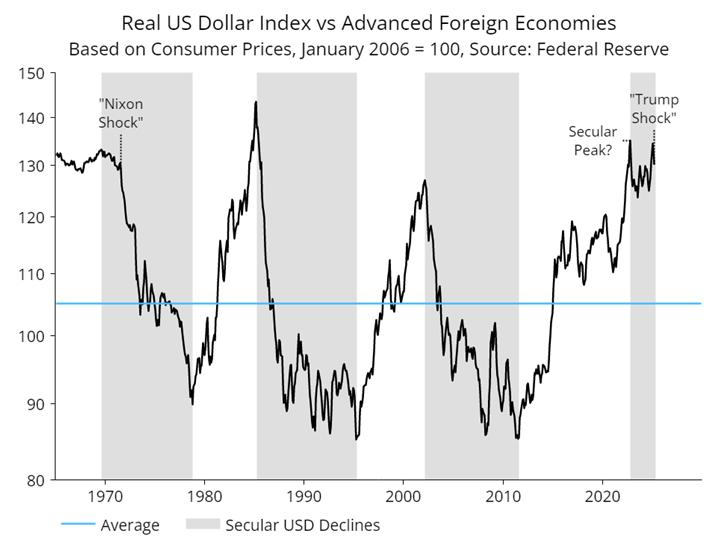
We may be in the early innings of a broader secular shift in markets. Our economist Simon Ward has asked whether this will be similar in magnitude to the dollar bear market sparked by President Nixon’s suspension of gold convertibility and imposition of tariffs in 1971.

While this could signal a rocky period ahead for US equities, a falling dollar flushes emerging markets with managed currency regimes with liquidity and allows central banks to cut rates.

Historically, this has been a good signal and driver of EM outperformance.

EM relative performance and USD
Line graph comparing the real US dollar index versus advanced foreign economies over the last five decades.
Source: NS Partners and LSEG Datastream.

Expect some unsettling trade headlines in the months ahead, but things could start to get very interesting for emerging markets fuelled by a falling dollar.

Portfolio strategy notes

High level

Tariffs will be deflationary if central banks do not accommodate them – see Smoot-Hawley tariffs in the 1930s which were massively deflationary. Compare and contrast the inflationary oil price shock in 1973 where the central bank accommodated, and the second oil price shock in 1979 which was not inflationary as the Fed under Volcker kept monetary policy tight. We do not expect Powell to accommodate.

It is likely that this will be a very deflationary event for the rest of the world as supply is diverted from the United States elsewhere resulting in downward pressure on rates.

We were already relatively defensively positioned as money trends were suggesting a Q2/Q3 economic slowdown before trade war shock – this will be negative for US growth. Our expectation is for a short, sharp economic shock, but not a crisis (based on our cycles analysis).

Strategy

  • Inflation boost from tariffs expected to be small/temporary – monetary backdrop still disinflationary
  • Relative money trends positive for China/EM
  • Excess money backdrop neutral/negative
  • Favour more defensive exposure – underweight oil and commodities
  • Favour interest rate sensitive countries and companies
  • Falling dollar beneficiaries
  • Highly cyclical markets downgraded – especially consumer cyclical exposure
  • Avoid exporters with high exposure to the United States
  • China consumer – stimulus to step up as tariff response

A cyclical forecasting framework implies that current economic events will contain echoes of developments at the same stage of previous cycles.

Similarities should be more pronounced at around 18- and particularly 54-year frequencies, corresponding to average lengths of the housing and Kondratyev inflation cycles respectively.

A previous post noted the similarity of Fed tightening episodes in 1967-69 and 2022-23. The Fed funds rate (month average) rose from peak to trough by 540 bp and 530 bp respectively, topping in August 1969 and August 2023, exactly 54 years later – see chart 1.

Chart 1

Current vs previous Kondratyev Cycle. US Fed funds rate.

The US economy entered a recession at the end of 1969. GDP was recovering by Q2 1970 but suffered a second hit from a prolonged auto strike.

The Fed cut rates much more aggressively than recently but reversed course temporarily from early 1971 as the economy rebounded strongly and inflation remained high. The current Fed pause has occurred at the same cycle time.

Inflation fell sharply into 1972, mirroring a big slowdown in broad money growth two years earlier. The Fed resumed easing later in 1971, with the funds rate reaching an ultimate low in February 1972.

A possible scenario is that President Trump’s tariff shock triggers the recession “missing” from the current cycle, causing the Fed to ease aggressively later in 2025, with rates and inflation falling to lows in 2026 corresponding to those reached in 1972.

US disruption to global economic relations is itself is strongly reminiscent of policy developments 54 years ago. In August 1971, President Nixon shocked trading partners by suspending convertibility of the dollar into gold within the Bretton Woods system while imposing a 10% tariff on imports.

The backdrop was a US balance of payments deficit and an accelerating loss of gold from US reserves. According to a Federal Reserve history of the period, President Nixon blamed the deficit “on unfair trading practices and other countries’ unwillingness to share the military burden of the Cold War”. Sound familiar?

The “Nixon shock” triggered a crisis, with global policy-makers fearing that “international monetary relations would collapse amid the uncertainty about exchange rates, the imminent spread of protectionism, and the looming prospects of a serious recession”.

The crisis was resolved, at least temporarily, by the December 1971 Smithsonian Agreement, involving trading partners agreeing to revalue their currencies against the dollar in return for the removal of tariffs. “The net effect was roughly a 10.7 percent average devaluation of the dollar against the other key currencies … Foreign nations also agreed to comply with Nixon’s request to lessen existing trade restrictions and to assume a greater share of the military burden.”

Could a revaluation of currencies against the dollar be part of a “deal” to end the current crisis, once President Trump comes to recognise that the economic costs of his high tariff policy greatly exceed any benefits?

The Nixon shock occurred with the real trade-weighted value of the dollar at a similar premium to its long-run average to today. The shock accelerated a secular decline into and beyond the following housing cycle trough – chart 2.

Chart 2

Real US dollar index vs advanced foreign economies. Based on consumer prices, January 2006 = 100, Source: Federal Reserve / BIS.

Irrigation system in a large green field.

As the global economy contends with mounting climate-related losses over USD600 billion in insured damages over the last two decades the investment case for climate adaptation is gaining strength. From flooded subways in New York and burnt-out neighborhoods in California, to drought-stricken farms in Europe and storm-ravaged coastlines in Japan, major environmental disasters are no longer fodder for movies, and the costs to rebuild are no longer abstract.

In the United States alone, hurricane Milton and Helene in 2024 were amongst the costliest hurricanes in US history, at approximately USD35 billion and USD80 billion in damages respectively, while Canada’s wildfires in 2023 became the most expensive on record for the country, with damages surpassing $1 billion.

The future also holds a sobering reality: insurance claims are likely to rise in regions that were once considered “safe.” In fact, properties along Florida’s eroding shorelines are beginning to lose insurability altogether as entire homes inch closer to the sea with every storm surge. Meanwhile, infrastructure around the world faces the stress of extreme heat, intense rainfall and prolonged droughts, putting pressure on insurers, governments, and private capital to respond.

While mitigation (reducing emissions and overall environmental impact) remains essential, adaptation (making systems more resilient to the physical impacts of climate change) is emerging as an investable trend. For long-term investors, this shift presents an opportunity to capture growth, hedge risk, and align capital with real-world resilience.

Companies that help communities, infrastructure and ecosystems adapt to physical climate risks are unlocking new growth markets while also de-risking their operations and strengthening their long-term resilience. For investors, these businesses represent not only defensive plays but also strategic exposure to rising demand for resilient systems in sectors like water, energy, agriculture and construction.

At Global Alpha, we aim to capture these adaptation-driven opportunities across our small cap portfolio. Several of our holdings are actively contributing to building climate resilience from various angles including conservation, advisory services and infrastructure.

Valmont Industries Inc. (VMI US) offers advanced adaptation solutions for the agricultural sector. As climate change intensifies, the demand for efficient water management and resilient farming practices grows. Valmont’s innovative irrigation technologies, such as their Valley® centre pivots and remote monitoring systems, help farmers optimize water usage, enhance crop yields and reduce operational costs. These solutions not only support sustainable agriculture but also position Valmont as a key player in addressing the challenges posed by climate change.

Mueller Water Products Inc. (MWA US) develops smart water infrastructure, including leak detection and pressure management solutions. These technologies help cities reduce water loss, extend infrastructure lifespan, and ensure a stable supply of clean water – all essential in the face of increasing droughts and floods. By investing in smart water technologies, Mueller enables communities to make informed decisions and prioritize spending on critical assets, thereby enhancing resilience against climate-related challenges.

Montrose Environmental Group Inc. (MEG US) captures opportunities by providing end-to-end solutions for environmental risk management. From air and water quality monitoring to remediation and climate risk advisory, Montrose helps clients adapt operations to a changing climate. Their expertise in climate risk assessment and sustainability advisory helps clients navigate the complexities of climate adaptation, ensuring resilient and sustainable operations

Casella Waste Systems Inc. (CWST US) plays a critical role in climate adaptation by delivering resilient waste management and recycling services. From post-disaster clean-up to ensuring service continuity in rural and underserved areas, Casella helps communities recover quickly and maintain public health as climate-related events grow more frequent.

Rockwool A/S (ROCKB DC) supplies stone wool insulation that improves energy efficiency and helps buildings withstand extreme heat, fire and moisture. As the built environment faces growing physical risks, Rockwool’s products contribute directly to urban structural climate resilience.

Investors should consider these companies as part of a diversified portfolio aimed at capitalizing on the growing demand for climate adaptation solutions. By investing in firms that prioritize resilience, investors can not only mitigate risks but also drive sustainable growth and long-term value.

Monetary trends suggest that China’s economy is better placed to withstand tariff damage than Japan’s.

Chinese six-month real narrow money momentum rose further in March, reaching its highest level since August 2020. Japanese momentum moved deeper into contraction – see chart 1. (US March numbers will be released next week, with Eurozone / UK data the following week.)

Chart 1

Real narrow money (% 6m).

Inflation divergence has contributed to the wide gap but it mainly reflects nominal money trends: Japanese narrow money is contracting even in nominal terms.

The Japanese fall is partly explained by money-holders switching out of sight deposits (included in narrow money) into time deposits (excluded), which now pay modest interest. Still, broad money trends are also weak: M3 grew by just 0.5% at an annualised rate in the six months to March. Broad money expansion has been dragged down by BoJ QT and a fall in bank lending to non-bank financial corporations.

By contrast, six-month growth of Chinese broad money – on the preferred definition here excluding deposits held by financial institutions – was stable in March at a level close to the 2015-19 average. This pace was associated with solid nominal GDP expansion – chart 2.

Chart 2

China nominal GDP* (% 2q) & money / social financing* (% 6m). *Own seasonal adjustment.

Broad money trends have been supported by PBoC and state bank purchases of government bonds issued to finance fiscal stimulus measures. In addition, six-month growth of bank lending has revived recently, despite a drag from debt swap operations (under which funds raised through bond issuance are used to repay bank loans of government-related entities).

Previous posts suggested that Japanese monetary weakness would be reflected in downside economic and inflation surprises. The composite PMI output index fell sharply last month, to well below levels in the US, Eurozone, UK and China.

Annual growth of scheduled earnings, meanwhile, undershot expectations in February. Inflation believers have been relying on a developing wage-price spiral but bumper headline pay awards in the spring Shunto may not be representative of trends across the whole economy – chart 3.

Chart 3

Japan scheduled earnings (% yoy) & agreed rise in base pay in Spring Shunto.

Automated smart robot arm system for innovative warehouse and factory manufacturing.

The stock market experienced significant volatility last week due to escalating trade tensions following President Donald Trump’s announcement of new tariffs aimed at reducing the US trade deficit. These tariffs were implemented on April 2, 2025 – a day referred to as “Liberation Day” – leading to widespread market reactions across developed markets globally.

The technology sector for both large and small caps were among the sectors most adversely affected during this period. Technology stocks faced substantial declines, with companies like Tesla and Nvidia experiencing drops of 36% and nearly 20% respectively, over a two-day span. Industrials and consumer discretionary also suffered notable losses, as companies within these industries are often sensitive to trade policies and global economic conditions.

In contrast, defensive sectors such as consumer staples, healthcare and utilities showed resilience. These sectors tend to be less sensitive to economic cycles and trade fluctuations, providing a buffer during periods of market volatility.

The new US tariffs could reduce global GDP growth by 50 bps, with a 100-150 bp drag on US growth, a 60 bp drag on Asian growth and a 40-60 bp drag on Euro-area growth. It is expected the US administration will negotiate country-specific comprehensive packages involving trade, defense, energy and immigration. The aim is de-escalation in the global trade war over the coming weeks and months, though negotiations with China will likely prove difficult, given the geopolitical tensions between the two countries.

Global Alpha will continue to monitor the effect of tariffs on the companies it is invested in. From supply chain to end consumer, the ripple effects are multi-factor dependent. Can production relocate? Is it a service or a good?  Where are competitors located? Can the buyers absorb the price increase? And ultimately, what is the demand destruction?

The length of tariffs is also unknown as we recently saw with Vietnam which offered to remove tariffs less than 48 hours post Liberation Day. Nike re-couped half its losses on the announcement.

Presently, our largest exposure to tariffs is the aluminum company Alcoa Corp. (AA US) with 50% of its Canadian production destined to the United States with no real US substitution. The company estimates that a car price tag will increase by $1200 from aluminum alone. If tariffs persist, on-shoring plans could re-surge.

On-shoring will continue to accelerate whether tariff induced or not. Political tensions are only increasing and productivity will continue to rise and automate. In fact, we may be on the verge of one of the largest productivity gains in recent times through the realization of a theme society has dreamt of for a long time: humanoid robotics.

In our discussion with companies, we can start seeing mid- to near-term plans to use humanoid robots. Tesla’s development plans for the Optimus humanoid robot begins with progression of human-superior autonomous driving by Q4 2025 (sensorial decision making). Following that step would be the replication of that technology in humanoid robots. The first launches of the Optimus Robot in the logistics sector are planned for Q1 2026. With this plan, it is easy to imagine Mr. Musk telling President Trump that his industrial labour shortages will be solved in the mid-to-long term.

The global humanoid robot market size was valued at USD 2.4 billion in 2023 and is projected to grow from USD 3.3 billion in 2024 to USD 66.0 billion by 2032, exhibiting a CAGR of 45.5% during the forecast period. Asia Pacific dominated the humanoid robot market with a share of 42.0% in 2023.

The wheel-drive version (versus biped) segment held the highest market share of 65.6% in 2024 and an even higher market share in real-use cases; the biped is still in its infancy when addressing performance.

In 2022, Elon Musk suggested that the Optimus robot could eventually be priced at around $20,000 to $30,000 per unit when mass production begins. This price range is based on Musk’s vision for the robot to be affordable, allowing widespread adoption and possibly replacing some human labour in industries like manufacturing, logistics and even home use.

The Optimus robot is designed to resemble a human in both appearance and movement. It stands 5’8” tall (around 173 cm) and weighs about 125 lbs (approximately 57 kg).

Global Alpha is a shareholder of GXO Logistics Inc. (GXO US)

GXO is a global leader in supply chain solutions and logistics services. The company focuses on providing advanced logistics capabilities for customers across a variety of industries, including retail, e-commerce, consumer goods, automotive and technology. GXO operates with a strong emphasis on innovation and technology, aiming to enhance efficiency, optimize operations and improve customer service through automation, robotics and artificial intelligence.

Today, GXO is a leader in the implementation of traditional robots like autonomous mobile robots (AMRs) or robotic arms. However, the company is likely to continue exploring humanoid robots as the technology evolves.

Key areas of GXO:

  1. Warehouse management: GXO operates large-scale, automated warehouses that utilize sophisticated technology to manage inventory, order fulfillment and distribution. This includes the use of robotics, AI and data analytics to improve efficiency and accuracy in managing supply chains.
  2. E-commerce fulfillment: GXO specializes in providing logistics services for e-commerce companies, including fast order processing, picking, packing and last-mile delivery solutions.
  3. Transportation and distribution: The company offers end-to-end transportation management services, optimizing routes and using data-driven systems to improve fuel efficiency, delivery time and cost-effectiveness.
  4. Cold chain logistics: GXO also manages cold storage and temperature-sensitive goods, offering specialized logistics solutions for food, pharmaceuticals and other perishable products.

GXO is exploring humanoid robots for:

  1. Assistive tasks in warehouses: Humanoid robots are being developed with the potential to assist in warehouses with tasks that require human-like dexterity and mobility. They could perform tasks like sorting, packaging and even delivering materials across different sections of a warehouse.
  2. Customer service: Humanoid robots might also be used in customer-facing roles within logistics operations. For instance, they could assist with customer queries or provide support in retail environments where GXO provides fulfillment services.
  3. Human-robot collaboration: GXO, like other companies in the logistics and supply chain sector, is likely to focus on robots that complement human workers rather than replace them entirely. Humanoid robots can be deployed in environments where human workers are still essential, but can be augmented by automation to handle repetitive or physically demanding tasks.

Global Alpha also owns Kerry Logistics Network Limited (636 HK)

Kerry Logistics is a Hong Kong-listed third-party logistics (3PL) provider offering a comprehensive range of supply-chain solutions. Their services include integrated logistics, international freight forwarding (air, ocean, road, rail and multimodal), industrial project logistics, cross-border e-commerce, last-mile fulfillment and infrastructure investment. With a presence in 59 countries and territories, Kerry Logistics has established a solid foothold in many of the world’s emerging markets. ​

Incorporating robotics into their operations has significantly enhanced Kerry Logistics’ efficiency and profitability. For instance, in 2023, they implemented the “KOOLBee” sorting robots across facilities in Hong Kong, Tianjin and Dongguan. These intelligent and flexible robots increased overall sorting productivity by 270%, enabling the company to meet the growing demands of fashion e-commerce fulfillment. ​

Additionally, in 2021, Kerry Logistics introduced “KOOLBotic” robotic arms dedicated to cold chain logistics in the food and beverage industry. These robotic arms improved sorting productivity by 20% and allowed operations to run 20-hour shifts in low-temperature environments, effectively reducing human contact during the pandemic. ​

By integrating such robotic solutions, Kerry Logistics has not only boosted operational efficiency but also enhanced its capacity to handle large volumes and meet customer expectations, thereby positively impacting profitability.

Although we are excited by the prospect of humanoid robots, the early stages of the technology keeps us from integrating their commercial viability in our financial assumptions.  It is a question of “when,” not “if.” These themes continue to provide us with opportunities and earnings growth in our investment universe.

Global money growth has picked up since late 2024 but remains subdued, while the stock of money is no longer in excess relative to nominal economic activity and asset prices. The monetary backdrop, therefore, appears insufficiently supportive to offset economic / market damage from US-led tariff hikes.

Prospective tariff effects, meanwhile, require a revision to the previous forecast here of a downside global inflation surprise in 2025 related to extreme monetary weakness in 2023. A price level boost this year is unlikely to yield second-round effects given disinflationary monetary conditions, so a near-term lift to annual inflation should reverse in 2026. The effect may be to extend the lag between the money growth low of 2023 and the associated inflation low from two to three years.

The elimination of a surplus stock of money has been mirrored by erosion of excess labour demand, with job openings / vacancy rates mostly now around or below pre-pandemic levels. Economic weakness, therefore, may be reflected in a rise in unemployment that eventually dominates central bank concerns about inflationary tariff effects, suggesting that current policy caution will give way to renewed easing later in 2025.

Global six-month real narrow money momentum – the key monetary leading indicator followed here – fell between June and October 2024 but has since rebounded, reaching a post-pandemic high in February. (The timing of the mid-2024 dip has changed slightly from previous posts, mainly reflecting annual revisions to seasonal adjustment factors for US monetary data.) Real money momentum, however, remains below its long-run average – see chart 1.

Chart 1

Chart 1 showing Global Manufacturing PMI New Orders & G7 + E7 Real Narrow Money (% 6m) Global six-month real narrow money momentum – the key monetary leading indicator followed here – fell between June and October 2024 but has since rebounded, reaching a post-pandemic high in February. (The timing of the mid-2024 dip has changed slightly from previous posts, mainly reflecting annual revisions to seasonal adjustment factors for US monetary data.) Real money momentum, however, remains below its long-run average – see chart 1.

The lead time between real money momentum and manufacturing PMI new orders has averaged 10 months at the four most recent turning points. Based on this average, the 2024 real money slowdown and subsequent reacceleration suggest a PMI relapse in Q2 / Q3 followed by renewed strength in late 2025 – chart 2.

Chart 2

Chart 2 showing Global Manufacturing PMI New Orders & G7 + E7 Real Narrow Money (% 6m) The lead time between real money momentum and manufacturing PMI new orders has averaged 10 months at the four most recent turning points. Based on this average, the 2024 real money slowdown and subsequent reacceleration suggest a PMI relapse in Q2 / Q3 followed by renewed strength in late 2025 – chart 2.

Tariff effects – including payback for a front-loading of trade flows – are likely to magnify mid-year economic weakness and could push out or even abort a subsequent recovery: delayed central bank easing, a confidence hit to business / consumer credit demand and a near-term inflation lift could reverse the recent pick-up in real money momentum.

Previous posts, meanwhile, argued that stocks of (broad) money in the US, Japan and Eurozone are no longer higher than warranted by prevailing levels of nominal economic activity and asset prices, implying an absence of a monetary “cushion” against negative shocks. Excess money appears to be substantial in China but could remain frozen as US trade aggression and domestic policy caution sustain weak business / consumer confidence.

Chart 3 shows six-month real narrow money momentum in major economies. Chinese strength is a stand-out but may partly reflect payback for earlier weakness – momentum needs to remain solid to warrant continued (relative) optimism. A Eurozone recovery still leaves momentum lagging the US (where revised numbers show less of a recent slowdown), with the UK further behind. Japanese weakness is alarming, suggesting significant downside economic / inflation risk and consistent with recent lacklustre equity market performance.

Chart 3

Chart 3 showing Real Narrow Money (% 6m)

European economic optimism has been boosted by a relaxation of German fiscal rules and a wider drive to increase defence spending. This is significant for medium-term prospects but has limited relevance for the near-term economic outlook, which hinges on whether an uplift from monetary easing will prove sufficient to offset trade war damage.

The two flow indicators of global “excess” money followed here are giving a mixed message: six-month growth of real narrow money has crossed above that of industrial output (positive) but 12-month growth remains below a long-term moving average (negative). This combination was associated with global equities slightly underperforming US dollar cash on average historically.

From a cyclical perspective, a key issue is whether the US tariff war shock brings forward peaks and downswings in the stockbuilding and business investment cycles, which are scheduled to reach lows in 2026-27 and 2027 or later respectively. The previous baseline here was that upswings in the two cycles would extend into 2026, a scenario supported by the current monetary signal of a rebound in economic momentum in late 2025.

The next downswings in the two cycles are likely to coincide with a move of the 18-year housing cycle into another low. Triple downswings are usually associated with severe recessions and financial crises. Such a prospect is probably still two years or more away but the US policy shock may have closed off the possibility of a final boom leg to current upswings before a subsequent crash.

Table 1 updates a comparison of movements in various financial assets so far in the current stockbuilding upswing (which started in Q1 2023) with averages at the same stage of the previous eight cycles, along with changes over the remainder of those cycles. Three months ago, US equities, cyclical sectors, the US dollar and precious metals were performing much more strongly than average, suggesting downside risk. By contrast, EAFE / EM equities, small caps and industrial commodities appeared to have catch-up potential.

Table 1

Table 1 showing Stockbuilding Cycle & Markets Table 1 updates a comparison of movements in various financial assets so far in the current stockbuilding upswing (which started in Q1 2023) with averages at the same stage of the previous eight cycles, along with changes over the remainder of those cycles. Three months ago, US equities, cyclical sectors, the US dollar and precious metals were performing much more strongly than average, suggesting downside risk. By contrast, EAFE / EM equities, small caps and industrial commodities appeared to have catch-up potential.

Q1 moves corrected some of these anomalies, with the US market falling back, Chinese / European equities performing strongly, US cyclical sectors lagging, the dollar falling and industrial commodity prices recovering. Precious metals, however, became even more extended relative to history, while small cap performance has yet to pick up.

The updated table suggests potential for further strength in EM and to a lesser extent EAFE equities, along with industrial commodities. Cyclical sector underperformance and dollar weakness could extend, while gold / silver appear at high risk of a correction. The larger message, however, is that, even assuming a delayed peak, the stockbuilding cycle has entered the mid to late stage that has been unfavourable for risk assets historically.

The suggestion of EM outperformance is supported by monetary considerations. Six-month real money momentum is stronger in the E7 large emerging economies than in the G7, while – as noted earlier – global real money is outpacing industrial output. EM equities beat DM on average historically when these two conditions were met, underperforming in other regimes – chart 4.

Chart 4

Chart 4 showing MSCI EM Cumulative Return vs MSCI World & "Excess" Money Measures

Scenic downtown Toronto's financial district skyline near Bay and King intersection.

Connor, Clark & Lunn Funds Inc. (“CC&L Funds”) is excited to provide an update on two liquid alternative funds: the launch of the PCJ Focused Opportunities Fund, and the renaming of CC&L Alternative Income Fund to CC&L Absolute Return Bond Fund (collectively, the “Funds”).

PCJ Focused Opportunities Fund

The new PCJ Focused Opportunities Fund is modeled after an existing institutional strategy that seeks to deliver an attractive long-term growth profile by taking long and short positions in North American Equities. This opportunistic fund incorporates many of the same themes and positions as the existing PCJ Absolute Return II Fund; however, without the requirement to be market neutral, it is able to pursue a higher level of returns. The portfolio manager is PCJ Investment Counsel Ltd. (“PCJ”). Risk rating: Medium.

“While liquid alternative funds are still a relatively new structure, our PCJ investment team has been successfully managing alternative strategies for the past 15 years through different market conditions. In our PCJ Focused Opportunities Fund, our team aims to deliver long-term return levels similar to equities, but with less correlation and lower drawdowns,” said Tim Elliott, President & CEO of CC&L Funds. “We view the launch of this fund as timely, as equity investors are faced with high valuations and potentially slowing economic growth. For investors seeking to diversify their equity exposure without reducing their expected return, we view this fund as an ideal solution.”

CC&L Absolute Return Bond Fund

CC&L Absolute Return Bond Fund, formerly known as the CC&L Alternative Income Fund, is also modeled after an existing institutional portfolio that employs three unique and complementary fixed income absolute return strategies to target attractive risk/adjusted returns with low correlation to conventional bond portfolios. The portfolio manager is Connor, Clark & Lunn Investment Management Ltd. (“CC&L Investment Management”). Risk rating: Low to Medium.

“Fund flow data suggests that individual investors have dramatically increased their exposure to corporate credit in recent years. Our CC&L Absolute Return Bond Fund provides a solution for investors who are looking to reduce that exposure/risk at a time when credit spreads, like equities, are quite expensive, without reducing their expected return from fixed income,” said Tim Elliott.

Focused investment teams, strong and stable organization

CC&L Funds, CC&L Investment Management, and PCJ are affiliates of Connor, Clark and Lunn Financial Group Ltd. (“CC&L Financial Group”), whose multi-affiliate structure brings together the talents of diverse investment teams who offer a broad range of traditional and alternative investment solutions. CC&L Financial Group is one of Canada’s largest independently owned asset managers, responsible for over $139 billion in assets on behalf of institutional and individual investors.

About the Funds

Available in A and F Series, the Funds conform with the regulatory framework related to alternative mutual funds offered by the Simplified Prospectus. The Funds are offered through licensed investment dealers, priced daily, with daily liquidity and available through FundServ.

About Connor, Clark & Lunn Funds Inc.

Connor, Clark & Lunn Funds Inc. partners with leading Canadian financial institutions and their investment advisors to deliver unique institutional investment strategies to individual investors through a select offering of funds, alternative investments and separately managed accounts.

By limiting the offering to a focused group of investment solutions, CC&L Funds is able to deliver unique and differentiated strategies designed to enhance traditional investor portfolios. For more information, please visit www.cclfundsinc.com.

About Connor, Clark & Lunn Investment Management Ltd.

Connor, Clark & Lunn Investment Management Ltd. is one of the largest independent partner-owned investment management firms in Canada with $76 billion in assets under management. Founded in 1982, CC&L Investment Management offers a diverse array of investment services including equity, fixed income, balanced and alternative solutions including portable alpha, market neutral and absolute return strategies. For more information, please visit www.cclinvest.com.

About PCJ Investment Counsel Ltd.

Founded in 1996, PCJ Investment Counsel Ltd. is an independent privately owned investment manager focused on large and small cap Canadian equities and alternative investments including equity market neutral and long/short strategies. With approximately $1 billion in total assets under management, the firm has a deep and stable portfolio management team focused on identifying and exploiting unique investment opportunities, and constructing portfolios with attractive risk return characteristics. For more information, please visit www.pcj.ca.

About Connor, Clark & Lunn Financial Group Ltd.

Connor, Clark & Lunn Financial Group Ltd. is an independently owned, multi-affiliate asset management firm that provides a broad range of traditional and alternative investment management solutions to institutional and individual investors. CC&L Financial Group brings significant scale and expertise to the delivery of non-investment management functions through the centralization of all operational and distribution functions, allowing talented investment managers to focus on what they do best. CC&L Financial Group’s affiliates manage over $139 billion in assets. For more information, please visit www.cclgroup.com.


Contact

Joanna Lewis, CIM
Associate, Product & Client Service
Connor, Clark & Lunn Funds Inc.
416-365-5296
[email protected]

Cityscape in the heart of Sudirman Street in Jakarta, Indonesia.

In early March, our emerging markets team traveled to Jakarta, Indonesia. Given the political transition following the presidential election last year and ongoing macroeconomic headwinds, we sought to assess the market firsthand. For bottom-up investors, Indonesia has long been one of the most promising equity markets in Emerging Asia, and despite near-term challenges, we continue to see compelling long-term investment opportunities.

Jakarta can be a difficult city to navigate, but with the onset of Ramadan, the usual congestion was noticeably lighter, allowing us to efficiently move between meetings. As the world’s largest Muslim-majority country, Indonesia experiences notable shifts in consumer behavior and urban activity during the holy month. While moving around the city, we were particularly impressed by the quality of Jakarta’s road infrastructure, which, in many areas, exceeds what we have seen in the capitals of more developed countries. The improvements in connectivity and urban planning are a testament to Indonesia’s infrastructure investments over the past decade. Over the course of the week, we met with companies across the consumer, healthcare, real estate and industrial sectors, gaining valuable insights into the country’s evolving economic landscape.

A recurring theme in our discussions was the growing fragility of the Indonesian consumer, particularly in Java, the most economically and demographically significant of Indonesia’s 17,000 islands, accounting for 56% of the population and 57% of GDP. Over the past few years, real wage growth has lagged inflation, eroding purchasing power across all income segments. However, while businesses serving the urban middle class are experiencing a notable slowdown, some ex-Java regions have shown resilience, benefiting from recent minimum wage increases, social aid for low-income groups, commodity-linked employment and past infrastructure investments.

This consumer sentiment is most evident in downtrading, as households opt for cheaper alternatives across food, personal care and general merchandise. A notable trend has been the shift away from multinational companies, such as Unilever, in favour of more affordable local alternatives that offer comparable quality at lower price points. Companies in healthcare and discretionary retail are reporting lower volumes, even as premium segments remain more stable. Our meetings and channel checks confirmed that consumption weakness among middle-income consumers is entrenched, creating a challenging near-term outlook for businesses exposed to domestic demand.

The continued depreciation of the rupiah adds to the pressure. The currency is among the worst-performing in Asia year to date, despite active central bank interventions. Foreign investors have pulled USD1.8 billion from Indonesian equities this year, and on March 18, the Jakarta Composite Index triggered a trading halt after a 5% intraday drop, highlighting nervousness in the local market.

Although the new government has set ambitious economic targets, many investors remain cautious about execution risks. President Prabowo has announced a goal of achieving 8% GDP growth, a level Indonesia has not seen since 1995. With structural constraints and weak private sector investment, breaking out of the 5% growth range recorded in recent years remains a significant challenge.

One of the government’s most ambitious initiatives is the Danantara Sovereign Wealth Fund, designed to consolidate state-owned assets and fund strategic projects. Danantara has a goal of reaching USD900 billion in assets under management, which would make it one of the largest sovereign wealth funds globally. However, questions remain about its governance, transparency and the potential impact on state-owned enterprises (SOEs). With Danantara expected to rely on SOE dividend payouts, banking and energy sectors could see their capital allocation priorities altered.

At the same time, the government’s pivot away from infrastructure spending raises concerns about long-term economic sustainability. Over the last decade, Indonesia’s growth has been supported by significant public infrastructure projects, such as the Trans-Java Toll Road, which improved connectivity and regional economic development. The decision to reallocate resources toward populist policies, such as the free school meal program, has introduced fiscal uncertainties, particularly as recent revenue collection fell short of expectations.

Implementing free school meal programs has proven effective in combating malnutrition and improving educational outcomes in various countries. For instance, India’s Mid Day Meal Scheme, which serves nutritious lunches to over 97 million children daily, has led to increased school attendance and a 31% reduction in anemia prevalence among adolescent girls. However, executing such an initiative across Indonesia’s vast archipelago presents significant logistical challenges. Ensuring the consistent distribution of fresh meals to remote and diverse regions requires substantial infrastructure and coordination efforts.

Beyond economic policies, we noted concerns about the rising military presence in government institutions, a development that some investors worry could signal a shift toward a more centralized power structure. While Indonesia has undergone remarkable democratic progress since the fall of Suharto’s authoritarian rule in 1998, memories of military-dominated governance still linger. While this shift has raised alarms among some observers, it is important to distinguish today’s political landscape from the Suharto era, as institutional limits on military influence have since been established.

For foreign investors, rule of law, policy predictability and strong institutions remain critical factors in assessing investment opportunities. Any perception of reduced transparency or shifts away from a market-driven economy could weigh on investor sentiment. While the trend warrants monitoring, fears of a full-scale return to military-dominated governance appear overstated.

Despite macro headwinds, Indonesia continues to offer structural advantages that make it one of the most attractive long-term investment destinations in Emerging Asia. With a population of over 270 million and a median age of just 30, the country remains one of the largest and youngest consumer markets globally.

Amid the macroeconomic pressures, healthcare remains one of Indonesia’s most resilient sectors, driven by rising demand and structural under-penetration. The country’s healthcare expenditure stands at only ~3% of GDP, one of the lowest in ASEAN, with the doctor and hospital bed ratios per 1,000 inhabitants (0.7 and 1.2, respectively) remaining well below the global average. The positive demographic trend and government-backed healthcare program (BPJS Kesehatan) continue to support patient volumes, with private hospital networks benefiting from both scale efficiencies and growing intensities. As Indonesia works to improve access to quality healthcare and expand private insurance adoption, the sector presents compelling long-term growth potential, even in a more challenging economic environment.

Indonesia has demonstrated resilience through past economic cycles, maintaining a relatively strong external position with foreign exchange reserves of approximately USD155 billion and government debt at ~39% of GDP. In 2024, the country recorded a current account deficit of 0.6% of GDP and a fiscal deficit of 2.3% of GDP, both within a manageable range for an emerging market. From a valuation perspective, Indonesian equities are now trading at very compelling levels, with the Jakarta Composite Index (JCI) at ~11x forward P/E, roughly two standard deviations below its 10-year average.

Line graph illustrating the levels of the Jakarta Composite Index over the last ten years.
Source: Bloomberg

If global monetary conditions ease, Indonesia could be well-positioned for a rerating.

In this environment, stock picking is key. We continue to focus on companies with strong pricing power, resilient demand drivers and long-term structural advantages – qualities exemplified by our holdings in Sido Muncul and Mitra Adiperkasa.

Industri Jamu Dan Farmasi Sido Muncul Tbk PT (SIDO IJ) is Indonesia’s leading producer of traditional herbal medicines and functional beverages. Its flagship brand, Tolak Angin, is synonymous with natural flu and cold relief, commanding a market share of 72% in the herbal cold symptoms product category and enjoying strong consumer loyalty and premium pricing power while remaining a staple of Indonesian households. The company’s vertically integrated supply chain improves cost efficiency, further strengthening its margin resilience in an inflationary environment. Unlike many consumer goods companies that face pressure from rupiah depreciation, Sido Muncul is largely insulated from currency volatility as its raw material sourcing and key input costs are primarily local. With a net cash position and ~7% dividend yield, Sido Muncul combines defensive qualities with long-term structural growth, supported by expansion into functional beverages and overseas markets.

Mitra Adiperkasa Tbk PT (MAPI IJ) is Indonesia’s largest specialty retailer, operating a diverse portfolio of global brands, including Zara, Sephora, Nike, Starbucks and Apple (via authorized retail partnerships). The company benefits from strong pricing power through exclusive brand partnerships and a premium positioning, which allows it to maintain healthy performance even in softer consumption periods. While mass-market retail faces headwinds, Mitra Adiperkasa is well-positioned in the more resilient mid-to-premium consumer segment. Its long-term structural advantages stem from strong brand relationships, a well-executed omnichannel strategy and a track record of navigating economic cycles, making it a long-term winner in Indonesia’s evolving retail landscape.

Indonesia is experiencing a challenging economic transition, but its long-term structural advantages remain intact. Our Indonesian holdings are positioned for strong business fundamentals despite macro volatility.