Taiwan city skyline and skyscrapers.

Currency intervention across Asia in recent weeks may be yet another signal that we are entering a new investment order. We have written to clients previously that a secular peak in the USD likely occurred at the end of 2022.

Looking back to previous peaks in the 1970s and 1980s under Nixon and Reagan respectively, the dollar provided a powerful signal to investors that the US economy was experiencing major distortions that would force policy intervention.

President Trump’s Liberation Day tariff shock is part of a broader play to reinvigorate the competitiveness of American manufacturing. Another key pillar of the strategy is the desire for a weaker dollar. We are now starting to see this play out in Asian currency markets.

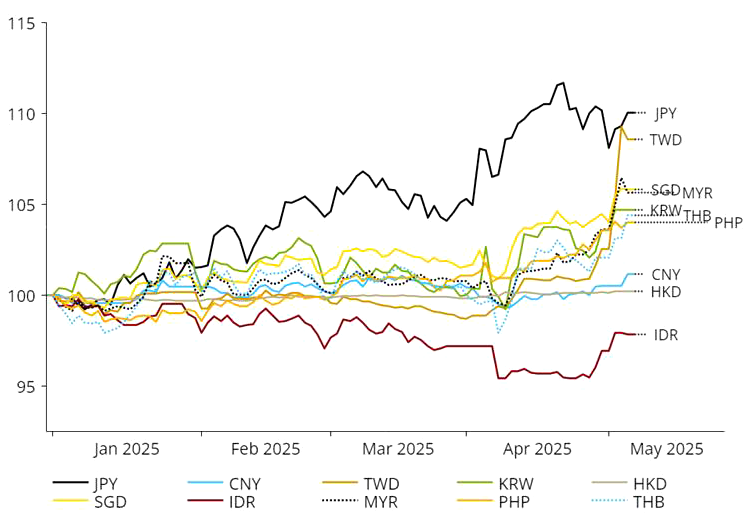
The most dramatic moves were in the Taiwan dollar, which surged by 9% over two trading days, reaching three-year highs and logging its sharpest daily gains since at least 1981.

East Asia currencies vs US dollar
31 December 2024 = 100
Graph showing the value of East Asia currencies versus the US Dollar over time since January 2025.Source: NS Partners and LSEG (May 2025)

Currency tremors may signal the start of a broader shift in global capital that could have big implications for which markets out- or underperform going forward. As the Financial Times reported in “The Coming Asian FX ‘avalanche’” (7th of May 2025) quoting Eurizon’s Stephen Jen:

“We have long warned about the ‘Avalanche’ risk for the dollar. There could be USD2.5 trillion worth of ‘snow’ in China and more from the likes of Taiwan, Malaysia and Korea, rising at a pace of USD500 billion a year – we conservatively guesstimate. Only a modest proportion of the very large trade surpluses these countries have earned have been repatriated back home, with the bulk of the export earnings being hoarded by exporters in USD deposits.

“Like in actual avalanches, ex-ante, many might dismiss the warnings, but ex-post, all would admit that it was an obvious risk. We are still waiting for more triggers, but we see the sharp sell-off in USDTWD this week from this Avalanche perspective. We predict there will likely be other sudden lurches lower in USDAsia in the coming quarters. Corrections in USDAsia could pacify the US, as Asia accounts for more than half of all US trade deficit, making this a fundamentally benign development, except for those caught long dollars.

“The overhang of liquid dollar holdings is just too large if the dollar weakens, the Fed cuts interest rates, and China stages a cyclical rebound. In other words, both the push and pull factors that kept the export earnings in dollars outside the home countries in the past years will potentially flip signs in the coming quarters. At the same time, many of those holding long-dollar exposures know very well that the dollar is over-valued.”

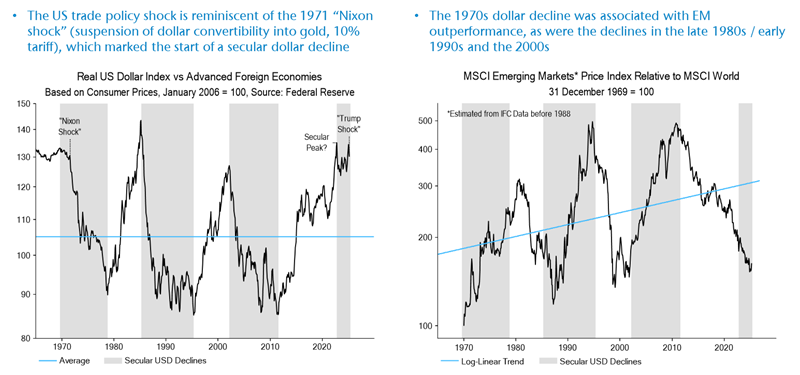
Emerging markets love a falling dollar, which is an environment we’ve not seen in over 13 years.

Two line graphs side by side. The first illustrates the similarity of the current US trade policy shock with the "Nixon Shock" of 1971. The second illustrates the outperformance of emerging markets at the same times as these policy "shocks."Source: LSEG Datastream

Historically, this has seen EM outperform DM, while the winners and losers within the asset class also rotate. For instance, while the strong dollar environment typically favoured EM exporters, a weak dollar would be a shot in the arm for domestic consumers.

Other markets which could surge are those which the United States permits to manage their currencies against a falling dollar by easing monetary policy. There are a number of other smaller EM economies with managed exchange rates which could enjoy surging liquidity that feeds bull markets in financial assets.

The cleanest example of this currency-liquidity transmission is the Hong Kong dollar peg. When the USD falls, the Hong Kong Monetary Authority intervenes to maintain the HKD peg by buying USD and selling HKD, increasing HKD supply. This surge in liquidity lowers interest rates, stimulates economic activity and can lead to higher asset prices (and inflationary pressures).

Our liquidity analysis should be a powerful tool for identifying the risks of both booms and busts if this trend continues.

It’s all about pricing power for the export winners

While exporter stock prices may pop in the coming months on better tariff news, currency dynamics could be important drivers of future outperformance. Let’s use Taiwan Semiconductor Manufacturing Company (TSMC) as an example at the stock level. The company has previously given clear guidance that every 1% of appreciation in the TWD against the USD is a 0.4 ppt hit to OPM. We roughly model this impact out below to illustrate the currency risk to earnings:

EPS Q1 25a Q2 25e Q3 25e Q4 25e 2025 Implied PE Implied share price with 17x Fr current
share px
Consensus 13.9 14.8 15.7 15.5 60.0 15.4 1019 11%
FX Impact (10%+) 13.9 13.7 12.7 12.1 52.4 17.5 891 -3%
FX Impact (15%+) 13.9 13.1 12.1 11.5 50.6 18.2 861 -6%
FX Impact (20%+) 13.9 12.5 11.5 10.9 48.8 18.8 830 -10%

If we assumed a further appreciation of TWD/USD to 25 – a 20% appreciation from where TSMC recently guided (when TWD/USD was 33) – the hit to TSMC’s EPS is around 23%.

If we apply a mid-cycle PE (17x) to the company and factor in the earnings hit from the currency shift, that would take us to a stock price of TWD830 from the TWD950 at the start of May.

Adding to the risk is the unpredictability of tariffs negotiations between the United States and Taiwan. Tariffs above 20% on Taiwan semiconductor exports could be a meaningful hit to earnings. Perhaps authorities in Taiwan are allowing the TWD to appreciate as part of a pitch to avoid tariffs.

Mitigating the risks is TSMC’s immense pricing power. We believe robust demand will persist for the leading-edge chips enabling AI where it has a monopoly status. This positions TSMC to pass through a significant portion of price increases to its customers.

However, players in the more commoditised segments of the semiconductor industry which lack the moats and pricing power will be more vulnerable to hits from tariffs and currencies.

UK monetary trends have been arguing for faster MPC easing. Labour market news is now reinforcing the message.

Employment developments appear notably weaker in the UK than in other major economies. The PAYE payrolled employees series fell by 0.09%, 0.15% and a provisional 0.11% in February, March and April respectively. These declines are the equivalent of falls in US non-farm payrolls of 140k, 240k and 170k.

US payrolls, of course, have risen respectably year-to-date, while Eurozone employment grew by 0.3% in Q1.

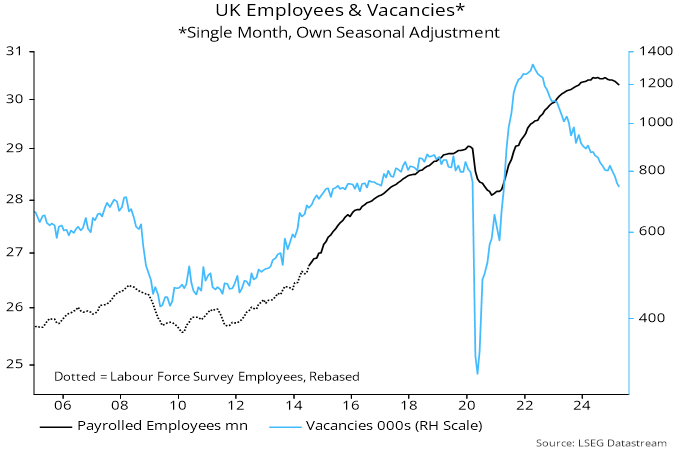
The February-April UK payrolls contraction followed a pick-up in the rate of decline of the official single-month vacancies series (seasonally adjusted here), which has fallen to its lowest level since 2016 – see chart 1.

Chart 1

Chart 1 showing UK Employees & Vacancies* *Single Month, Own Seasonal Adjustment

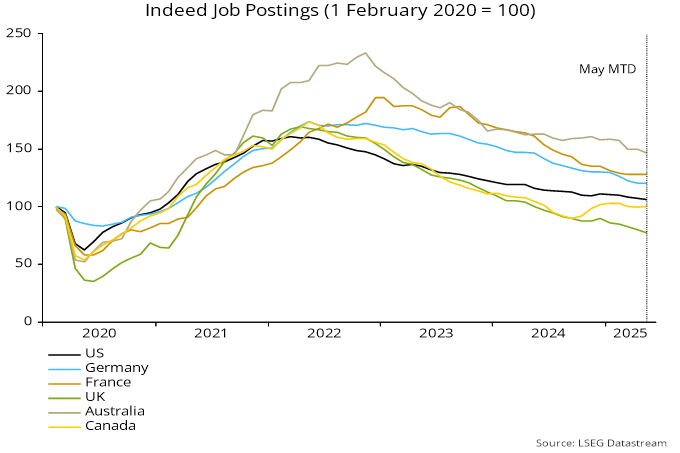
Indeed job postings numbers closely track the official vacancies series and have declined further so far in May – chart 2. The Indeed numbers have fallen by more in the UK than elsewhere, to a lower level relative to the pre-pandemic (February 2020) starting point – chart 3.

Chart 2

Chart 2 showing UK Vacancies* & Indeed Job Postings *Single Month, Own Seasonal Adjustment

Chart 3

Chart 3 showing Indeed Job Postings (1 February 2020 = 100)

UK underperformance may be partly attributable to government-imposed rises in labour costs, in the form of the increases in employer national insurance and the minimum wage, and prospectively via the Employment Rights Bill.

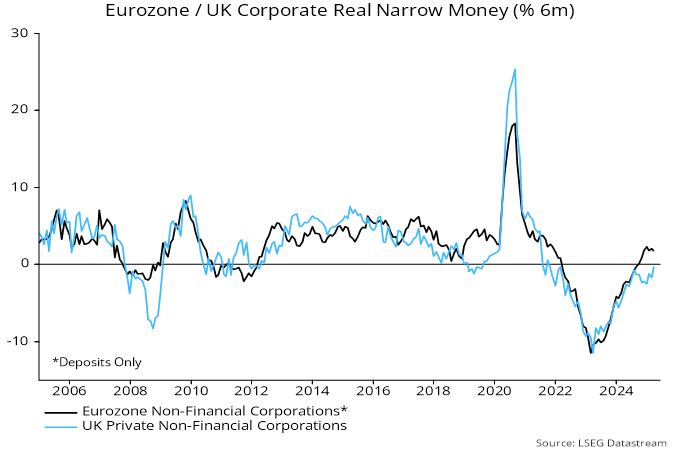
Pessimism here about employment prospects, however, also reflected weak corporate money trends. The six-month rate of change of real M1 holdings of non-financial corporations has remained negative, in contrast to a rise into solid positive territory in the Eurozone – chart 4.

Chart 4

Chart 4 showing Eurozone / UK Corporate Real Narrow Money (% 6m)

Relative money weakness suggested that UK firms were under greater financial pressure to cut costs than their Eurozone counterparts.

A hopeful sign is that UK six-month corporate real money momentum has recovered recently, narrowing the gap with the Eurozone. A key issue is whether this revival is sustained as the NI and minimum wage hikes take effect.

UK employment weakness appears at odds with Q1 GDP “strength”. The UK quarterly numbers, however, have been volatile and year-on-year growth of 1.3% in Q1 is little different from the Eurozone (1.2%).

Front-running of US tariffs temporarily boosted GDP in the rest of the world last quarter. US real imports rose by 10.8%, equivalent to 1.4% of US GDP, between Q4 and Q1. GDP in the rest of the world is 2.7 times the US level measured at current market prices and 5.8 times based on purchasing power parity. Depending on which divisor is used, the US imports increase implies a 0.25-0.5% lift to GDP elsewhere.

Three indicators that signalled the 2021-22 global inflation spike and reversal continue to suggest a favourable outlook.

G7 annual broad money growth led the rise and fall in annual consumer price inflation by about two years, consistent with the rule of thumb suggested by Friedman and Schwarz.

The global manufacturing PMI delivery times index – a measure of supply constraints / shortages – led by about a year.

The annual rate of change of commodity prices – as measured by the energy-heavy S&P GSCI – led by nine months.

Chart 1 overlays the three series, with respective leads applied, on G7 annual inflation.

Chart 1

Chart 1 showing G7 Consumer Prices (% yoy) & Three Leading Indicators (Broad Money, PMI Delivery Times & Commodity Prices)

The latest readings of all three are below their averages over 2015-19. Those averages were associated with average headline and core inflation of below 2% (i.e. allowing for the stated lead times).

Directionally, the suggested influence of the three indicators over their respective forecast horizons is down for commodity prices, sideways for delivery times and up for broad money growth. The latter recovery, however, is from extreme weakness.

In combination, the level and directional signals suggest that inflation will move down into early 2026, with limited recovery over the following year.

Tariffs may affect the profile but are unlikely to change the story. A mechanical boost to US prices in Q2 / Q3 will drop out of the annual inflation rate a year later. The effect may be to push out the inflation low from early 2026 to later in the year.

Tariffs could have a larger and more sustained impact by snarling up supply chains and disrupting production, resulting in delivery delays and shortages.

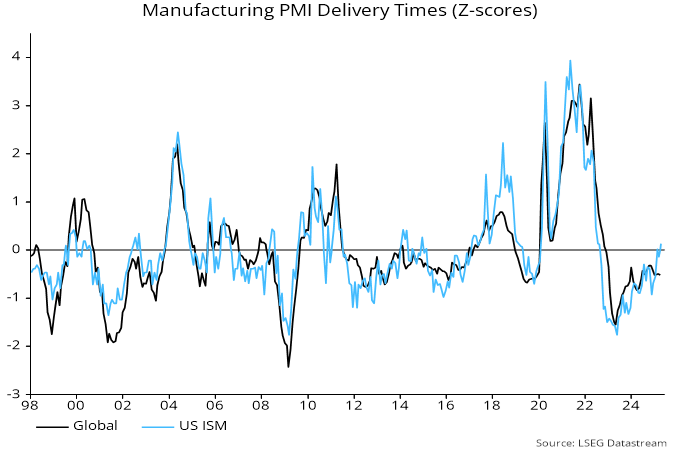
The global manufacturing PMI delivery times index currently remains below its long-run historical average, as well as its average over 2015-19 – chart 2.

Chart 2

Chart 2 showing Manufacturing PMI Delivery Times (Z-scores)

Delivery times have risen in the US but the ISM manufacturing supplier deliveries index is only back to its average.

Reduced exports to the US will increase excess supply in the rest of the world, depressing delivery times and pricing power, balancing upward pressure in the US.

Any tariff boost to inflation will persist over the medium term only if associated with a rise in broad money growth. This could occur if central banks ease policies excessively, because of actual or feared economic weakness, or perhaps to limit upward pressure on currencies. Alternatively, inflation worries could deter non-bank purchases of government debt, resulting in banks being required – voluntarily or otherwise – to fund a larger proportion of (wide) fiscal deficits, creating money in the process.

Such scenarios are plausible but the inflationary effects of any broad money acceleration would be unlikely to appear before 2027.

The two flags for Mexico and Brazil on textile cloth.

President Trump’s spree of tariffs has incited many global leaders to respond in kind by imposing their own tariffs on US exports. But not all leaders have been pulled into the tit-for-tat game. Mexico and Brazil’s economies depend on trading relationships with the United States and their leaders have employed different strategies with which to respond to Trump’s tariffs.

Mexico

The United States is Mexico’s largest trading partner by far. Mexico was the second-largest destination for US exports and the top source of US imports. In 2024, Mexico exported an estimated USD505.9 billion: over 80% of total Mexican goods exports were to the United States and over 40% of total Mexican goods imports were from the United States.

Mexico’s largest exports to the United States include vehicles and automotive parts, followed by electrical equipment like computer data processing units, as well as medical instruments and fruits and vegetables. Given the relationship between the countries, Mexican President Claudia Sheinbaum has a crucial part to play to reduce impacts.

President Trump threatened Mexico with tariffs if there was no increase in effort to reduce fentanyl trafficking. Mexico responded by placing 10,000 troops at the border to reduce drug trafficking and illegal entry, but did not react with reciprocal tariffs, unlike China and Canada. We believe this has played well given that the United States has not implemented any additional tariffs, whereas other countries received a range of 10% to 49%.

Sheinbaum is prioritizing a commercial relationship with the United States and Trump has adopted a warmer tone with Sheinbaum than with foreign leaders who have matched his confrontational style. This strategy has been received well not only by Trump, but by Mexico’s citizens – Sheinbaum’s popularity has surpassed that of previous Mexican leaders.

Bar graph illustrating the popularity of previous Mexican presidents, showing that President Sheinbaum is in the lead.

A company we like in Mexico is Bolsa Mexicana de Valores, S.A.B. de C.V. (BOLSAA MX). Bolsa is a Mexico-based stock exchange operator that functions as an integrated and organized market for equities, financial derivatives and OTC fixed-income instruments. It has access to custody, clearing and settlement of transactions and the sale of information.

The company generates over 50% of revenue through transaction fees. Bolsa should be seeing benefits, given the volatility of the market and the high volume of transactions as investors try to capitalize.

Brazil

The United States’ total goods traded with Brazil was an estimated USD92 billion in 2024, and imports from Brazil in 2024 totaled USD42.3 billion. Industrials comprised over three quarters of Brazilian exports to the United States. Key industrial products exported include crude oil, aircraft, coffee, cellulose and beef.

Brazilian President Luiz Inacio Lula da Silva (also known as “Lula”) has been in a tough spot. As the trade fight escalates between Brazil’s two largest trading partners, Lula does not want to have to choose between China or the United States. China has been Brazil’s largest trading partner for the last 15 years and this relationship has only grown.

The United States has implemented just 10% tariffs on Brazil. Lula has not retaliated, which we believe has worked in his favour, and recent approval ratings reaffirm.

Line graph illustrating the popularity of Brazilian President Lula over time, showing that his approval ratings are recently rising.

A company we like in Brazil is Vivara Participações S.A. (VIVA3 SA). Vivara is the largest jewelry player in Brazil. The company sells jewelry, watches and luxury accessories under two different brands: Vivara and Life.

Vivara has unparalleled scale, doubling their store footprint since 2018 with 265 Vivara and 180 Life stores representing 20% market share. The next four jewelry players represent a total of 6%, and the remaining smaller players represent 74%. Vivara has built all its production steps vertically, manufacturing ~80% of products sold. Vivara’s main production facility is in the Free Economic Zone of Manaus where it benefits from certain business tax incentives. The company currently trades at a P/E ratio of 7x which is half the multiple that its global luxury jewelry peers trade at.

Nova Scotia's iconic Peggys Cove Lighthouse on a sunny day.

Listen to the latest episode of the East of Montreal podcast featuring Jeff Wigle, Managing Director and Group Head at Banyan Capital Partners, as he discusses our private equity strategy, experience investing in Atlantic Canada and Newcrete and his views of the current market.

Listen to the full episode of the East of Montreal podcast.

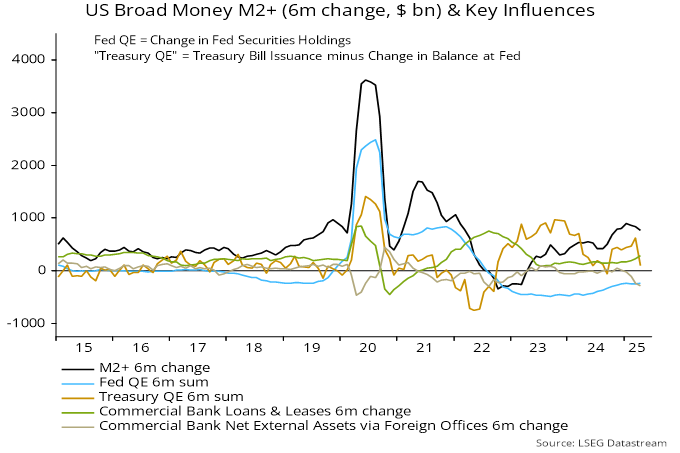
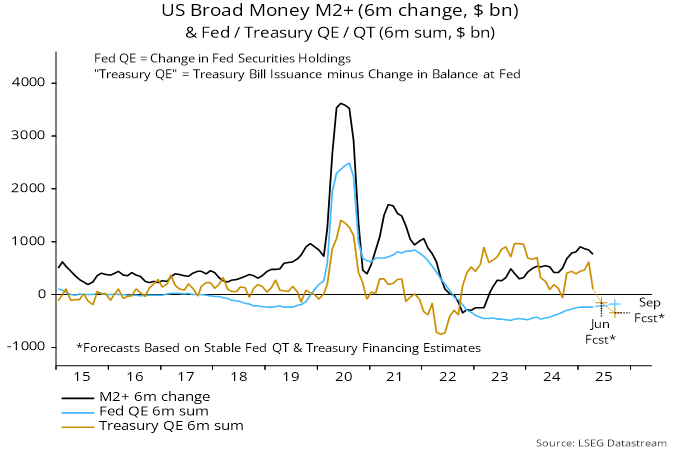
US broad – and probably narrow – money growth has been boosted recently by reduced issuance of Treasuries due to the debt ceiling constraint. The accompanying enforced run-down of the Treasury’s cash balance at the Fed has resulted in a resurgence of “Treasury QE”, a proxy for monetary deficit financing. This has more than offset (reduced) Fed QT – see charts 1 and 2.

Chart 1

Chart 1 showing US Broad Money M2+ (6m change, $ bn) & Fed / Treasury QE / QT (6m sum, $ bn)

Chart 2

Chart 2 showing US Broad Money M2+ (6m change, $ bn) & Sum of Fed & Treasury QE / QT (6m sum, $ bn)

Conditional on an early lifting of the debt ceiling, however, the Treasury’s financing estimates imply a dramatic reversal over the remainder of Q2 / Q3. The plans involve “catch-up” issuance to restore the Treasury balance to its prior level, with coupon debt – rather than bills – bearing most of the burden. (Coupon sales to non-banks contract the broad money stock; bills are more likely to be purchased by money funds and banks, implying a neutral monetary influence.)

The Fed could neutralise most of the negative Treasury impact by suspending QT. Still, the joint Fed / Treasury influence would swing from being significantly expansionary to neutral or slightly contractionary.

The suggested loss of money momentum could be offset by other factors. A similar swing in the joint influence in Q2 / Q3 2024 was associated with a minor slowdown in broad money as it coincided with a pick-up in bank lending growth.

Will a rebound in issuance put upward pressure on Treasury yields? Over 2010-19, Fed QE / QT – and the joint Fed / Treasury influence – was positively correlated (weakly) with the 10-year yield, i.e. the yield tended to rise when the Fed absorbed more supply and fall when it wound down purchases or ran down holdings.

A possible explanation is that the impact of the Fed’s actions on monetary trends and thereby economic prospects outweighed the direct yield impact of reduced or increased Treasury supply to the market. The suggested negative swing in the joint Fed / Treasury influence, therefore, could be associated with lower not higher yields.

Using smartphone & laptop to view gambling app.

Nobody is as opiniated as a fan of a particular sport team. This probably explains why there exist so many metrics for any given professional sport: to justify why your team is the better team. Despite multiple millions of data points now gathered per baseball game, no one seems to be replicating the success of the Moneyball story, but that doesn’t stop fans from spending hours upon hours analyzing data in an attempt to make a quick dollar from sports betting.

Sports betting was legalized in the United States in 2018 after the Supreme Court decision to strike down the Professional and Amateur Sports Protection Act (PASPA). Since then, 39 states have legalized sports betting, and that number is expected to reach 45 in the next two to three years. The US market therefore represents a large opportunity compared to the more mature international markets:

Modern sports betting is much more data-driven and real-time than it was just 10 years ago when the majority of bets were simply on which team would win. Now, more than half of bets are made during the games (in-play betting) and can be made on virtually anything from coin toss (NFL), first foul (NBA) or number of fights (NHL). This new breadth of betting requires robust data integrity and is therefore why industry stakeholders must rely on a single source of truth (read: data providers).

“Without data you’re just another person with an opinion.” – W. Edwards Deming, Statistician

The professional sports data-aggregation business is essentially a duopoly run by Sportradar Group AG (SRAD US) and Genius Sports Ltd. (GENI US), and Global Alpha is a shareholder of both. These two companies offer B2B data and technology solutions for the sports industry. The core of their business models is to hold streaming rights and exclusive data acquisition for specific sports leagues that are then sold to sportsbook operators like DraftKings and Flutter. They also offer solutions back to sports leagues, teams and broadcasters such as data analytics and insights, as well as augmented display and data overlay or even odds creation.

The lucrative reason for their existence is straightforward: the technology platforms used to collect, clean and aggregate live data require specific expertise that sports leagues do not possess and would be expensive to replicate; it is much easier for leagues to outsource to SportRadar and Genius Sports and benefit from the materially increased consumer engagement as well as royalties.

SportRadar was founded in 2001 and was one of the first online live sports statistics data collection websites. Its initial public offering (IPO) happened in 2021 and it owns rights to the NBA, NHL, MLB, F1 and the European Football League.

Illustration of Sportradar's relationships with sports leagues and sportsbooks.

Genius Sports is the new(er) kid in the industry, resulting from a merger of Betgenius and SportingPulse in 2016 to create a direct competitor to SportRadar. It owns data rights to NCAA, NASCAR, NFL, PGA Tour and European Basketball.

Illustration of Genius Sports' relationships with sports leagues, sports betting and broadcasters.

These two companies check many of the boxes we look for when investing:

  • The majority of revenue is steady, predictable and globally diversified.
  • A net cash position and resilient balance sheet allowing for flexibility and potential M&A.
  • A large growing market with catalysts for accelerated growth.
  • A competitive advantage that is unlikely to be challenged over our investment period.

Between the two companies, SportRadar and Genius Sports own the official rights to virtually all major western sports leagues. Furthermore, they have been developing other angles for partnering with leagues beyond just distribution of data and they’re progressing toward becoming their technology arms. Through their data aggregation and technology solutions, the US sports-betting players are poised to grow and with plans for future innovation, they look to be investments you could bet on.

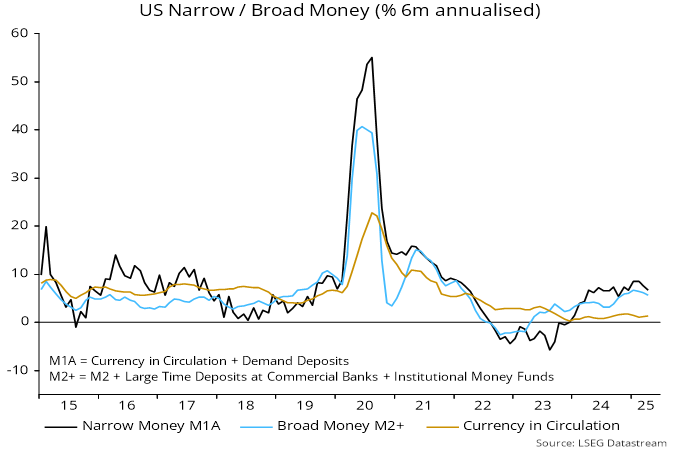
Eurozone March money numbers were mixed, suggesting that further ECB policy easing will be required to insulate the economy from global weakness.

Positively, six-month real narrow money momentum rose further in March, almost closing the gap with the US – chart 1.

Chart 1

Chart 1 showing Real Narrow Money (% 6m)

The six-month change, however, conceals a pull-back in growth in the latest three months, with broad money also slowing. Bank loan expansion has retained momentum but is a coincident / lagging indicator, while money leads – chart 2.

Chart 2

Chart 2 showing Eurozone Narrow / Broad Money & Bank Lending (% 3m annualised)

Annual broad money growth has stalled well below a level likely to be consistent with achievement of the 2% inflation target over the medium term – chart 3.

Chart 3

Chart 3 showing Eurozone Consumer Prices & Broad Money (% yoy)

Weaker narrow money growth in the latest three months may reflect a downward revision of spending intentions in response to US policy news. A Q1 rise in longer-term bond yields may also have acted as a dampener, though has since reversed.

The fall in broad money growth was driven mainly by a slowdown in banks’ net external assets, according to the credit counterparts analysis. The government contribution has been positive recently, with the ECB’s passive QT more than offset by securities purchases by banks – chart 4.

Chart 4

Chart 4 showing Eurozone M3 & Credit Counterparts Contributions to M3 % 3m

Conceptually, the change in banks’ net external assets is the counterpart of the basic balance of payments position (current account plus net direct and portfolio investment). The basic balance surplus has fallen back as the current account surplus has moderated and a deficit on the direct / portfolio capital account has widened – chart 5.

Chart 5

Chart 5 showing Eurozone Balance of Payments (£ bn, 6m sum)

The capital account deterioration mainly reflects transactions in short-term debt securities, possibly motivated by changes in interest rate differentials.

Changes in the basic balance have been weakly correlated with exchange rate movements historically. Still, the fall in the surplus casts doubt on forecasts of further euro strength.

A field of solar panels with oil pumps in the background.

Since taking office in January, the Trump administration has attacked the wind and solar energy industry. It withdrew the United States from the Paris climate agreement and rolled back the Inflation Reduction Act (IRA).

President Donald Trump took swift action on the first day of his second term. He paused federal permits and leasing for onshore and offshore wind projects and ordered a review of existing leases. On April 17, he went even further and blocked work on a wind project already in progress off the shores of New York State.

This is not a new direction for President Trump.

In January 2018, the first Trump administration put a 30% tariff on solar panel imports. Despite the challenges, the federal Investment Tax Credit (ITC) remained in place and the solar energy industry continued to grow. However, amid much confusion in the tariff announcements and rollbacks of the last few weeks, solar cells were not exempted from US tariffs and are now subject to tariffs that range from 50% to 3,521%. If we add the 25% tariffs on steel and aluminum imports, the cost of installing solar energy has increased dramatically.

Why is this important?

In the last two decades, the growth in both US oil and gas production and in renewables made the United States an energy superpower that enjoyed a competitive advantage over most countries.

Electricity prices for enterprises worldwide in March 2024, by country (in USD per kilowatt-hour)

UK 0.52 Mexico 0.19
Italy 0.43 Canada 0.14
Singapore 0.32 India 0.12
Japan 0.19 Brazil 0.11
France 0.18 China 0.09
USA 0.14  

Source: Statista

However, in the last few years, with the reduction in costs for solar and wind energy, the cheapest additional kilowatt of electricity is wind-powered, closely followed by solar (taking into account capital cost, operating costs and efficiency). The advantage the United States is currently enjoying will disappear fast and become a disadvantage by 2035 – possibly before.

It is already a major disadvantage compared to China.

While the United States backtracks, China is accelerating, installing more wind and solar power last year than ever before. The nation built capacity for 357 gigawatts (GW) of solar and wind power generation, a 45% and 18% respective increase over what was operating at the end of 2023, according to China’s National Energy Administration. That is equivalent to building 357 full-sized nuclear plants in one year.

The United States also had a record clean energy installation in 2024, supporting millions of jobs. Although less than China, it built capacity for 268 GW of solar and wind energy, according to preliminary numbers from the American Clean Power Association.

With the restrictive legislation put in place by the administration, the impact of tariffs, the complexity of multiple jurisdictions, as well as multiple grid operators with complex interconnections, the cost to install a GW of solar or wind power in the United States is now among the highest in the world: twice that of the UK or Germany and over 400% more than in China.

As the share of renewables in total electricity generation increases, the United States will soon face some of the highest electricity costs in the world. This, at a time when demand is increasing significantly – driven by AI, data centres, warming temperatures, etc. – will prove to be costly.

Let us examine how various countries and region are investing in renewables:

Europe

The Ukraine war was an enormous shock for Europe. About a quarter of the energy Europe consumes comes from natural gas and before the Ukraine war, much of that gas came from Russia. Europe needed a new source of gas quickly. It built LNG terminals and increased its imports from the United States, Norway and Qatar. As a result, Russia’s natural gas now accounts for less than 12% of Europe’s imports.

High energy prices pushed Europe to accelerate the green transition. Renewables doubled as a share of EU energy consumption from 2004 to 2022 but still accounted for only about 20% of total consumption.

In 2023, the EU increased its 2030 target for renewable energy from 32% (set in 2018) to 42.5%. By easing regulations surrounding new projects, it should reach that target ahead of the deadline.

EU countries invested over €110 billion in renewable energy generation in 2023 – ten times more money than it invested in fossil fuels. The EU wants to end its dependence on foreign sources.

Investment in the energy transition ($ billion), by region
GACM_COMM_2025-04-24_Chart01
Source: Bloomberg NEF. From 2020, grid investments are added.

Solar power is booming in Asia and Europe
Total installed solar power capacity
GACM_COMM_2025-04-24_Chart02
Source: IRENA 2024

What about China?

Clean energy contributed a record 10% of China’s GDP in 2024, represented 40% of the economic growth in China and overtook real estate sales and agriculture in value. China’s 2024 investment in clean energy alone was close to the global total invested in fossil fuel and was similar in size to Saudi Arabia’s entire economy.

China’s investment in solar power capacity has risen 10-fold in five years
Value of investments in new clean power capacity, billion yuan
GACM_COMM_2025-04-24_Chart03
Source: CREA analysis for Carbon Brief.

Solar and other clean energy sources have gone global in the past decade. In 2010–2015, 70% of solar and 50% of global wind installation occurred in developed economies. By 2023, these proportions had fallen to just over 20%. The United States now represents only 7% of the global market for newly installed solar power plants. The EU is around 12% while the rest of developed economies is around 47%.

The United States has imposed tariffs on imports from China for a long time. As a result, most of the United States’ clean energy supply now comes from Southeast Asia which was just imposed new tariffs of up to 3,521%. Only 4% of China’s total exports of solar power and wind power equipment and electric vehicles (EVs) go to the United States. Almost half of China’s export of clean energy products now go the Global South.

So, despite what looks like a step backward in the United States, the rest of the world is moving on.

According to the IEA (International Energy Agency), global renewable electricity generation is forecast to climb to over 17,000 TWh by 2030, an increase of almost 90% from 2023. This is more than the combined total power demand of China and the United States projected for 2030. Over the next six years, several renewable energy milestones are expected:

  • In 2024, solar and wind generation together surpassed hydropower generation.
  • In 2025, renewables-based electricity generation overtakes coal-fired.
  • In 2026, wind and solar power both surpass nuclear.
  • In 2027, solar electricity generation surpasses wind.
  • In 2029, solar electricity generation surpasses hydropower and becomes the largest renewable power source.
  • In 2030, wind-based generation surpasses hydropower.
  • In 2030, renewable energy sources are used for 46% of global electricity generation.

How do Global Alpha portfolios participate in the clean energy boom?

Over the last fifteen years, Global Alpha has always had investments that benefit from the growth of renewable energy. We have written numerous weekly commentaries on the topic and our exposure, all of which are available on our website under the Insights tab. Below are a few of our current holdings.

Ormat Technologies Inc. (ORA US)  is a holding in our Global, International and Global Sustainable funds and has been profiled numerous times in our weeklies. Ormat is a global leader in geothermal power, recovered energy and solar energy, as well as energy storage solutions.

Nexans S.A. (NEX FR), a holding in our international small cap portfolio, is a leading global player in sustainable electrification, supplying high-voltage transmission cables.

Nextracker Inc. (NEX US) is a holding in our global sustainable small cap portfolio and is a global leader in intelligent, integrated solar tracker and software solutions used in utility-scale and distributed generation solar projects.

Mentioned earlier, the Global South and emerging markets are now the fastest growers in the renewable energy market. In our emerging market small cap portfolio, we own many companies benefiting from that growth.

One example is Cenergy Holdings S.A. (CENER GR). Cenergy is a global leader in energy transmission infrastructure, and a competitor of Nexans, highlighting the synergies between our research analysts and opportunities created by our thematic overlay.

Arabian old traditional passenger boat in Kuwait, Saudi Arabia.

MENA equity markets ended the first quarter of 2025 with returns of 2.7% (for the S&P Pan Arab Index Net Total Return) broadly in line with the MSCI Emerging Markets Index which was up 2.9% in the same period.

While index-level returns were healthy in the first quarter, they were flattered by rather aggressive buying in large cap Saudi stocks (the largest member country in the index) in the four days leading up to the Eid holidays (close of March 27). In fact, 1.9% of the 2.7% gains for S&P Pan Arab Index in the quarter occurred in those four days of trading. Underlying trends in the Saudi market were far less encouraging, with 169 of 246 stocks in the Tadawul All Share Index posting a negative quarterly return amidst significant underperformance from midcap stocks (MSCI Saudi Midcap Index -4.0% in the quarter).

Uncharacteristically, it was the smaller Kuwait market that stood out in the quarter, with the MSCI Kuwait Index up 11.4%. After nearly a year’s wait, the country’s reform program is beginning to take shape, with the cabinet approving the long-awaited debt law that is counted on to unlock a significant proportion of the financing required for a much-needed infrastructure spending program. The approval of the debt law also paves the way for the new mortgage law, which is expected imminently. The mortgage law creates a new market estimated at $65 billion (source: Bloomberg) which allows banks – for the first time – to offer mortgages. Kuwaiti banks are obvious beneficiaries as they are sitting on significant excess capital which can be deployed in attractive risk-adjusted assets in corporate lending (infrastructure spending), government bonds (via the debt law) and mortgages.

Another (even smaller) market that performed positively in the quarter is Morocco. The MASI Free Float Index was up a remarkable 25.6% in the quarter, although its impact on the regional index is limited due to its small size. The market was supported by a one-off 5% tax amnesty that brought almost $10 billion worth of assets and cash (from Morocco’s large grey economy) into the banking system and the equity market. Interestingly, this also resulted in a doubling of retail investor participation from the historical average of 12-15% to over 30% year-to-date ending March. The market was further bolstered by a policy rate cut of 25 bps which catalysed further flows into equities. Moroccan institutions have limited options to deploy capital outside of their local capital markets and as a result exhibit high-interest rate sensitivity that manifests itself in visible and sometimes aggressive shifts between equities and bonds.

Looking forward, the investment outlook has been muddied by the ongoing escalation and volatility in US trade policy. While the direct impact of tariffs on the region is limited, the indirect impact is significant and captured primarily by the weak oil price. Cracks in the OPEC+ alliance are also beginning to appear, which, together with slower global trade, cast a long shadow on the oil price outlook. While there are varying degrees of sensitivity to the oil price in the region, a sustained low oil price (in the low $60s on Brent) is invariably negative. Fortunately, the region’s countercyclical buffers are plentiful and can absorb the fiscal and current account pressures of a lower-for-longer oil price environment.

The region’s geopolitical position also appears robust and highly relevant, which puts it in a good position (relative to other regions) to weather the fallout from the rising tensions in Sino-American relations. The end of the multi-year USD bull run is another factor to consider; increasing openness to foreign portfolio investors and the USD peg increased the share of the region’s ex-US capital inflows in the last decade or so. Insofar as USD bearishness is coupled with a weaker oil price (as is the case now), the region’s share of global inflows is likely to decline in % terms. This, of course, would be the opposite for the smaller oil-importing markets in MENA like Egypt and Morocco, where a weak USD and a lower oil price sets up an accommodative environment for fiscal and monetary conditions, and ultimately asset prices.

While we have a view on macroeconomics, that is certainly not our investment edge and therefore not a tool we count on for making major investment decisions. As we’ve articulated in previous letters, our edge comes from having a deep understanding of the companies we invest in. This understanding is critical in our ability to determine the impact that macroeconomic changes have on the earning power of our companies.

Crucially, this knowledge is leveraged in our valuation framework and gives us a good (and historically reliable) barometer of when our companies are under or over-valued by the market. As stated in previous letters, valuations are the ultimate determinant of our capital allocation reflexivity and is a key tool we rely on in making investment decisions. This has served us well year to date as it reduced the portfolio’s exposure to areas where the market was not prepared for any bad news, and subsequently increased exposure to areas where good news was not needed for outperformance.

As a result, we find ourselves in a strong position where the portfolio generates a dividend yield that is nearly the same level as the index (~4%) and trades at comparable multiples on a P/CF basis (~7x), but with vastly superior fundamentals (captured in an ROE of 18%, which is 500 bps over the index average). The portfolio is sitting on a healthy level of cash which puts us in a good position to make surgical and incremental bets when we deem that the market has overreacted (negatively) on stocks where earning power remains relatively intact. The environment remains fluid and volatile, but our barometer is beginning to signal pockets of under-valuation that we aim to take advantage of in the coming period.

We look forward to continuing to update you on the strategy in the next letter.