The Fed’s July senior loan officer survey signals a major slowdown in US bank lending in H2 and 2023.

Most commentary focuses on survey responses about credit standards and demand for commercial and industrial (C&I) loans. However, the Fed calculates aggregate indicators incorporating data for all loan categories (i.e. also including commercial real estate (CRE), consumer and residential mortgages).

These indicators weakened sharply in Q2*, moving below their averages since 1995 – see chart 1.

Chart 1

Chart 1 showing US Commercial Bank Loans & Leases (%6 m) & Fed Senior Loan Officer Survey Credit Demand & Supply Indicators* *Weighted Average of Balances across Loan Categories

Demand for residential mortgages weakened most, with smaller declines for CRE and consumer loans. C&I loan demand remained strong, driven by inventory financing (negative for economic prospects).

Credit tightening was across the board but most pronounced for CRE and C&I loans. Banks cited a less favourable economic outlook, industry-specific problems and reduced risk tolerance as key drivers of the tightening of C&I loan standards.

Is the degree of credit restriction consistent with a recession? The Fed’s aggregate credit tightening indicator combines data for the various loan categories using their weights in banks’ lending books. The indicator is unavailable before 1995 but similar results are obtained using a simple rather than weighted average, and this alternative indicator can be estimated for earlier years from partial data for the loan categories.

Chart 2 shows that this alternative indicator rose above 28% before or during seven of the last eight recessions, with no false positive signals. The single false negative was the double-dip recession of 1981-82, which was arguably an extension of the 1980 contraction rather than a separate cyclical event.

Chart 2

Chart 2 showing US Fed Senior Loan Officer Survey Credit Standards Tightening Indicator* *Average of Balances across Loan Categories

The indicator rose from -4% in the April survey to 17% in July, i.e. below the critical value. The current level was reached in 1968, 1978 and 1998 without an accompanying recession.

The July survey, however, included special questions about banks’ expectations for credit tightening for selected loan categories in H2. A net 52% expect to tighten standards on C&I loans, up from an actual 23% in Q2. Smaller but significant increases are signalled for consumer loans and residential mortgages. Assuming no change for CRE loans (which were not covered by the special questions), the aggregate alternative indicator in chart 2 is forecast to rise to 33%, i.e. above the 28% recession threshold.

*The survey cut-off date was 30 June.

Central bankers have ignored the lessons of their 2020-21 policy blunder and deserve the opprobrium they are likely to attract as an economic debacle continues to play out over coming quarters.

Policy-making can be accurately described as anti-monetarist, not merely in the sense that money data are ignored but rather that decisions are the precise opposite of those warranted by monetary trends.

The central banks continued to pursue ludicrously outsized QE in 2020-21 even as money growth surged to a level that would have embarrassed their 1970s predecessors; and they ripped up earlier guidance and tightened aggressively this year despite monetary trends screaming recession and now deflation risk.

June money data for the US, Eurozone and UK published this week highlight the scale of the policy fiasco under way before this month’s further tightening moves. (The Bank of Japan deserves an honourable mention for refusing to join the lemming rush.)

With Canada yet to release June data, the six-month rate of change of G7 real narrow money is estimated to have fallen further to -3.1% (-6.1% annualised), a level previously reached only before / during severe recessions in the mid 1970s and early 1980s. Real broad money, meanwhile, is contracting faster than during those episodes – see chart 1.

Chart 1

Chart 1 showing G7 Industrial Output & Real Money (% 6m)

Until April, real money weakness was attributable mainly to high inflation – six-month growth of nominal narrow money, though slowing sharply, was still in the middle of its pre-pandemic range. No longer: six-month nominal growth fell to 1.6% (3.3% annualised) in June – chart 2.

Chart 2

Chart 2 showing G7 Narrow Money & Consumer Prices (% 6m)

The impact of this year’s policy tightening is better reflected in the three-month rate of change, which crossed below zero in June, a rare occurrence signalling recession and / or price declines historically – chart 3.

Chart 3

Chart 3 showing G7 Narrow Money (% 3m annualised)

The narrow money measures calculated here for the US and UK fell month-on-month in June, while the Eurozone measure was flat.

Narrow money is more sensitive to policy changes than broad money but the broad numbers are no less alarming. Three-month growth of G7 broad money slumped to 1.3% annualised in April, moving sideways in May and June – chart 4.

Chart 4

Chart 4 showing G7 Broad Money

The monetary evidence, therefore, is that policy settings had already reached overkill territory by mid-year, suggesting a severe recession with rising medium-term deflation risk.

One false counter-argument to this assessment cites the strength of bank loan growth, particularly in the US. Non-monetarists offer this as evidence that financial conditions are not yet restrictive. Even some monetarists have suggested that lending strength is relevant for assessing rate settings, since money growth will recover if lending momentum is sustained.

It won’t be. Bank lending is a coincident / lagging indicator of the economy. It is normal for loan growth to be strong and / or rising before a recession – chart 5.

Chart 5

Chart 5 showing US Commercial Bank Loans & Leases (% yoy)

Corporate loan demand has been inflated by an unusually large surge in stockbuilding that is now starting to reverse – chart 6. The ECB’s latest bank lending survey signalled a sharp fall in credit demand, along with tightening supply – expect the corresponding Fed survey next week to give the same warning.

Chart 6

Chart 6 showing US Stockbuilding as % of GDP (yoy change) & Commercial Bank Commercial & Industrial Loans (yoy change in % 3m)
Farmer hand holding young plant.

In this week’s commentary, we take a different approach. Written by Sain Godil, Portfolio Manager, he shares how the alchemy of art and science that goes into gardening is similar to Global Alpha’s investment philosophy.

Recession, war, supply disruption, inflation, and Bitcoin crash – it seems that this is much of what you hear in the news these days. Our recent weeklies have focused on how our portfolio is extremely well positioned to benefit in periods of turmoil. We have also talked about how and why small caps tend to outperform in a global recession. So, we don’t need to cover these themes again.

Today’s weekly topic is a bit different. It came to mind while I was tending my garden. Like most people, once the first signs of spring arrive, I begin thinking about what vegetables and flowers to grow.

Gardening has become a hobby of mine because it gets me outside and pulls me away from my digital devices. It allows me to show my kids where food comes from and what goes into growing your own plants. Plus, what’s better than watching seeds transform into a tasty salad you share with your friends and family over a glass of wine?

While I was pruning my tomato plants, it occurred to me there are many similarities between gardening and the Global Alpha investment philosophy. Just like investing, gardening is an alchemy of art and science. You need a proven process, vigilance, and patience to yield fruit. Here’s how I see the parallels.

Step 1 – Preparing the ground

Gardening – It all begins with a vision of where you want to position your garden bed. The type of soil and fertilizer you choose will have a direct impact on the yield you get when the plants bloom later in the summer. Make the wrong choice, and all the time and money you spent goes to waste.

Investing – Similar to gardening, smart investing begins with careful positioning. This can be done via different asset classes, market cap ranges, fundamental or quant-based approaches, etc.

At Global Alpha, we are fundamental managers focused on global small cap. That’s our “fertile ground”. As stock pickers, this strategy gives us an opportunity to identify the best companies out of an available of 11,000 names. By carving out this particular garden patch of the investible universe, we lay the groundwork for fruitful returns for our clients.

Step 2 – Choosing the right plants

Gardening – After preparing the garden bed, you need to decide which plants to grow and where to place them. Each plant needs a specific amount of sun and water to optimize the yield. I learned this firsthand last summer, when I mistakenly placed my pepper plants in the shade and ended the season with only two tiny green peppers (one of which was eaten by a squirrel).

Investing – Just like a garden needs adequate sunlight and water, your portfolio needs companies that can grow revenues and profits much faster than the industry. We achieve this objective by understanding the addressable markets in which our companies operate – and identifying names that are well-positioned to flourish in that environment.

As our companies grow their revenues and earnings, investors can expect healthy out-performance over the long term. On the flip side, if the end market is shrinking, even the most promising company cannot grow. It simply won’t get the nourishment and support needed to thrive.

Step 3 – Care and attention

Gardening – An outdoor garden needs your constant attention. Besides regular watering, you must be on guard against the continuous onslaught of insects and animals that want to gobble up your harvest. Weeding and pruning are also key to optimizing the health and output of your plants. It’s all about staying vigilant.

Investing – At Global Alpha, we are constantly re-evaluating every holding in the portfolio. Our on-the-ground research helps us identify threats our companies may face. By meeting competitors, we get an understanding of the market dynamics and challenges our companies may face in the future. Based on the intel we gather, we prune the portfolio by managing the weights of individual companies. This is how we create a diversified portfolio that adds value in up markets and has superior down market protection. In other words, we know how to weather the storm.

Step 4 – Reaping your rewards

Gardening – All the hard work has paid off, and it’s time to reap your rewards. Nothing compares to the taste of vegetables you grew yourself. And, it’s also the perfect time to reflect on how you’ll optimize your growing process for next year to get an even better harvest.

Investing – Our team spends a lot of time reflecting on what we got right and what could have been improved in the portfolio management process. We are constantly evaluating which other companies and industries we could invest in. It’s all about continuous improvement to deliver the best possible results.

Conclusion

As I write this, the garden I planted in the spring has begun to flourish with kale, spinach, peppers, tomatoes, cucumbers, and herbs. Each year it gets better as I refine my growing process and figure out which pitfalls to avoid (like those sneaky squirrels).

It brings to mind the Global Alpha journey, which began with three founders and has expanded to 14 team members over the past 14 years. Since inception, our continuous refinement of our portfolio management process has helped us consistently outperform the benchmark.

Despite the inevitable changes in the weather, our team continues to learn, adapt, and identify flourishing businesses around the world. Here’s to another 14 years of growth!

Connor, Clark & Lunn Infrastructure (“CC&L Infrastructure”) and Régime de rentes du Mouvement Desjardins, represented by Desjardins Global Asset Management (collectively, “Desjardins”) are pleased to announce the acquisition of a majority interest in the Rt. Hon. Herb Gray Parkway (“the Project” or “the Parkway”), from ACS Infrastructure Canada (“ACS”), Fluor Canada Ltd. (“Fluor”), and Acciona Concesiones S.L (“Acciona”). Each of ACS, Fluor, and Acciona will retain a minority equity interest, and an O&M company formed by ACS and Fluor will provide operations and maintenance service to the Project going forward.

The Rt. Hon. Herb Gray Parkway project is a public-private partnership (P3) between Windsor-Essex Mobility Group and the Province of Ontario.  The Project encompasses an approximately 11km corridor through the Windsor, Ontario area, including a six-lane highway with several adjacent service roads, interchanges, structures, pumping stations, and recreational areas. Distinct from many other P3 highway projects, the Parkway includes approximately 300 acres of green space, as well as active maintenance, monitoring, and reporting on various environmental features and amenities, including vegetation, ~20km of paved trails for pedestrians and cyclists, and a multi-use lit pathway.

 “Our investment in the Rt. Hon. Herb Gray Parkway aligns with our strategy of acquiring interests in high-quality, long-lived, resilient infrastructure assets with strong, creditworthy counterparties and operating partners,” said Matt O’Brien, President of CC&L Infrastructure. “We thank our co-investment partner, Desjardins and our new operating and equity partners, ACS, Fluor, and Acciona.  We look forward to working with these partners and the Province of Ontario toward the successful, long-term operation and maintenance of this important asset.”

“Desjardins is pleased to acquire an interest in the Rt. Hon. Herb Gray Parkway project through the Régime de rentes du Mouvement Desjardins. The plan participants expect consistency and stability within the infrastructure portfolio, and we look forward to continuing to meet those expectations with investments in high quality, long-duration assets such as the Parkway.  We are also pleased to continue expanding our long-term relationship with CC&L Infrastructure, and to be partnered with experienced investors and operators at ACS, Fluor, and Acciona.” added Frédéric Angers, Vice President and Head of Infrastructure Investments at Desjardins Global Asset Management.

Procured in 2010 by Infrastructure Ontario, the Rt. Hon. Herb Gray Parkway began operation in 2015 and has since been an essential part of a high-traffic trade artery between Canada and the United States. The Project has a 30 year availability-based concession agreement in place with Infrastructure Ontario, with approximately 23 years remaining.

About Connor, Clark & Lunn Infrastructure

CC&L Infrastructure invests in middle-market infrastructure assets with attractive risk-return characteristics, long lives and the potential to generate stable cash flows. To date, CC&L Infrastructure has accumulated over $5 billion in assets under management diversified across a variety of geographies, sectors, and asset types, with over 90 underlying facilities across over 25 individual investments. CC&L Infrastructure is a part of Connor, Clark & Lunn Financial Group Ltd., a multi-boutique asset management firm whose affiliates collectively manage approximately CAD$96 billion in assets. For more information, please visit www.cclinfrastructure.com.

About Desjardins Global Asset Management Inc. (DGAM)

Established in 1998, Desjardins Global Asset Management (DGAM) is one of Canada’s largest asset managers with in-house expertise in equity, fixed income and real assets (infrastructure, real estate) across a variety of investment vehicles. DGAM manages over CAN$86.5 billion (as at March 31, 2022) in institutional assets on behalf of insurance companies, pension funds, endowment funds, non-profit organizations and corporations across Canada. For more information, please visit https://www.desjardins.com/ca/about-us/desjardins/governance-democracy/structure/desjardins-asset-management/index.jsp.

Contact

Vrushabh Kamat
Connor, Clark & Lunn Infrastructure
(416) 862-8079
[email protected]

The assessment of global economic prospects here has been consistently more pessimistic than that of the consensus in recent quarters. The consensus is now shifting to acceptance of US / European recessions but these are widely expected to be “mild” and / or “short-lived”. The view here remains bleaker, based on three considerations.

First, global six-month real narrow money momentum continued to weaken during H1 2022, reaching a level historically associated with serious recessions. The further decline into mid-year suggests no economic recovery before Q2 2023, allowing for an average nine-month lead.

Secondly, the 3.33 year stockbuilding cycle is judged to have peaked in Q1 2022, with a downswing likely to last at least 12 months, again suggesting no recovery before Q2 2023. The prior upswing, moreover, was exaggerated by overordering of inputs due to perceived supply shortages, raising the possibility of a larger-than-usual drag during the downswing.

Thirdly, recessions involve self-reinforcing dynamics that magnify and prolong weakness unless offset by policy intervention. Recent evidence suggesting that a tipping point into a serious recession has been reached include:

Weak business surveys. US / Eurozone PMI composite output indices fell below 50 in July, while an average of current and future new orders balances in the Philadelphia Fed manufacturing survey plunged to a level reached only before / during major recessions – see chart 1.

Chart 1

Chart 1 showing US ISM Manufacturing New Orders & Regional Fed Manufacturing New Orders (Average of Current & Future, Z-scores)

Earnings downgrades. The MSCI ACWI earnings revisions ratio had been holding up relative to business surveys but has recently fallen sharply – chart 2.

Chart 2

Chart 2 showing Global Manufacturing PMI New Orders & MSCI ACWI Earnings Revisions Ratio* *Upgrades minus Downgrades as Proportion of Total Number of Estimates

Weak commodity prices. A year-on-year fall in the CRB raw industrials index confirms that a stockbuilding cycle downswing is under way, during which prices are likely to soften further– chart 3.

Chart 3

Chart 3 showing G7 Stockbuilding as % of GDP (yoy change) & Industrial Commodity Prices (% yoy)

Restrictive credit conditions. Credit tightening and demand balances in the July ECB bank lending survey reached recession-consistent levels – chart 4.

Chart 4

Chart 4 showing Eurozone Bank Loans to Private Sector (% 6m) & ECB Bank Lending Survey Credit Demand & Supply Indicators* *Average of Balances across Loan Categories

Softer labour market data. The 13-week change in a four-week moving average of US initial claims has reached a level historically associated with recessions, while the monthly increase in UK payrolls in June was the smallest since March 2021, with recent downward revisions to initial data suggesting an actual fall – chart 5.

Chart 5

Chart 5 showing UK Payrolled Employees (mom change, 000s)

Chinese monetary data for June confirm that policy easing is gaining traction but narrow money growth remains modest compared with previous reflationary episodes and a H2 economic recovery is likely to be dampened by weaker exports.

GDP fell by 2.6% between Q1 and Q2 but monthly activity data indicate a significant recovery from an April trough, with June exports and retail sales particularly strong – see chart 1.

Chart 1

Chart 1 showing China Activity Indicators January 2019 = 100, Own Seasonal Adjustment

Six-month growth rates of narrow and broad money, meanwhile, rose further in June, to 17- and 22-month highs respectively – chart 2.

Chart 2

Chart 2 showing China Nominal GDP & Narrow / Broad Money (% 6m)

Six-month growth of real narrow money has moved sideways, with faster nominal expansion matched by a rise in consumer price momentum. Nevertheless, positive and stable real money growth compares favourably with deepening contractions in the US, Europe and many emerging economies – chart 3.

Chart 3

Chart 3 showing Real Narrow Money (% 6m)

What is driving faster money growth? The credit counterparts analysis of broad money shows major contributions from banks’ net lending to government, reflecting expansionary fiscal policy, and from unspecified items within non-monetary net liabilities. Growth of bank lending to other sectors bottomed last year but has yet to establish a rising trend – chart 4.

Chart 4

Chart 4 showing China Broad Money* & Credit Counterparts Contributions to Broad Money % 6m *M2 ex Financial Institution Deposits

Six-month growth of broad money is close to levels reached in previous successful reflationary episodes since the GFC but narrow money growth remains well below the corresponding highs – chart 2. The judgement here is to place more weight on the less upbeat message from narrow money. The demand for broad money may have been boosted by risk aversion due to housing and equity market weakness, as well as the pandemic. Domestic credit expansion, like narrow money growth, is below previous reflationary highs – chart 4.

Industrial plant at night

The Emergency Plan for Gas for the Federal Republic of Germany was published in September 2019. The third paragraph of the background section states “Germany’s natural gas supply is very secure and reliable”. It goes on to say, “a serious deterioration in supply cannot be ruled out completely… though the likelihood of such a severe crisis in supply actually occurring is very small.” On June 23, Germany announced they were moving to stage two of the three-stage national gas emergency plan due to reduced Russian gas supplies coming from the Nord Stream 1 pipeline. Currently at 58% gas storage levels, the German government is aiming to reach 90% by December.

Stage two does not involve gas rationing. The focus instead is on increased coordination with network providers and mechanisms such as an auction system to incentivize industrial users to slash consumption and sell back unused gas. These measures could come too late for some players as Uniper (UN01.GY) submitted a bailout application for government support due to financial distress (Uniper is not one of our holdings).

Stage two also allows the government to trigger an article of the new energy security law that would allow utility companies “in case of a substantial reduction in gas import volumes” to increase gas prices for companies and households to an “appropriate level” with a notice period of one week. An upward adjustment of retail gas prices could potentially have a double-digit percentage impact on inflation and negatively affect GDP growth due to weaker consumption. This would be an unacceptable situation for the German government. Should energy prices remain elevated, some kind of fiscal response would be needed, either to dampen the impact on retail gas prices or in the form of cut taxes.

By moving to stage two, the risk of advancing to the emergency level (stage three) is also clearly on the table. At stage three, gas rationing would be allowed for unprotected customers, including industrial users. Should gas supplies be interrupted, it is highly likely that Germany would fall into recession. This would be a huge blow to the manufacturing industry, which serves as the engine that drives the German economy. In June, the German Central Bank lowered its forecast for GDP growth in 2022 to 1.9% from 4.2%.

Natural gas provides about 25% of the energy needed for German industry, with over half of coming from Russian imports. Tough decisions would need to be made on which industries would be allocated gas supplies in order to keep producing, and which would be considered dispensable. For example, it would be impractical to turn off large gas-powered furnaces or smelters. Once they cool down, bringing them back up to the required operational temperature would consume even more energy. Switching to another source of power or relocating is also impossible, due to size as well as the environmental and economic cost. If the worst case scenario plays out and some industries do have to shut down in the winter, there would be significant job loss; one study estimates that Germany’s GDP could fall by 12.7%.

There are calls for home owners to have their gas boilers and radiators checked and adjusted to maximize their efficiency, and if possible, to save energy in order to reach the needed storage levels for winter. Vonovia (VNA.GY), one of Europe’s leading private residential housing providers with an estimated 1 million tenants in Germany, has instructed technicians to place a limit on its tenants’ overnight heating systems to 17° Celsius (63° Fahrenheit). (Note, Vonovia is not a Global Alpha holding.)

We will soon know how the gas supply situation will play out for the rest of the year. Regularly scheduled maintenance on the Nord Stream 1 pipeline that runs under the Baltic Sea from Russia to Germany started on July 11. In the past, the shutdown has lasted for approximately 10 days. If the gas flow from Russia does not start up when the maintenance is complete, the discussion around rations will ramp up and limits on hot water for private households should not be ruled out.

Aurubis (NDA.GY)

Our most exposed German holding to gas supply disruption is Aurubis. Aurubis is a leading global producer of non-ferrous metals and one of the largest copper recyclers worldwide. Annually, the company produces more than 1 million tons of copper cathodes as well as a number of other metals and additional products such as sulfuric acid. As an energy intensive business, increased energy prices have had an impact on costs, despite a large part of the company’s energy needs being hedged.

Aurubis can successfully pass on some of the higher energy costs to customers in the form of product surcharges. The biggest risk would be a lack of supply to two of its smelters that are reliant on Russian natural gas. Despite this, the share price weakness so far this year is more related to base metals and copper price in particular declining due to growing concerns over a global economic slowdown on the back of rapid interest rate hikes across the world. We continue to like Aurubis as a play on the secular recycling trend. The company has the multi-metal expertise and network to capitalize on the opportunity that is expected to present itself by way of a significant increase in the supply of complex recycling material.

Our other German holdings are less affected. Evotec (EVT.GY) is a biotech company that is a leading provider of outsourced services for early-phase drug research and development to the pharmaceutical industry. Patrizia (PAT.GY) is one of Europe’s largest real estate asset managers, with about €55billion of assets under management. Finally flatexDEGIRO (FTK.GY) is one of the leading and fastest growing online brokerage businesses in Europe.

While most of the focus has been on Germany, other European countries are affected deeply by the reduced gas supplies. The Global Alpha team is closely following the situation for any signs of escalation.

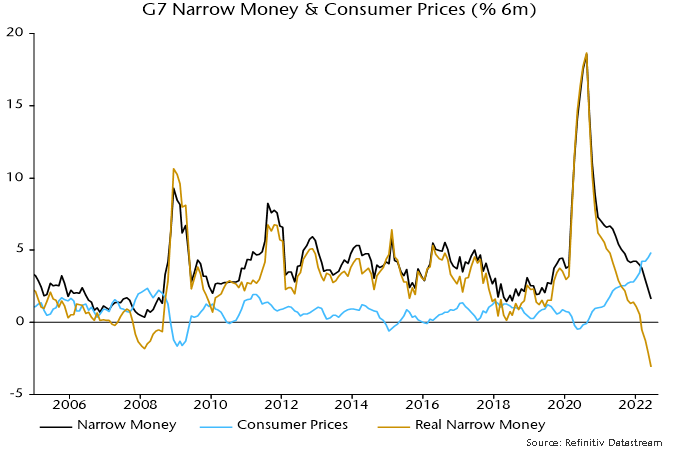
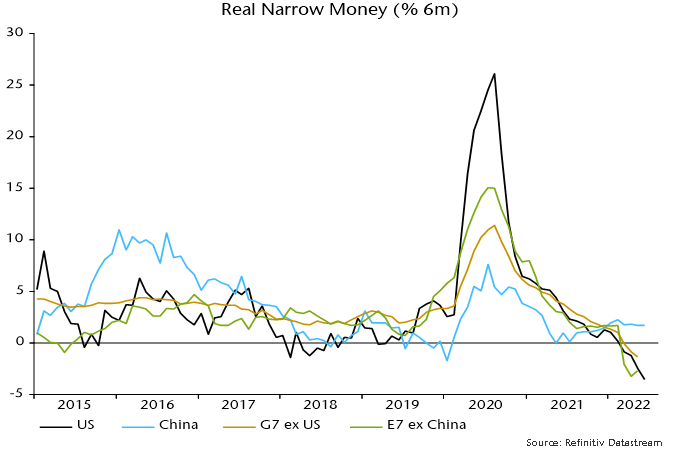
A fall in global six-month real narrow money momentum below zero in March signalled a shift in the economic outlook from slowdown to recession. A subsequent further decline in momentum to its weakest since 1980 suggests a deep recession extending into Q1 2023, at least. Economic contraction will release liquidity for markets, with “safe” bonds and quality stocks possible beneficiaries. Chinese real money momentum is diverging positively, supporting relative economic / equity market prospects.

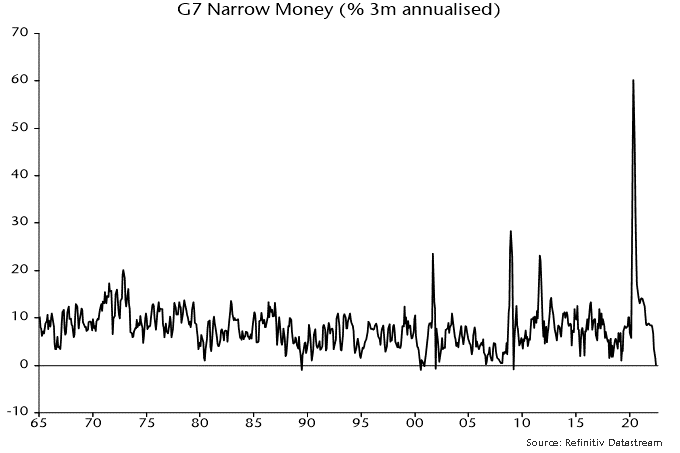
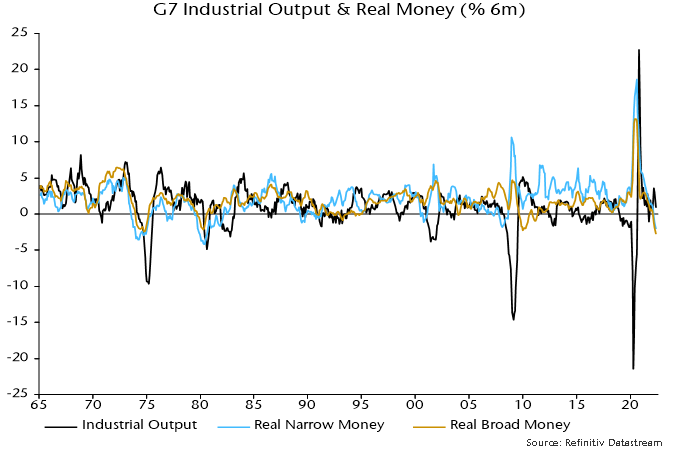
Global (i.e. G7 plus E7) six-month real narrow money momentum in May was below its GFC low and the weakest on record in data extending back to 1995. In longer-run G7-only data, the current rate of contraction was matched in 1973 and 1979 before severe recessions – see chart 1.

Chart 1

Chart 1 showing G7 Industrial Output & Real Money (% 6m)

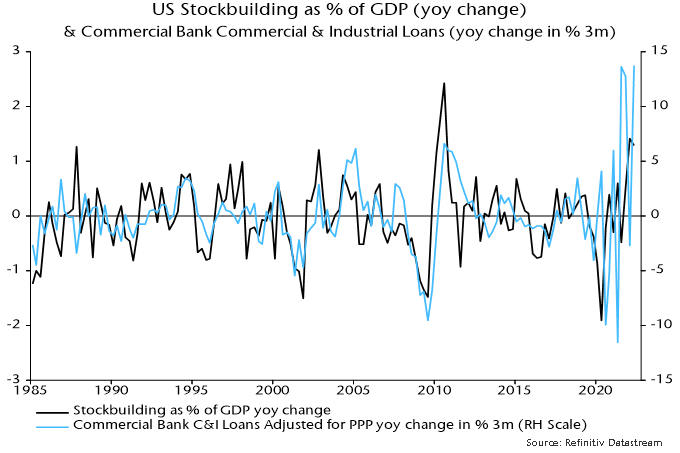
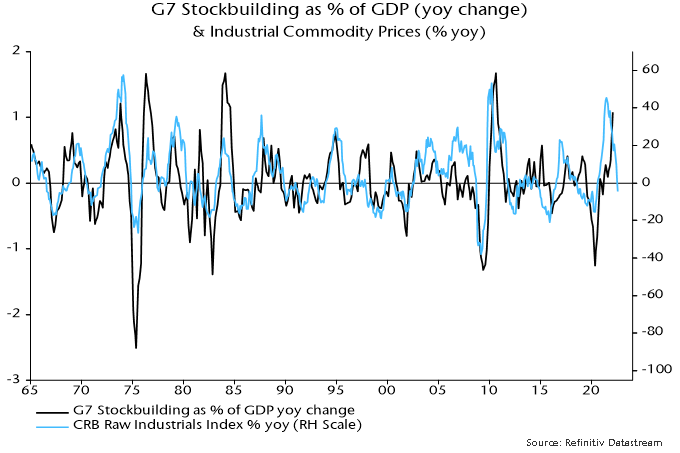
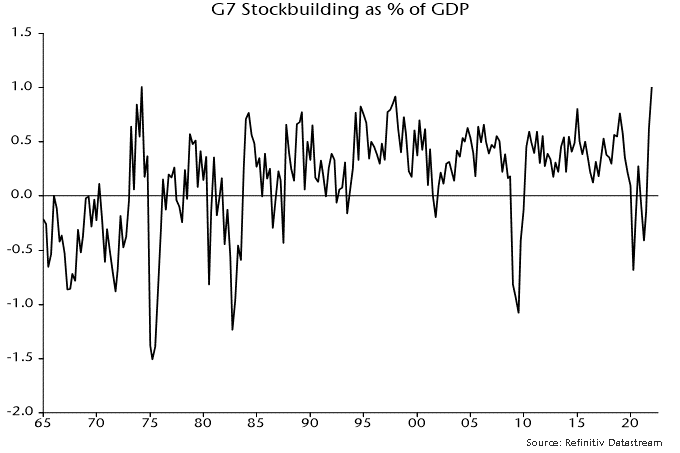
A further recessionary consideration is the recent pace of stockbuilding: the G7 stockbuilding share of GDP matched a 1974 high in Q1 – chart 2. The cycle upswing was supercharged by firms overordering inputs because of supply shortages. With final demand falling away, a liquidation of inventories will be amplified back through supply chains – the “bullwhip” effect.

Chart 2

Chart 2 showing G7 Stockbuilding as % of GDP

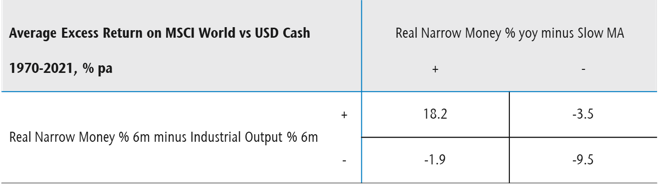
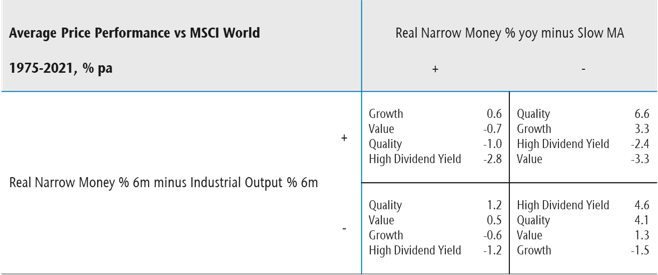
The assessment of market prospects here is informed by two measures of global “excess” money: the gap between six-month real narrow money and industrial output momentum; and the deviation of 12-month real money momentum from a slow moving average. Both measures were negative by end-January, a condition historically associated with weak equity markets – table 1.

Table 1

Table 1 showing Average Excess Return on MSCI World vs USD Cash 1970-2021, % pa

The expected recession and a likely sharp fall in six-month consumer price momentum suggest that the first measure – the real money / output momentum gap – will return to positive territory in H2, possibly in Q3. The second measure may remain negative: 12-month real money momentum is currently far below its moving average and will be slower to recover. The implication is a possible shift from the bottom right quadrant in the table to top right – still an unfavourable backdrop for equities but less grim than during H1.

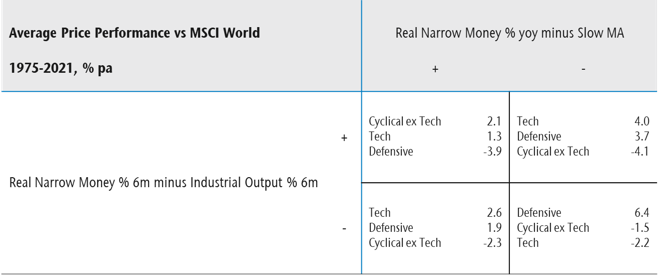
The excess money indicators are informative about sector and style performance. Recent outperformance of defensive sectors and underperformance of tech accords with the historical pattern under “double negative” readings – table 2. A switch to the upper right quadrant would suggest a tech recovery but further outperformance of defensive vs. non-tech cyclical sectors. Within the defensive basket, however, energy has historically performed poorly under this regime.

Table 2

Table 2 showing Average Price Performance vs MSCI World 1975-2021, % pa

Style-wise, recent outperformance of high dividend yield stocks accords with the historical pattern in the bottom right quadrant but quality has not on this occasion proved defensive, probably reflecting its inverse correlation with Treasury yields and the magnitude of the H1 rise in the latter – table 3. This suggests that quality will stage a come-back if yields reverse, with a potential shift to the upper right quadrant an additional positive – this was the best regime for quality and growth historically.

Table 3

Table 3 showing Average Price Performance vs MSCI World 1975-2021, % pa

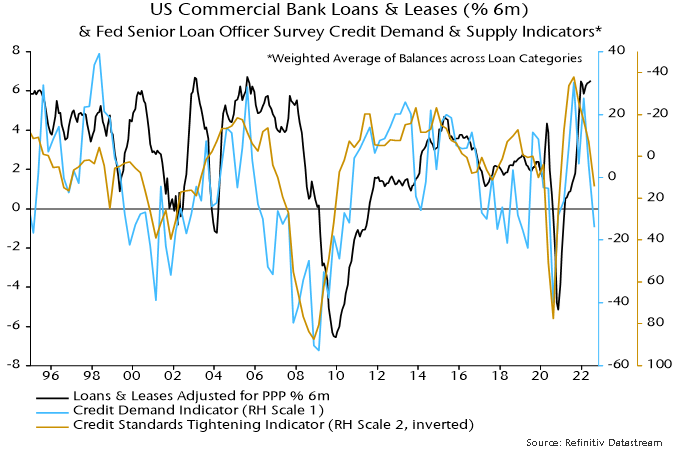
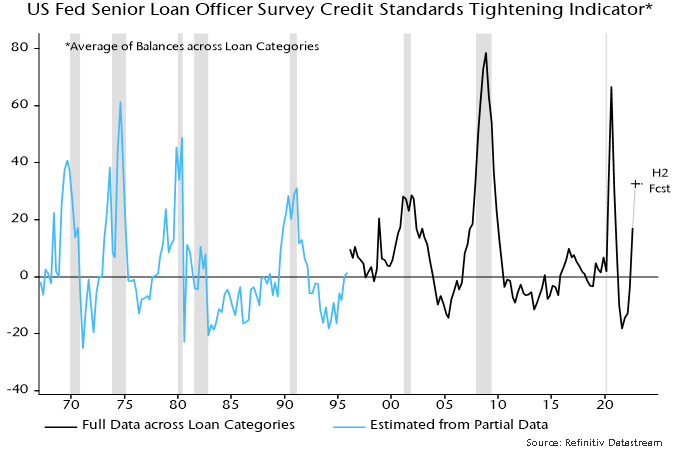
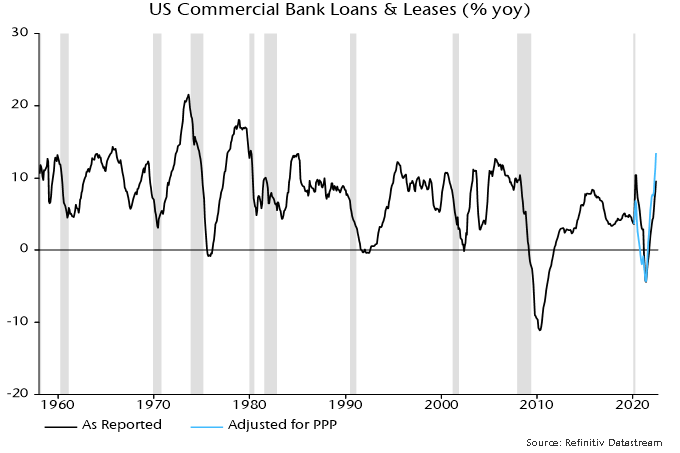
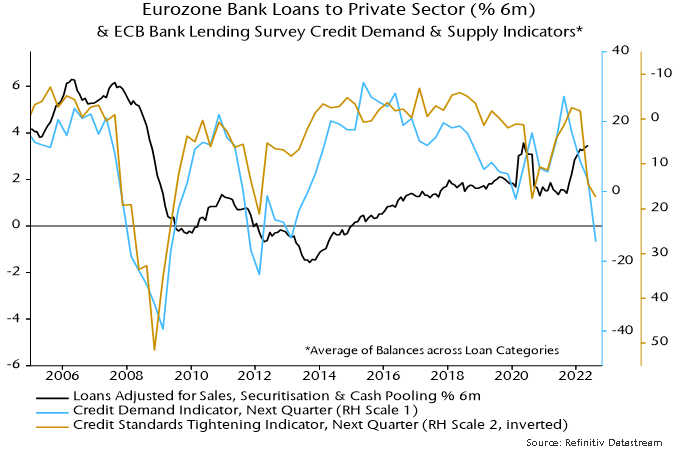
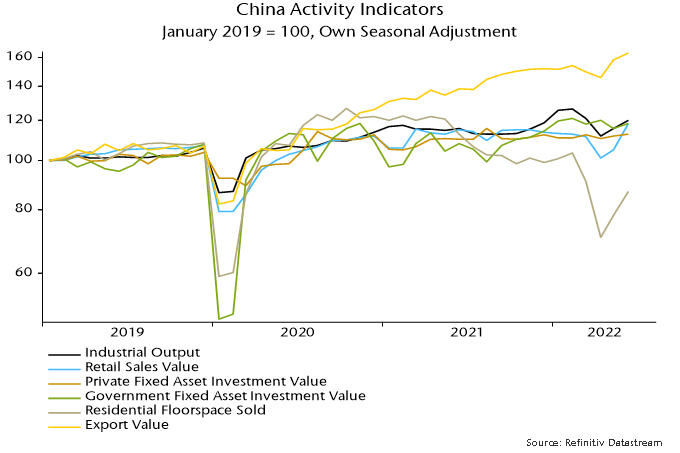
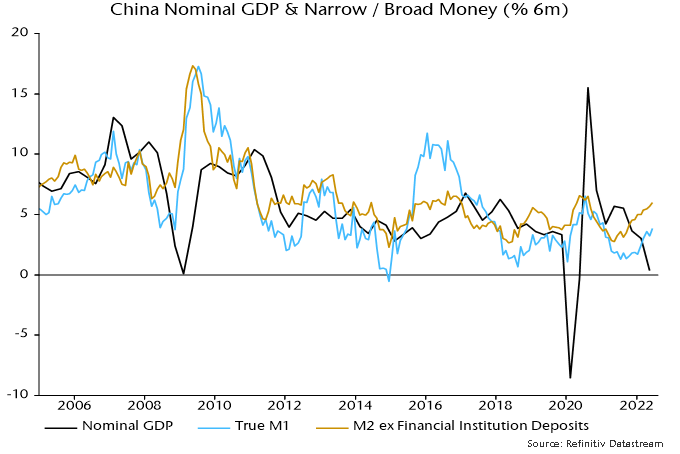
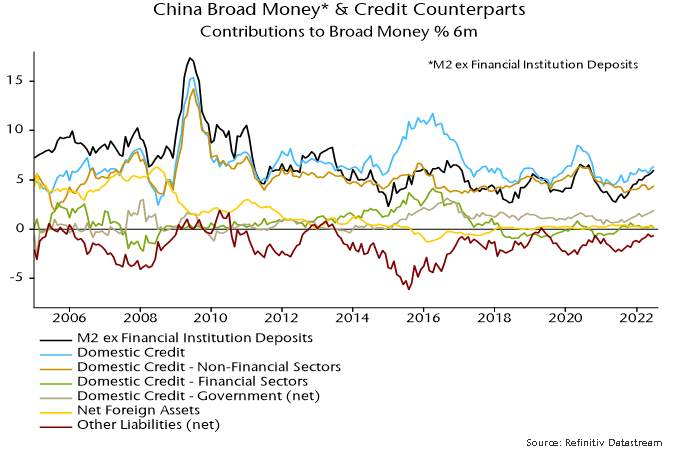
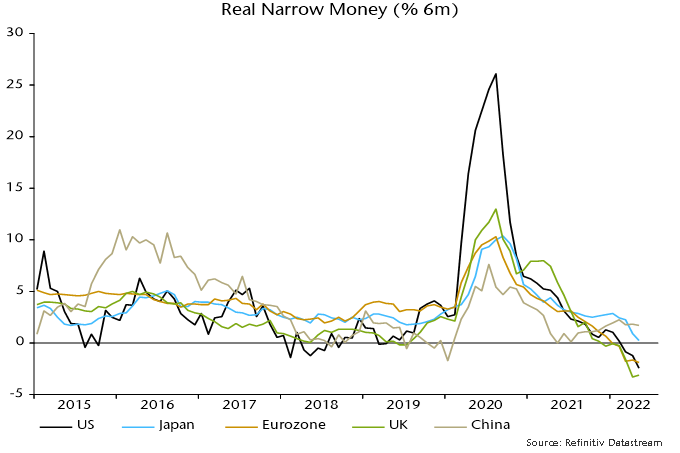
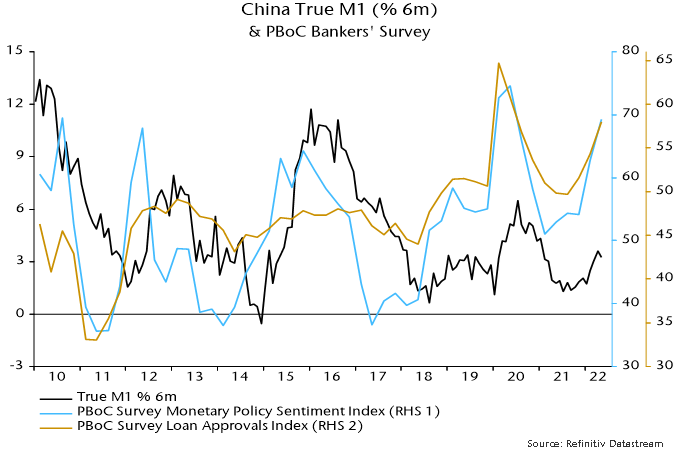
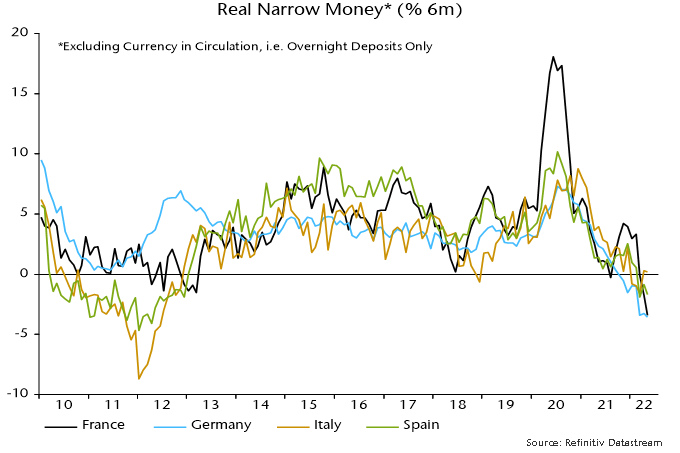
Six-month real narrow money momentum is similarly weak in the US and Europe but China and, to a lesser extent, Japan are diverging positively – chart 3. A further pick-up in China would support a forecast of economic recovery despite an export drag from recessions elsewhere. The latest PBoC bankers’ survey is consistent with monetary acceleration, indicating substantial policy easing and an increase in loan supply – chart 4.

Chart 3

Chart 3 showing Real Narrow Money (% 6m)

Chart 4

Chart 4 showing China True M1 (% 6m) & PBoC Bankers’ Survey

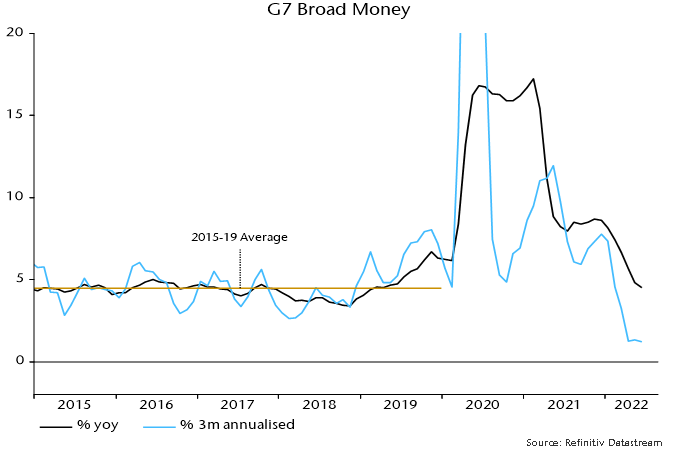
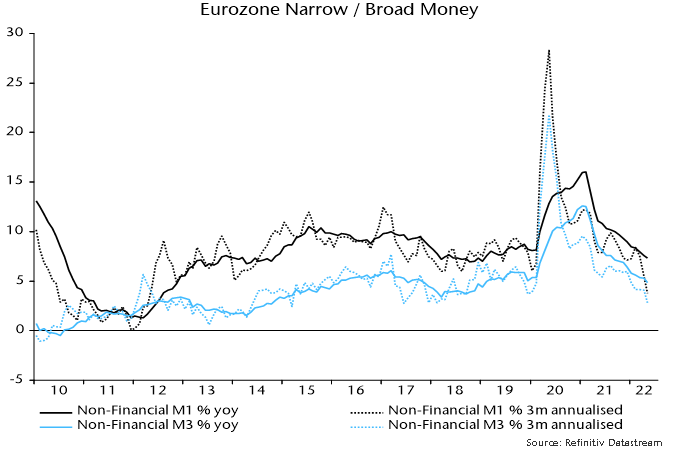
Global inflation prospects have improved dramatically. Having warned of the current overshoot, monetary trends are now consistent with inflation rates returning to target. G7 annual broad money growth was down to 4.9% in May from a peak 17.3% and is on course to move below its 2015-19 average of 4.5%: the money stock expanded at an annualised pace of only 1.3% in the latest three months.

The monetarist rule of thumb is that money growth leads inflation with a long and variable lag averaging two years. G7 annual broad money growth peaked in February 2021 so this average would suggest no inflation relief before early 2023. Some monetarist economists argue that the 2020-21 money growth surge has left a large monetary overhang, raising the possibility of a longer-than-average lag.

The view here is that the historical variability of the money growth / inflation lag partly reflects the position of the stockbuilding cycle, which is a key driver of commodity prices. The assessment that the cycle has peaked and will be in a strong downswing in H2 2022 suggests that recent commodity price weakness will be sustained, in which case their current large positive impact on annual CPI inflation rates will moderate through H2 and turn negative by early 2023.

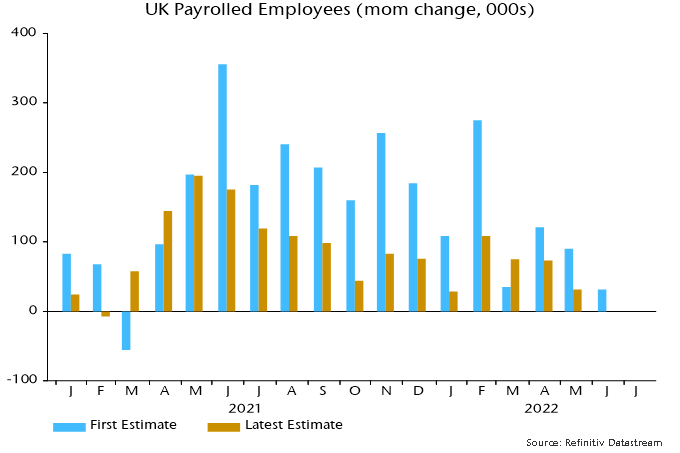
Core inflation is widely expected to remain high into 2023, reflecting labour market tightness. Recession and monetary weakness, however, suggest that firms will lack pricing power to pass on increases in labour costs, which may, instead, squeeze historically generous margins and trigger early job cuts. Labour markets could weaken surprisingly sharply, with signs of an imminent unemployment reversal appearing recently in a range of sensitive indicators.

Close-up trading monitor with stock market candle chart

Several major global indices fell into bear market territories in the past weeks. Investor behavior has shifted from ‘buy the dip’ during the pandemic to ‘sell the rally’, fearing of a potential recession. A wave of layoffs has swept across businesses, especially in the tech sector in the United States (U.S.) in the first half of 2022. The University of Michigan Consumer Sentiment Index fell sharply to a record low of 50.2 in June of 2022, well below market forecasts of 58, mostly attributable to the soaring inflation, which is at a 40-year high.

To combat the inflation, the Federal Reserve (Fed) has accelerated the pace of its interest rate hike, lifting interest rates by 75 basis points in June. This represents the third hike in 2022, and the largest since 1994. Historically, recessions start a median of 25 months after the Fed begins a tightening cycle, although there have been three cases (in 1963, 1994, and 2015) when a recession did not follow.

The best scenario for the markets would be a so-called soft landing, where the Fed could bring inflation under control without causing a recession. An ideal outcome would be similar to 1994, when the Fed hiked interest rates seven times in 13 months, almost doubling the rate from 3.05% to 6.05%, while avoiding a recession. However, the annual inflation was only 2.7% in 1994, while the latest inflation rate accelerated to 8.6% in May of this year. The unemployment rate was also higher in 1994, at 5.5%, versus 3.6% in May 2022, indicating a tighter labour market and higher labour cost today. These factors suggest it will be more challenging for the central bank to tame the inflation this time around. It is more likely than not that we are going to have a recession as early as next year, as predicted by leading economists.

How long does a recession last?

Based on data provided by the National Bureau of Economic Research, since 1945, the U.S. has experienced 13 recessions, including the short one in 2020. The average length of a growing economy is 5.3 years, and the average recession lasts for 10 months. A full economic cycle is around 6.3 years.

What about the stock market? In the same time period, the S&P 500 experienced 11 bear markets, six of which were accompanied by a recession, according to data compiled by Invesco. Bear markets on average have taken about one year to go from peak to trough, and 2.3 years to return to break-even. The S&P 500 index plunged an average of 33% during bear markets in that period, with the biggest decline occurring between 2007 and 2009, when the S&P 500 dropped 56%.

What does small cap do historically in bear markets or recessions?

History indicates that small caps tend to outperform larger caps after a bear market, and small caps have outperformed large coming out of nine of the last 10 recessions since World War II, according to the Jefferies Equity Research report published on April 8, 2020, JEF’s SMID-Cap Strategy – Thoughts & Observations.

Small cap vs. inflation

Small caps have historically outperformed and have shown better pricing power during most of the previous high inflation regimes, including the early 1960s, and the 1970s. Margins of small cap companies have declined less than large caps when inflation goes up, and in some cases, small cap margins go up with inflation, according to the BofA report by Jim Carey Hall, Small cap primer: the big guide to small stocks, published on May 31, 2022. Companies we invest in at Global Alpha are leaders in their niche markets, which gives them the pricing power to pass on higher costs to clients, hence maintain a healthy margin in an inflationary environment. 

Small cap vs. high interest rates

Two types of companies are most likely to suffer from higher interest rates. From the valuation perspective, expensive stocks are more likely to get hurt; from the operation point of view, heavily leveraged companies are likely to suffer. The valuation of small caps looks particularly attractive today, as small caps were expensive vs. large leading into almost every other Fed tightening cycle since the 1980s. Today, small caps trade at discount to large caps, as noted in the BofA’s report, Small cap primer: the big guide to small stocks. Companies we invest in at Global Alpha are high-quality companies trading at reasonable prices. Approximately one third of the companies in our portfolios have a net cash position.

Expansion and recession are a natural part of the economic cycle. It is important to be diversified, and stick to quality names that benefit from secular trends. It is during the down markets that more investment opportunities will emerge. The Global Alpha team has identified many great companies that are trading at attractive valuations, and we will introduce these names in future commentaries.

There are three messages from Eurozone monetary data for May released yesterday.

  1. The region faces a major recession that is likely to extend into early 2023, at least.
  2. Economic prospects are at least as bad for core countries as for the periphery.
  3. Nominal monetary trends are consistent with inflation returning to – or falling below – the 2% target in 2023-24, arguing for an immediate suspension of ECB tightening plans.

The “best” monetary leading indicator of Eurozone GDP, according to ECB research, is real non-financial M1, i.e. holdings of currency and overnight deposits by households and non-financial corporations deflated by consumer prices.

The six-month rate of change of real non-financial M1 turned negative in January and fell further to -1.9% (not annualised) in May, below the lows reached before / during the 2008-09 and 2011-12 recessions – see chart 1.

Chart 1

Chart 1 showing Eurozone GDP & Real Narrow Money* (% 6m) *Non-Financial M1 from 2003, M1 before

Based on longer-run data for real M1, the current rate of real narrow money contraction is the fastest since 1981.

All previous recessions ended only after the six-month rate of change turned positive. The ECB research, meanwhile, found that real narrow money led GDP by three to four quarters on average. The suggestion is that an incipient recession will extend into Q1 2023, at least.

Chart 2 shows six-month rate of changes of real non-financial M1 deposits in the big four economies. (A country breakdown of currency holdings is unavailable.) In a reversal of the pattern before the 2011-12 recession, weakness is more pronounced in Germany and now France than in Spain and Italy. German divergence partly reflects higher inflation but nominal growth of deposits is also weaker in France / Germany than Spain / Italy.

Chart 2

Chart 2 showing Real Narrow Money* (% 6m) *Excluding Currency in Circulation, i.e. Overnight Deposits Only

Eurozone nominal money trends, meanwhile, indicate rapidly improving medium-term inflation prospects. Annual growth of broad money, as measured by non-financial M3, slowed to 4.8% in May, with three-month momentum down to 2.8% annualised, the lowest since 2018 – chart 3.

Chart 3

Chart 3 showing Eurozone Narrow / Broad Money

The slowdown has occurred despite a rise in annual growth in bank loan to a post-GFC high of 5.3% in May. This pick-up does not contradict the negative monetary signal – lending is a coincident or lagging indicator of GDP (confirmed by the ECB research). The coincident / lagging relationship partly reflects a correlation of corporate credit growth with the stockbuilding cycle – demand for short-term loans is strongest as inventories swell at the peak of the cycle. Consistent with this explanation, loans to corporations with a maturity of up to a year grew by an annual 7.0% in May.

The counterparts analysis of M3 shows that the slowdown has been driven by the ending of QE but also a significant balance of payments outflow, reflected in a fall in banks’ net external assets. This outflow is the mirror-image of a basic balance deficit, which has widened as a current account surplus has been wiped out by high energy prices while the Ukraine crisis and other factors have triggered an exodus of capital from the region.