Cyclical equity market sectors have recouped part of their H1 underperformance of defensive sectors but monetary and cycle considerations suggest further weakness ahead. 

MSCI divides the 11 GICS sectors into cyclical and defensive baskets, the former comprising materials, industrials, consumer discretionary, financials, real estate, IT and communication services, and the latter consumer staples, health care, utilities and energy. 

The analysis here additionally separates the “tech” sectors of IT and communication services from other cyclical sectors on the grounds that they correlate differently with macro factors. Similarly, energy has distinct characteristics warranting separate consideration from other defensive sectors. 

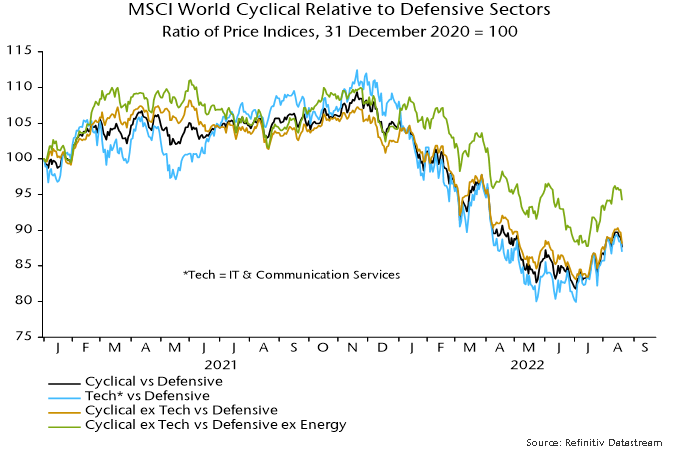
Chart 1 shows various measures of cyclical sector relative price performance, all of which staged significant recoveries from July into late last week. 

Chart 1

Chart 1 showing MSCI World Cyclical Relative to Defensive Sectors Ratio of Price Indices, 31 December 2020 = 100

Is there a valuation case for cyclical sectors following their H1 underperformance? Chart 2 shows that the forward P/E of non-tech cyclical sectors relative to the defensive sectors basket is above its long-term average, suggesting overvaluation. 

Chart 2

Chart 2 showing MSCI World Cyclical Relative to Defensive Sectors P / E Ratio of Forward P / Es, Z-scores

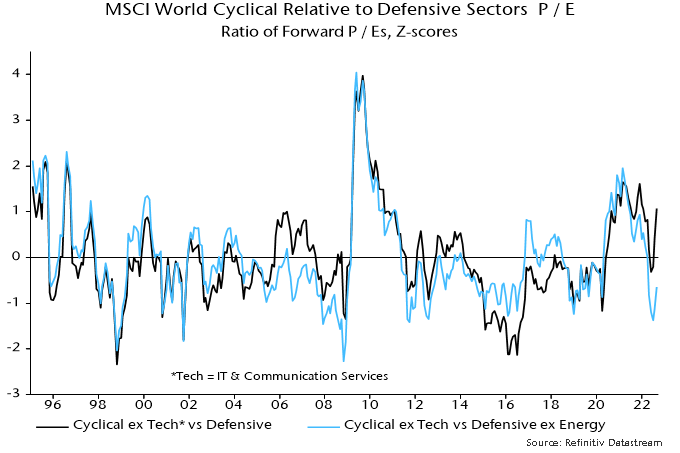
The overshoot, however, reflects current / expected high earnings in energy. Excluding energy from the defensive basket, the P/E relative was 1.4 standard deviations below average at the recent low, although the gap has since halved. 

The suggestion that non-tech cyclical sectors offer value, however, depends on current earnings forecasts proving reliable. With the global economy entering recession, downgrades are multiplying and are likely to be larger on average in cyclical sectors. The P/E relative, in other words, could normalise via earnings rather than a cyclical relative price recovery. 

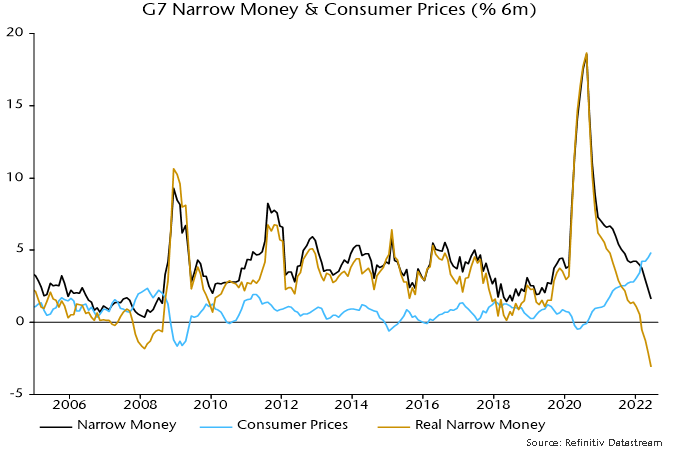
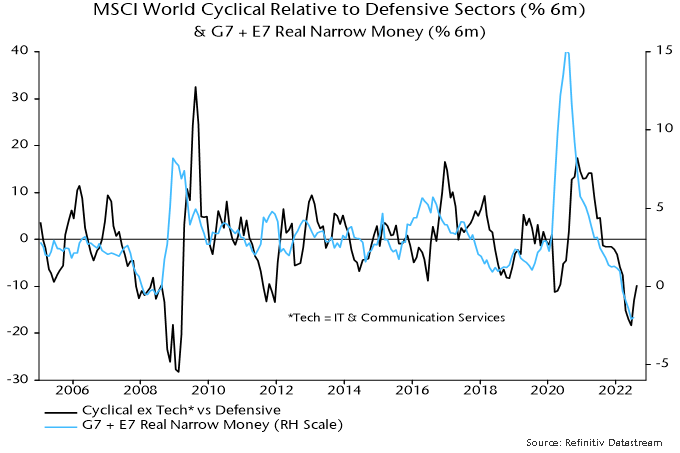
Global monetary trends continue to suggest cyclical weakness. Six-month real narrow money momentum usually moves ahead of major swings in relative price momentum but remains stuck at a multi-decade low – chart 3. 

Chart 3

Chart 3 showing MSCI World Cyclical Relative to Defensive Sectors (% 6m) & G7 + E7 Real Narrow Money (% 6m)

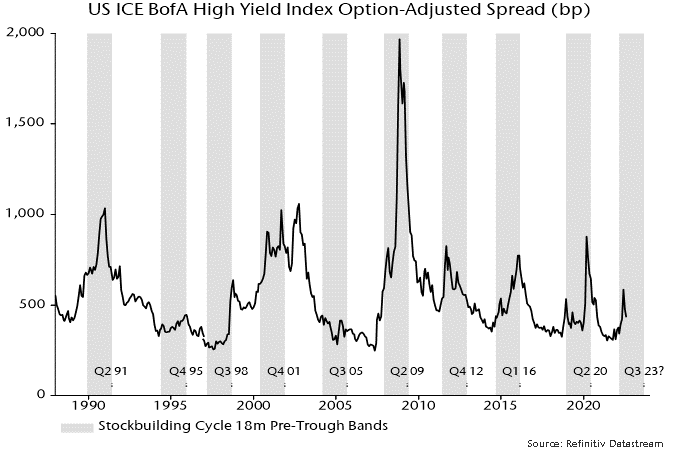
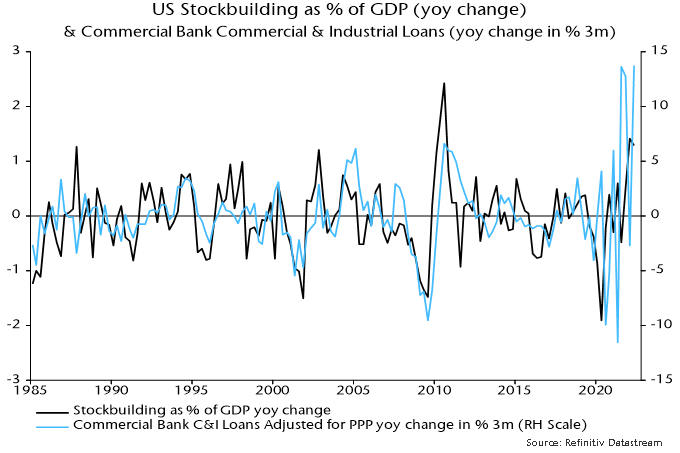
Cyclical relative performance also correlates with the stockbuilding cycle, which, according to the assessment here, is entering a downswing that is unlikely to bottom before mid-2023. Chart 4 shows a long-term history of the cycle, with shaded areas marking 18-month windows preceding prior lows. 

Chart 4

Chart 4 showing G7 Stockbuilding Cycle G7 Stockbuilding as % of GDP (yoy change)

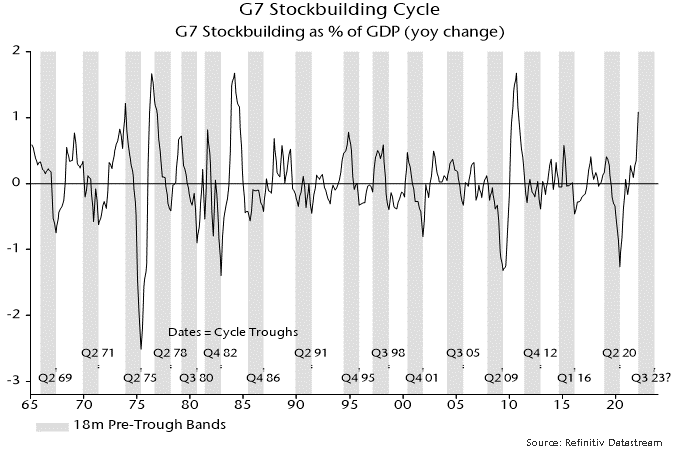
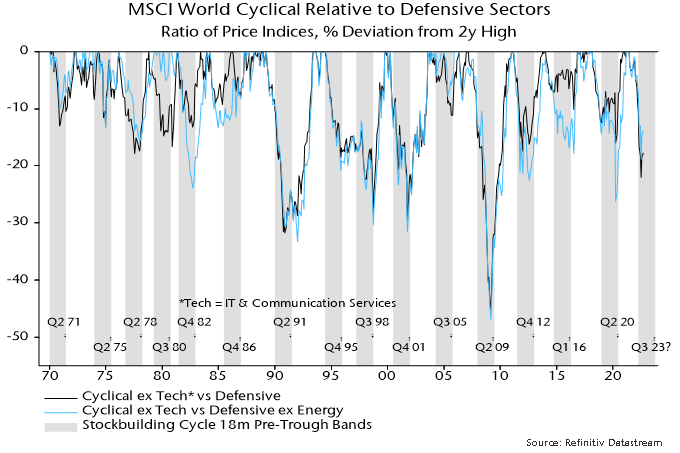
Chart 5 reproduces the shading in chart 4, superimposing the drawdown from a rolling two-year high of the non-tech cyclical / defensive sector price relative (including and excluding energy). Historically, the price relative has usually bottomed late in the downswing, or even after the trough. 

Chart 5

Chart 5 showing MSCI World Cyclical to Defensive Sectors Ratio of Price Indices, % Deviation from 2y High

Cyclical sectors also underperformed sharply at the start of downswings in 2000 and 2011. Minor recoveries ensued followed by a second bout of weakness as the cycle moved towards the trough. 

A major relative price low in July so soon after the cycle peak would be unprecedented.

The weak absolute returns in the period reflect a very challenging investment environment for our strategy. Our focus on African and Asian companies and through-the-cycle underwriting process puts us at a cyclical disadvantage when food and oil prices experience sharp and sustained inflation. The consumer basket in our markets is over-indexed to those basic commodities, and the fiscal and balance of payment dynamics of most developing countries (where we exclusively invest) are inversely correlated to commodity prices.

While we invest in companies rather than countries, our portfolio construction process is primarily top-down driven and aims to produce a healthy mix of factors including country, sector, market capitalisation and valuation. The strategy will always be geared to domestic themes and entrepreneurial businesses which naturally results in the portfolio being under-indexed to straight commodity plays or interest rate sensitive large state-owned banks. Nevertheless, we generally do not try to make oversized single sector bets, as we have the luxury of picking exceptional businesses across a wide geography without heeding to any particular index.

As active and long-term investors, portfolio turnover comes from three sources:

  1. Positive thesis: a new buy or an increase in investment in an existing portfolio company, or an exit or reduce in an investment that reached a level that we deem to be full value
  2. Break in thesis: an exit on a break in thesis on a company due to high forecast error. These forecast errors typically come about when we underestimate competitive intensity, did not anticipate adverse regulations, or don’t agree with capital allocation decisions by management teams. Note that in these situations, the decision is typically to exit the investment, rather than reduce
  3. Change in environment: an exit or a reduce due to a change in the macroeconomic environment that overwhelms the positive attributes of the business we underwrote for a longer period than we think is tolerable  

Year-to-date, the majority of our decisions can be classed under the last point. The macro environment in Egypt and Pakistan has materially worsened after the Russian invasion of Ukraine and as a result we exited two companies in the former and one company in the latter, and right sized our portfolio in both countries. We also selectively reduced exposure in Kenya in response to the same changes in the macroeconomic environment. As a result, cash has experienced the largest percentage increase in the portfolio.

More recently, we started to selectively put cash to work, focusing on companies we previously shunned on valuations and portfolio companies that have de-rated to levels that make them attractive for re-investment. All of those investments are in Asia as we still believe certain countries there will prove more resilient compared to their peers in Africa and other markets we invest in.

As global recessionary fears grow, we see a silver lining emerging in the form of softer commodity prices, which if sustained, will provide much-needed relief to developing market economies. Unless a recession proves deep, we think lower commodity prices will be a net positive to those countries. Moreover, we believe many of our portfolio companies will be resilient through a recession given the nature of the products and services they sell and/or the type of customer they target; supported by very healthy balance sheets and potential margin expansion they can experience if commodity prices continue to come off.

Figure 1: commodity prices

Chart of Refinitiv/Core Commodity Price Index. Chart of Generic Wheat Price.
Source: Bloomberg

Figure 2: country and region exposure

Country Exposure. Indonesia: 20%. Morocco: 14%. Philippines: 14%. Kenya: 10%. Vietnam: 9%. Egypt: 8%. Kazakhstan: 5%. Malaysia: 5%. Other: 4%. Pakistan: 2%.  Regional Exposure chart showing Asia with approximately 50%, Africa with approximately 40%, and Other with approximately 10%.
Source: Vergent Asset Management


Figure 3: portfolio ownership type

Commodity Sensitivity (Pro-rated 100). Commodity Short: 58%. Commodity Long: 42%. Ownership Type. Multinational: 28%. Owner Operator: 65%.
Source: Vergent Asset Management

Figure 4: sector exposure

Sector Exposure. CPG: 25%. Retail: 17%. Payments: 17%. Software: 12%. Health: 8%. Micro Finance: 5%. Education: 2%.
Source: Vergent Asset Management

To support our investment decisions in this difficult environment, our team has visited four countries in the last two months, with a focus on portfolio companies rather than new idea generation.

Our first trip was to Morocco where we visited LabelVie, the leading grocery retailer in Morocco and a core holding in the portfolio. Our bullish view on LabelVie as the long-term winner in Morocco’s grocery market was reinforced after our trip. The company operates in a market dominated by traditional trade (+85% of the market) and a limited set of modern chained competitors. Morocco is a country with supportive demographics, solid balance of payments fundamentals, and a self-sufficient export-oriented agricultural economy which we think is always supportive for the development of the grocery retail industry.

We are most excited by Atacadão, the company’s cash & carry format, which targets traditional retail and professional buyers. The business sells bulk-packaged fast-moving consumer goods at the lowest price in the market (examples are cereals, rice, sugar, edible oils, beverages, laundry detergents, etc.). With Atacadão, LabelVie is enabling traditional trade rather than competing with it, a much less capital-intensive growth strategy. In some respects, Atacadão is disintermediating the antiquated, highly complex, and multi-layered fast-moving consumer goods (FMCG) distribution system that exist in many of the countries where we invest. These systems produces many negative externalities including inflation and wastage, which end up in higher consumer prices and lower retail margins.

After a few years of experimenting with the format, management seems to have cracked the code on Atacadão and is now looking to double store count to 26 within three years. Atacadão’s stores are approximately 30k square feet in size, carry around 4k SKUs, and are designed to maximise natural lighting to lower energy usage and keep operating costs down. The stores are strategically located near large catchment areas with supportive infrastructure to enable easy access to and from store. Each store has two sets of checkout aisles dedicated to professional buyers (cardholders, of which there are +35,000 today) or walk-in customers who are typically community shoppers.

This dual checkout system provides the company with a tremendous data asset, which they use to direct promotions or generate insights to brands (note that brands lose the data in the traditional distribution model). Uniquely, both national and global brands like Coca-Cola and Unilever deliver their products directly to Atacadão stores, reducing logistics investments and freeing existing warehouses and distribution centres for their other fast-growing retail format, Carrefour.

The Carrefour banner is another part of the LabelVie story that is delivering strong growth and gaining share in the modern grocery retail market in Morocco. The store’s focus on fresh produce, bakery, FMCG, and alcoholic beverages to generate footfall and utilise a price matching strategy with discounters to bring in shoppers from all income levels.

LabelVie’s key strength today is the ability to leverage its multi-brand platform to negotiate favourable terms with suppliers which it then transfers to shoppers (by lowering price) and shareholders (by increasing margins or subsidising store capex). We also had the privilege of spending time with the group’s new CEO, Naoual Benamar, a Procter & Gamble veteran whose appointment marks a new era for the company. Naoual spent the past three years at LabelVie before taking over from the founding CEO Zouhair Bennani, who continues to serve as Chairman.

Overall, we think the market is behind the curve on valuing the potential of Atacadão and Carrefour and see LabelVie as a multi-year secular growth story.

Figure 5: inside an Atacadão store (left) and Vergent team with LabelVie management (right)

Source: Vergent Asset Management

Our next trip was to Almaty, Kazakhstan where we spent nearly a week trying to learn everything we can about Kaspi.kz, a portfolio company that we discussed in detail in previous letters. We saw firsthand just how entrenched Kaspi is in the daily lives of Kazakh consumers and businesses. Whether it was a street performer, a small bakery, a Zara store in an upmarket mall or a McDonalds in a residential neighborhood, Kaspi consistently ranked as the most popular payments method for consumers. Kaspi’s operational excellence, hyperlocal strategy, obsessive focus on customer experience through Net Promoter Scores (NPS), and understanding of how incentives drive behaviour allowed them to build an unrivaled two-sided proprietary payments ecosystem so powerful that it even leapfrogged Visa and MasterCard – two of the largest and most well-funded payment networks in the world.

Kaspi is constantly looking at ways to drive value within its ecosystem. One example is in Marketplace, where Kaspi ranks as the leading online marketplace in Kazakhstan and where payments services sit neatly alongside BNPL, logistics and advertising products, all of which drive GMV growth and increase monetization.

Even in an offline environment, Kaspi leverages its merchant acquiring asset and consumer app to generate sales to merchants in-store through targeted promotions and sales activities, creating more opportunities for buyers and sellers to transact. We were fortunate to spend time with members of the senior management team who reiterated how the company is centered on its NPS score, which not only drives new product ideas but also serves as the primary KPI for management compensation. This was most evident during one of our unaccompanied visits to a Kaspi branch, where we were delighted to receive an Apple Store-like customer experience, with staff happily assisting us in navigating the very futuristic (and Kazakh/Russian language only) ATM.

We also had the privilege of spending two hours with Kaspi’s CEO Mikael Lomtadze at his office in Almaty, where we got to hear the Kaspi story from the man credited with turning the company from a failing corporate bank into the super-app of today. It is rare to get audience with Lomtadze and so we took the opportunity to ask him tough questions to which we believe we received candid and thoughtful answers. In this meeting, it became evident that Mikael’s clear vision and operational execution which focuses on customer experience, technology, and big profit pools are very much responsible for Kaspi’s success.

Kazakhstan remains in a political bind due to its proximity and links to Russia, as well as the evolving and fluid domestic political scene which we covered in the last letter. This complicates the bottom up thesis on Kaspi, but by no means breaks it. We believe the market fails to properly appreciate that Kaspi has entered a sweet spot where every product launched will have an unusually high rate of success because it is released into a scaled and highly engaged ecosystem with multiple virtuous cycles running simultaneously. We still firmly believe that the risk-reward on Kaspi sets up the strategy for significant upside down the line.

Figure 6: Kaspi QR code in retail and a photo from our visit to a Kaspi branch

Source: Vergent Asset Management

Figure 7: Kaspi.Kz app interface

Source: Vergent Asset Management, Kaspi.kz

Later in the month, we made our way to Indonesia where we spent four days between Jakarta, Semarang, and Surabaya.

Figure 8: journey from Jakarta to Surabaya via Semarang

Google map showing the driving distance between Jakarta and Surabaya (791 km = about 9 hours & 55 minutes).
Source: Google Maps

We met with several companies including Sido Muncul, a business we have written about extensively in the past. While we had previously visited with the company, this was the first trip to their manufacturing facilities in Semarang, in Central Java.

What stood out as soon we entered the Sido Muncul campus was the tranquil atmosphere. The facility is set among lush greenery and the scent of herbs used in production gave the place more of a yoga retreat vibe than a manufacturing facility. We were surprised to see the extent of technological advancement of the manufacturing process, given that the reins are still held by the founding family and that the primary formulation dates back to a recipe first recorded by the founding grandmother in the 1940s.

The company’s new facilities all run off a single dashboard and the German-made machinery does the rest. Production efficiency is critical to optimising yields, which leads to higher per ton values, more sales, and higher margins. While the Tolak Angin brand remains the biggest moat of the company in our view, the complications of sustainably sourcing over 900 herbs from local farmers, scaled manufacturing process, and wide distribution reach reinforce Sido’s dominance in the market. With margins that exceed Coca-Cola’s, Sido is a cash machine that still manages to grow in the low to mid-teens. Investors have long called Sido a single product company, and to a large extent it is. However, our view is this single product is extremely valuable and has a much longer growth runway than the market gives it credit for.

In addition, management’s focus on innovation and new product development can support growth beyond Tolak Angin; our channel checks in retail showed that Sido is becoming a force to be reckoned with in the supplements and vitamins category. Those new products will take time to contribute given the growth of the core Tolak Angin product but are all positive steps that reinforce brand value and set up premiumisation routes for years to come.

We also came away impressed with Sido’s sustainability initiatives:  herbal waste now produces ~40% of the plant’s energy requirements and investment in solar panels is visible on plant rooftops. For a traditional herbal medicine company, Sido is progressive and modern. As a consumer company, it stands out due to its low input FX requirements, limited global raw material exposure, and strong pricing power.

Figure 9: Vergent team touring parts of the plant with Sido’s Head of Manufacturing

Source: Vergent Asset Management, Sido Muncul

Figure 10: photo op with Mr. Irwan Hidayat, major shareholder and 3rd generation of the founding family of Sido Muncul

Source: Vergent Asset Management, Sido Muncul

Figure 11: Sido supplement and vitamin products in retail

Source: Vergent Asset Management

Our final stop was in Malaysia where we spent time with Mr DIY’s management team in Kuala Lumpur. MR.DIY is a leading multi-price point retailer with 947 stores across Malaysia. Given its name, many market participants describe it and benchmark it as a home improvement retailer. We are puzzled by that confusion as the store format, average ticket size, and pricing strategy all point to MR.DIY being more of a dollar store or fixed low-price retailer (similar to  Dollar General, Family Dollar, and Dollarama). The MR.DIY store is typically about 10k square feet in size, carries 18k SKUs of fast moving non-grocery items with a focus on home, garden, hardware, and electrical. Like LabelVie, MR.DIY seems to have gotten the formula down: low prices, assortment, and locational convenience underpin their customer proposition and their attractive unit economics (payback periods of around 2 years).

The company is data-driven and uses a scientific approach to inventory management, which leads to an iterative and more efficient process over time. The company rewards its staff by distributing the excess of targeted level of margin per store. This incentive program naturally drives efficiencies and allows for more margin to be invested back into low prices. Staff are collectively incentivized to keep the stores in tip top shape. Online risk appears to be low due to the nascence of the e-commerce infrastructure at the price point that Mr.DIY clears at. The experience of Dollarama in Canada suggests that the online threat can be managed and we think Malaysia is years behind Canada in terms e-commerce penetration. Consumers may shop for electronics online, but will buy low value daily items from MR.DIY or competing store that can offer similar value. Furthermore, it is easy to see how one would leave the store buying much more than initially planned. The plethora of ‘things you didn’t know you needed until you saw them’ at very low prices is astounding.

On the ground, we observed how busy the stores are and the wide range of customers they serve, including families, young couples, and tradesmen depending on the time of the day and the location of the store. To our surprise, we saw many copycat stores that use the MR.DIY colour scheme as we drove outside Kuala Lumpur, a positive signal for the brand in our view. Like many of our portfolio companies, MR.DIY is majority founder/operator owned. Unlike all of our companies however, the founder, Mr Tan Yu Ye (YY), rarely meets investors and instead the company’s CEO Adrian Ong is given corporate and finance responsibilities while YY focuses on operations. Adrian owns 0.6% of MR.DIY (~$25 million) and is a former private equity executive who has a very good handle on the numbers and the business. This split of responsibilities is unusual but not necessarily bad for the business as each individual focuses on their areas of strength. Our investment thesis on MR.DIY was reinforced by what we observed on the ground and the strong unit economics of the business, which we will receive a boost from the reopening of Malaysia’s economy and the easing of global supply chain stresses in recent months.

Figure 12:  Front of a busy MR.DIY store in Kuala Lumpur (left) and our team inspecting the aisles (right)

Source: Vergent Asset Management

Figure 13: Vergent team with Mr. Adrian Ong, CEO of MR.DIY

Source: Vergent Asset Management

As markets adjust to the new economic realities, we see a strong opportunity set emerging for the strategy. We believe that choppy and volatile markets offer fertile ground for fundamental stock pickers. A few of our portfolio companies also stand to benefit from this environment as their competition weakens and their bargaining position strengthens. While risks are elevated, valuations in certain areas are starting to more than bake in these risks and we are gradually and selectively rebuilding exposure in our favourite businesses.

Vergent Asset Management LLP

The assessment here a month ago was that Chinese monetary policy easing was gaining traction but that additional stimulus and a further recovery in narrow money momentum were required to adopt a positive view of economic prospects.

These conditions have been partially fulfilled: the PBoC has delivered additional easing and six-month narrow money growth picked up in July; however, a food-driven rise in CPI momentum held back real money expansion.

The news, on balance, warrants an upgrade to the assessment: economic momentum is judged likely to recover in late 2022 / H1 2023 barring further negative shocks.

This interpretation, of course, is at odds with deepening consensus gloom. According to the consensus, this week’s “surprise” rate cut was a panic response to worryingly weak July activity and credit data.

The PBoC, like other central banks, controls short-term money market rates by adjusting the supply of bank reserves relative to demand*. Money rates have fallen steeply since late July, signalling that the PBoC was stepping up easing – see chart 1. Rather than a panic move, the cut in official rates confirms a policy shift that began weeks ago.

Chart 1

Chart 1 showing China Interest Rates

Weaker-than-expected July activity numbers probably reflect payback for May / June gains boosted by catch-up effects following covid disruption. Seasonally-adjusted levels of key series remained comfortably above April lows – chart 2.

Chart 2

Chart 2 showing China Activity Indicators January 2019 = 100, Own Seasonal Adjustment

Talk of credit weakness is also exaggerated. The small rise in broad credit (total social financing) in July follows a larger-than-expected increase in June, with six-month growth the same as in April / May – chart 3.

Chart 3

Chart 3 showing China Nominal GDP & Money / Social Financing (% 6m)

The consensus view ignores better monetary data. Six-month broad money growth in July was stable at the highest level since August 2020. Narrow money growth rose further to its highest since January 2021.

The disappointment in July data, from the perspective here, was a pick-up in six-month CPI momentum, which dragged real money growth lower despite the nominal acceleration – chart 4.

Chart 4

Chart 4 showing China Narrow Money & Consumer Prices (% 6m)

CPI strength was driven by food (pork) prices with annual core inflation still low (0.8%) and PPI inflation falling. Earlier monetary weakness argues for a benign near-term inflation outlook and base effects suggest a decline in six-month CPI momentum in September / October.

*The supply of reserves reflects factors such as flows into / out of government accounts at the central bank and foreign exchange intervention as well as open market operations, changes in reserve requirements etc. Estimates of net supply based only on observable OMOs and other interventions are liable to be misleading whereas movements in money rates reflect the balance of all supply / demand influences.

Office Buildings in Financial District La Defense, Paris, France

Equities have rallied since the low point in June but several headwinds remain, including a slower economic outlook, tightened financial conditions, and the end of the reopening dynamics coupled with an uncertain gas supply in Europe.

Here are some thoughts regarding the European economic landscape and fundamentals behind companies having reported their half year financial results:

  • The majority of European companies have reported their first half results. The levels of earnings beats remains very high. Indeed, the magnitudes of these beats have hit a new records. So far, 69% of companies in STOXX 600 index have reported revenues beating consensus while 17% missed. The revenue beat/miss ratio for this European index reached 4.0x at the end of July versus the 5-year average of 1.7x, according to BNP Paribas Exane Research’s Strategy on August 5, 2022.
  • Amongst other things, European companies have benefited from the reopening of the economy and a weak Euro. Companies that generate a significant portion of their sales in U.S. dollar have experienced a positive translation effect on their top line. Looking at the performance by geographies, sales generated in North America outperformed while sales in China, Northern and Eastern Europe underperformed.
  • Consumer sentiment deteriorates; with real disposable income falling, non-essential purchases like apparel may be impacted. This creates the risk of oversupply and possibly the need for general retailers to offer significant discounts to clear up inventory. Companies like Gap and Walmart have seen an increase in promotional activities. On the other hand, companies exposed to the service side of the economy continues to experience strong consumer demand. Travel and lodging remains a priority.

Resurgence of political risk; the resignation of Italy’s Prime Minister Draghi adds uncertainty to the future fiscal path of Italy and may contribute to higher spreads. The election planned for September 25 will hopefully provide more clarity on the sustainability of the Italian public finances.

Photo of Michael Mortimore

Michael Mortimore, NSP’s Client Portfolio Manager spoke to WealthBriefing on how analysis of liquidity cycles can help provide discipline in stock selection and asset allocation.

Michael joined NS Partners in February 2022, and previously worked at Somerset Capital and Macquarie Bank.

In the article, he explains how watching the flow of money from central banks can guide decisions on investing in those economies. He illustrates this theme using current emerging market examples, such as southeast Asia. According to Michael, “Our thinking behind exposure to the region was partly the chance that oil prices will stay high for longer, along with strong commodity prices and supportive money numbers. These markets have had a really good run this year and have recently been a source of cash for us.”

The article was published on August 11, 2022 in WealthBriefing, and was syndicated in WealthBriefing Asia.

Read the full article now.

Connor, Clark & Lunn Infrastructure (CC&L Infrastructure) and CarbonFree Technology are pleased to announce the closing of approximately USD$360 million in debt financing facilities for their portfolio of utility-scale solar projects located in Chile. The financings are comprised of a $19mm letter of credit facility, a $71mm bridge-loan facility which will be used to fund ongoing construction costs, and a ~$270mm private placement facility whose proceeds will be used primarily to refinance existing bank debt and repay the bridge-loan facility once projects complete construction. The private placement issuance has been rated BBB+ by S&P and was well oversubscribed by a syndicate of large North American financial institutions.

“We are excited to complete this refinancing, one of the largest solar project private placements in Chile to date,” said Matt O’Brien, President of CC&L Infrastructure. “The aggregation, de-risking and successful construction of individual, small-scale projects is the culmination of a multi-year strategy, allowing us to secure long-term financing at competitive rates and create value for our investors. Our base of Chilean solar assets is part of our large and rapidly growing energy transition portfolio that aggregates over 1.5 gigawatts of renewable assets across a range of clean energy technologies.”

Since making their initial investment in Chile in 2017, CC&L Infrastructure and CarbonFree have significantly expanded their portfolio, with 37 individual ground-mounted solar projects in operation and a further 16 projects currently under construction or expected to begin construction shortly. The total Chilean solar portfolio is comprised of approximately 360 megawatts (MW) of generation, including more than 250 MW of operating projects and 110 MW of projects currently in or about to enter construction. The portfolio is forecast to be fully operating by the second half of 2023.

“Chile is making excellent progress towards the country’s 2030 clean energy and decarbonization targets, in addition to their overarching goal of net zero carbon emissions by 2050. We’re pleased that our portfolio of solar projects can contribute to this leadership on climate action, as well as provide Chilean citizens with affordable electricity for years to come,” said David Oxtoby, CEO of CarbonFree.

The power generated by these projects is sold at stabilized prices under Chile’s Pequeños Medios de Generación Distribuidos (PMGD) program and is transmitted to the grid through transmission infrastructure owned by local distribution companies. Once the full portfolio has been completed, the facilities will be capable of producing more than 750,000 MW hours of clean electricity annually.

About Connor, Clark & Lunn Infrastructure

CC&L Infrastructure invests in middle-market infrastructure assets with attractive risk-return characteristics, long lives and the potential to generate stable cash flows. To date, CC&L Infrastructure has accumulated over $5 billion in assets under management diversified across a variety of geographies, sectors, and asset types, with over 90 underlying facilities across over 30 individual investments. CC&L Infrastructure is a part of Connor, Clark & Lunn Financial Group Ltd., a multi-boutique asset management firm whose affiliates collectively manage approximately CAD$96 billion in assets. For more information, please visit www.cclinfrastructure.com.

About CarbonFree Technology

CarbonFree Technology is a member of the CarbonFree Group of Companies based in Toronto, Canada and Santiago, Chile. CarbonFree develops, finances, manages construction, operates and owns solar projects and is active in Canada, the United States and Latin America. Over the past 15 years, the company has developed more than 120 solar power projects with a total capacity of more than 660 MW. For more information, please visit www.carbonfree.com.

Contact

Vrushabh Kamat
Connor, Clark & Lunn Infrastructure
(437) 928-5184
[email protected]

Daniel Soper
CarbonFree Technology
(416) 975-8800 x603
[email protected]

The yield spread over Treasuries of the ICE BofA US corporate high yield index rose from 310 bp at end-December to a peak of 599 in early July. It has since retraced more than half of this move. Was the early July peak a major top, with a further decline in prospect? This seems unlikely, for several reasons.

First, the “financing gap” of non-financial corporations – the difference between capital spending and domestic retained earnings – is a long leading indicator of credit spreads and has widened significantly in recent quarters.

Chart 1 shows an expanded measure of the gap including financing required for net equity purchases. This measure moved from a negative position (i.e. a surplus) in Q1 2021 to 4.3% of GDP in Q1 this year, reflecting a strong rise in capital spending – including on inventories – and a pick-up in equity buying.

Chart 1

Chart 1 showing US ICE BofA High Yield Index Option-Adjusted Spread (bp) & Non-Financial Corporate Business Financing Gap* (% of GDP) *Including Financing for Equity Purchases (net)

The expanded financing gap rose above 4% of GDP in 1989, 1998, 2000, 2006 and 2019. The high yield spread subsequently increased to at least 850 bp. (The gap also exceeded 4% in Q4 2017 but was temporarily inflated that quarter by revenue shifting by corporations to take advantage of lower tax rates from 2018 – there was an offsetting surplus in Q1 2018.)

Secondly, the high yield spread correlates contemporaneously with the credit tightening balance in the Fed’s senior loan officer survey – chart 2. This rose sharply between April and July and special questions in the July survey suggest a further increase in H2 – see previous post for more details.

Chart 2

Chart 2 showing US Fed Senior Loan Officer Survey Credit Standards Tightening Indicator* & ICE BofA High Yield Index Option-Adjusted Spread (bp) *Average of Balances across Loan Categories

Thirdly, the stockbuilding cycle is judged here to have entered a downswing that may – based on the average length of the cycle – extend into mid to late 2023. Historically, the high yield spread has usually peaked late in the downswing or even after the trough – chart 3. The 2011-12 downswing was an exception but the early surge in the spread on that occasion probably reflected credit market contagion from the Eurozone sovereign debt crisis.

Chart 3

Chart 3 showing US ICE BofA High Yield Index Option-Adjusted Spread (bp)

Finally, the two measures of global “excess” money tracked here remain negative, a condition historically associated with a widening spread on average – table 1. The first measure – the gap between six-month real narrow money and industrial output momentum – may turn positive during H2 but the second measure – the deviation of 12-month real momentum from a moving average – will almost certainly remain negative. That combination has also been negative for credit historically.

Table 1

Table 1 showing Average Change in US High Yield Spread ICE BofA Index, 1986-2021, bp annualised

The Fed’s July senior loan officer survey signals a major slowdown in US bank lending in H2 and 2023.

Most commentary focuses on survey responses about credit standards and demand for commercial and industrial (C&I) loans. However, the Fed calculates aggregate indicators incorporating data for all loan categories (i.e. also including commercial real estate (CRE), consumer and residential mortgages).

These indicators weakened sharply in Q2*, moving below their averages since 1995 – see chart 1.

Chart 1

Chart 1 showing US Commercial Bank Loans & Leases (%6 m) & Fed Senior Loan Officer Survey Credit Demand & Supply Indicators* *Weighted Average of Balances across Loan Categories

Demand for residential mortgages weakened most, with smaller declines for CRE and consumer loans. C&I loan demand remained strong, driven by inventory financing (negative for economic prospects).

Credit tightening was across the board but most pronounced for CRE and C&I loans. Banks cited a less favourable economic outlook, industry-specific problems and reduced risk tolerance as key drivers of the tightening of C&I loan standards.

Is the degree of credit restriction consistent with a recession? The Fed’s aggregate credit tightening indicator combines data for the various loan categories using their weights in banks’ lending books. The indicator is unavailable before 1995 but similar results are obtained using a simple rather than weighted average, and this alternative indicator can be estimated for earlier years from partial data for the loan categories.

Chart 2 shows that this alternative indicator rose above 28% before or during seven of the last eight recessions, with no false positive signals. The single false negative was the double-dip recession of 1981-82, which was arguably an extension of the 1980 contraction rather than a separate cyclical event.

Chart 2

Chart 2 showing US Fed Senior Loan Officer Survey Credit Standards Tightening Indicator* *Average of Balances across Loan Categories

The indicator rose from -4% in the April survey to 17% in July, i.e. below the critical value. The current level was reached in 1968, 1978 and 1998 without an accompanying recession.

The July survey, however, included special questions about banks’ expectations for credit tightening for selected loan categories in H2. A net 52% expect to tighten standards on C&I loans, up from an actual 23% in Q2. Smaller but significant increases are signalled for consumer loans and residential mortgages. Assuming no change for CRE loans (which were not covered by the special questions), the aggregate alternative indicator in chart 2 is forecast to rise to 33%, i.e. above the 28% recession threshold.

*The survey cut-off date was 30 June.

Central bankers have ignored the lessons of their 2020-21 policy blunder and deserve the opprobrium they are likely to attract as an economic debacle continues to play out over coming quarters.

Policy-making can be accurately described as anti-monetarist, not merely in the sense that money data are ignored but rather that decisions are the precise opposite of those warranted by monetary trends.

The central banks continued to pursue ludicrously outsized QE in 2020-21 even as money growth surged to a level that would have embarrassed their 1970s predecessors; and they ripped up earlier guidance and tightened aggressively this year despite monetary trends screaming recession and now deflation risk.

June money data for the US, Eurozone and UK published this week highlight the scale of the policy fiasco under way before this month’s further tightening moves. (The Bank of Japan deserves an honourable mention for refusing to join the lemming rush.)

With Canada yet to release June data, the six-month rate of change of G7 real narrow money is estimated to have fallen further to -3.1% (-6.1% annualised), a level previously reached only before / during severe recessions in the mid 1970s and early 1980s. Real broad money, meanwhile, is contracting faster than during those episodes – see chart 1.

Chart 1

Chart 1 showing G7 Industrial Output & Real Money (% 6m)

Until April, real money weakness was attributable mainly to high inflation – six-month growth of nominal narrow money, though slowing sharply, was still in the middle of its pre-pandemic range. No longer: six-month nominal growth fell to 1.6% (3.3% annualised) in June – chart 2.

Chart 2

Chart 2 showing G7 Narrow Money & Consumer Prices (% 6m)

The impact of this year’s policy tightening is better reflected in the three-month rate of change, which crossed below zero in June, a rare occurrence signalling recession and / or price declines historically – chart 3.

Chart 3

Chart 3 showing G7 Narrow Money (% 3m annualised)

The narrow money measures calculated here for the US and UK fell month-on-month in June, while the Eurozone measure was flat.

Narrow money is more sensitive to policy changes than broad money but the broad numbers are no less alarming. Three-month growth of G7 broad money slumped to 1.3% annualised in April, moving sideways in May and June – chart 4.

Chart 4

Chart 4 showing G7 Broad Money

The monetary evidence, therefore, is that policy settings had already reached overkill territory by mid-year, suggesting a severe recession with rising medium-term deflation risk.

One false counter-argument to this assessment cites the strength of bank loan growth, particularly in the US. Non-monetarists offer this as evidence that financial conditions are not yet restrictive. Even some monetarists have suggested that lending strength is relevant for assessing rate settings, since money growth will recover if lending momentum is sustained.

It won’t be. Bank lending is a coincident / lagging indicator of the economy. It is normal for loan growth to be strong and / or rising before a recession – chart 5.

Chart 5

Chart 5 showing US Commercial Bank Loans & Leases (% yoy)

Corporate loan demand has been inflated by an unusually large surge in stockbuilding that is now starting to reverse – chart 6. The ECB’s latest bank lending survey signalled a sharp fall in credit demand, along with tightening supply – expect the corresponding Fed survey next week to give the same warning.

Chart 6

Chart 6 showing US Stockbuilding as % of GDP (yoy change) & Commercial Bank Commercial & Industrial Loans (yoy change in % 3m)
Farmer hand holding young plant.

In this week’s commentary, we take a different approach. Written by Sain Godil, Portfolio Manager, he shares how the alchemy of art and science that goes into gardening is similar to Global Alpha’s investment philosophy.

Recession, war, supply disruption, inflation, and Bitcoin crash – it seems that this is much of what you hear in the news these days. Our recent weeklies have focused on how our portfolio is extremely well positioned to benefit in periods of turmoil. We have also talked about how and why small caps tend to outperform in a global recession. So, we don’t need to cover these themes again.

Today’s weekly topic is a bit different. It came to mind while I was tending my garden. Like most people, once the first signs of spring arrive, I begin thinking about what vegetables and flowers to grow.

Gardening has become a hobby of mine because it gets me outside and pulls me away from my digital devices. It allows me to show my kids where food comes from and what goes into growing your own plants. Plus, what’s better than watching seeds transform into a tasty salad you share with your friends and family over a glass of wine?

While I was pruning my tomato plants, it occurred to me there are many similarities between gardening and the Global Alpha investment philosophy. Just like investing, gardening is an alchemy of art and science. You need a proven process, vigilance, and patience to yield fruit. Here’s how I see the parallels.

Step 1 – Preparing the ground

Gardening – It all begins with a vision of where you want to position your garden bed. The type of soil and fertilizer you choose will have a direct impact on the yield you get when the plants bloom later in the summer. Make the wrong choice, and all the time and money you spent goes to waste.

Investing – Similar to gardening, smart investing begins with careful positioning. This can be done via different asset classes, market cap ranges, fundamental or quant-based approaches, etc.

At Global Alpha, we are fundamental managers focused on global small cap. That’s our “fertile ground”. As stock pickers, this strategy gives us an opportunity to identify the best companies out of an available of 11,000 names. By carving out this particular garden patch of the investible universe, we lay the groundwork for fruitful returns for our clients.

Step 2 – Choosing the right plants

Gardening – After preparing the garden bed, you need to decide which plants to grow and where to place them. Each plant needs a specific amount of sun and water to optimize the yield. I learned this firsthand last summer, when I mistakenly placed my pepper plants in the shade and ended the season with only two tiny green peppers (one of which was eaten by a squirrel).

Investing – Just like a garden needs adequate sunlight and water, your portfolio needs companies that can grow revenues and profits much faster than the industry. We achieve this objective by understanding the addressable markets in which our companies operate – and identifying names that are well-positioned to flourish in that environment.

As our companies grow their revenues and earnings, investors can expect healthy out-performance over the long term. On the flip side, if the end market is shrinking, even the most promising company cannot grow. It simply won’t get the nourishment and support needed to thrive.

Step 3 – Care and attention

Gardening – An outdoor garden needs your constant attention. Besides regular watering, you must be on guard against the continuous onslaught of insects and animals that want to gobble up your harvest. Weeding and pruning are also key to optimizing the health and output of your plants. It’s all about staying vigilant.

Investing – At Global Alpha, we are constantly re-evaluating every holding in the portfolio. Our on-the-ground research helps us identify threats our companies may face. By meeting competitors, we get an understanding of the market dynamics and challenges our companies may face in the future. Based on the intel we gather, we prune the portfolio by managing the weights of individual companies. This is how we create a diversified portfolio that adds value in up markets and has superior down market protection. In other words, we know how to weather the storm.

Step 4 – Reaping your rewards

Gardening – All the hard work has paid off, and it’s time to reap your rewards. Nothing compares to the taste of vegetables you grew yourself. And, it’s also the perfect time to reflect on how you’ll optimize your growing process for next year to get an even better harvest.

Investing – Our team spends a lot of time reflecting on what we got right and what could have been improved in the portfolio management process. We are constantly evaluating which other companies and industries we could invest in. It’s all about continuous improvement to deliver the best possible results.

Conclusion

As I write this, the garden I planted in the spring has begun to flourish with kale, spinach, peppers, tomatoes, cucumbers, and herbs. Each year it gets better as I refine my growing process and figure out which pitfalls to avoid (like those sneaky squirrels).

It brings to mind the Global Alpha journey, which began with three founders and has expanded to 14 team members over the past 14 years. Since inception, our continuous refinement of our portfolio management process has helped us consistently outperform the benchmark.

Despite the inevitable changes in the weather, our team continues to learn, adapt, and identify flourishing businesses around the world. Here’s to another 14 years of growth!