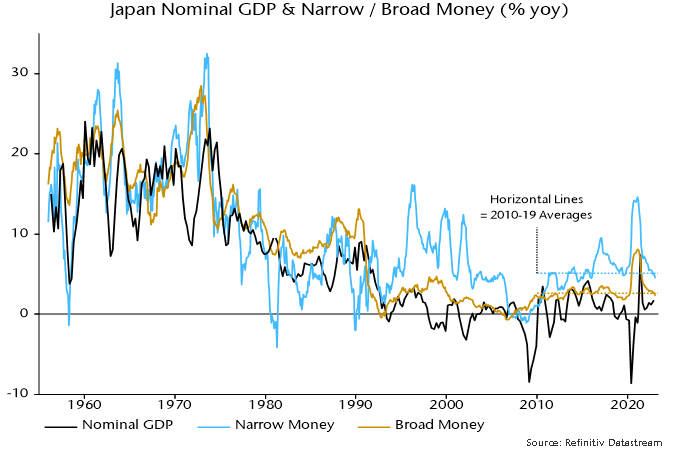
Japanese monetary trends continue to argue that current inflation is “transitory” and there is no case for BoJ policy tightening.
Broad money M3 rose by just 0.1% in January, pulling annual growth down to 2.3%, below a 2010-19 average of 2.6%. Annual M1 growth is also below its corresponding average – see chart 1.
Chart 1
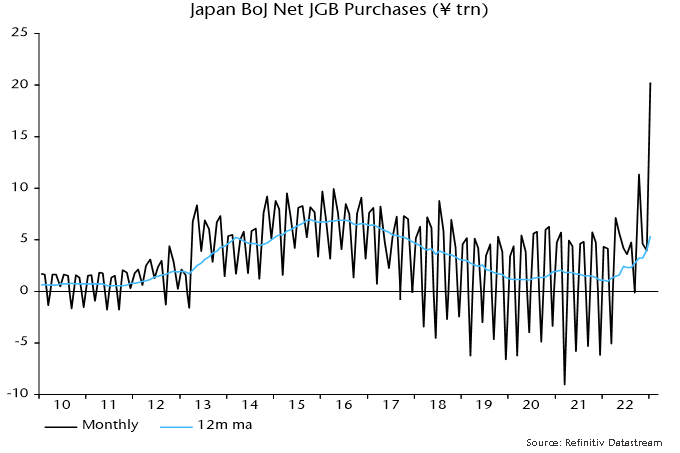
M3 showed little growth on the month despite BoJ net JGB purchases reaching a record ¥20.3 trillion, equivalent to $155 billion or 1.3% of the stock of M3 – chart 2. The modest M3 increase pushes back against claims that BoJ JGB buying has “pumped liquidity into markets”.
Chart 2
A counterparts analysis of M3 is not yet available for January but the lack of impact of QE is probably explained by the BoJ transacting mainly with commercial banks. A purchase from a bank involves a JGB / reserves swap with no effect on deposits held by non-banks.
A further technical point is that Japanese money definitions exclude holdings of non-bank financial institutions, so purchases from such institutions also have no direct effect on M3.
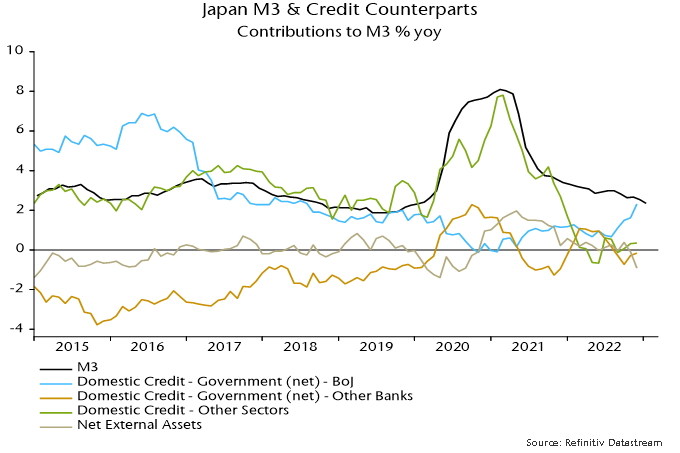
Chart 3 shows the contributions to annual M3 growth of selected credit counterparts through December. A substantial positive contribution from QE (domestic credit to government from BoJ) was offset by weakness in domestic credit to other sectors and negative contributions from commercial bank JGB sales (domestic credit to government from other banks) and net external flows. The latter drag partly reflects BoJ intervention to support the yen in late 2022.
Chart 3
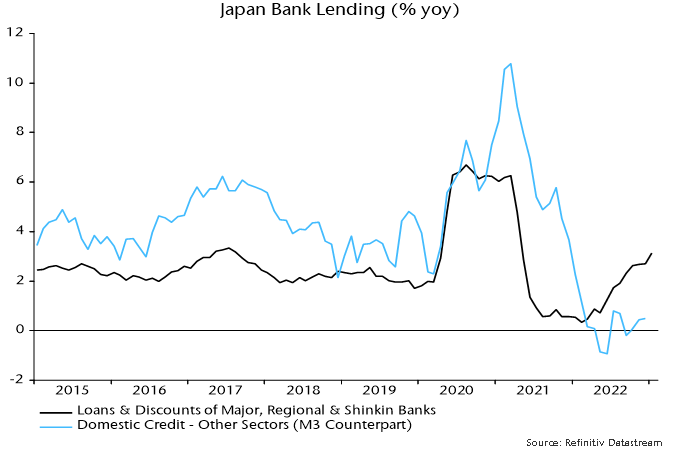
The weakness of credit expansion to non-government domestic sectors in the M3 counterparts analysis contrasts with a recent pick-up in annual growth of loans and discounts by major, regional and Shinkin banks – chart 4. The explanation for the divergence is that the M3 credit measure encompasses lending to non-bank financial institutions, including by the BoJ. Such lending surged during the pandemic but has contracted recently.
Chart 4
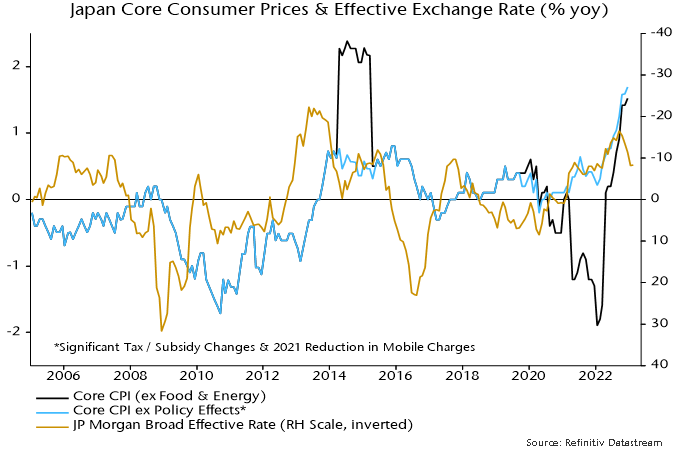
Annual all-items consumer price inflation rose to 4.0% in December, the highest since 1981, and may have reached 4.5% in January, based on Tokyo data. Core inflation adjusted for the impact of major policy changes was 1.7% in December and may have increased to 2.0-2.1% in January. The recent pick-up partly reflects yen weakness, which may be reversing – chart 5.
Chart 5
Annual cash earnings growth surged to 4.8% in December as winter bonuses reflected recent strong profits. Scheduled earnings growth of 1.8% is a better guide to trend but also represents a multi-decade high.
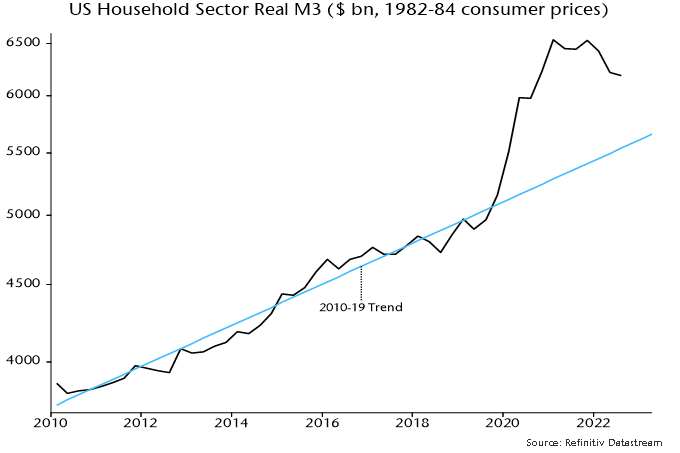
The reversal of the 2020-H1 2021 M3 growth surge suggests that inflation and earnings growth are at or near a peak and will return to pre-pandemic levels in 2024-25.
Investors globally have embraced global small cap equities as a source of equity diversification. Despite the name, the universe is largely comprised of companies with a market capitalization greater than US $1 billion and includes a growing number of household names in many of the local markets and some having a global brand recognition.
Key merits of global small cap
Not that small
Over 2,600 global small cap companies have a market capitalization greater than US $1 billion
Breadth and depth
Largest stock is only 0.2% of the index and there is broader sector diversification compared to other major market indices
Alpha opportunities
Global small cap markets are less researched by the analyst community compared with large cap developed equity markets, which creates added value opportunities for independent research by active managers
Background to global small cap
Global small cap stocks offer investors the ability to benefit from a unique opportunity set. The MSCI World Small Cap Index captures small cap representation across 23 developed market countries. Compared to a domestic context, the global small cap opportunities are not that small; there are 2,643 companies with a market capitalization greater than US $1 billion at December 31, 2022. There were only 209 such companies in the S&P/TSX Composite Index.
The largest individual stock in the global small cap index represents only 0.2% of the index. In contrast, the largest individual stock at the end of 2022 in the S&P/ TSX Composite Index represented 6.3% of the index.
Moreover, the largest 15 stocks in the Canadian equity market index account for 45% of the index, while the largest 15 stocks in the global small cap index represent less than 3%. It would require the largest 627 stocks to achieve 45% index representation in the global small cap index, highlighting the much broader investment opportunity set offered by the global small cap universe.
Many of the stocks in the global small cap universe are household names in their local market, and some have a global brand recognition. For example, L’Occitane, the manufacturer, marketer, and retailer of natural and organic skincare and beauty products; Samsonite, the world’s best-known and largest travel luggage company; and IWG, which offers short-term (and long-term) workspace solutions around the world, including well-known brands such as Regus.
The diversification benefits of global small cap go beyond individual stocks. While the major Canadian indices are heavily skewed to the financial, energy, and material sectors (see Figure 1), the global small cap markets provide representation across a broader range of sectors, including higher exposure to consumer discretionary (e.g., companies in the restaurant, luxury goods and travel industries) and health care.
Figure 1 – Small Cap Sector Diversification Merits
MSCI Global Small Cap Index (%)
S&P/TSX Composite Index (%)
Energy
5.0
18.1
Materials
7.6
12.0
Industrials
19.4
13.3
Consumer Discretionary
12.5
3.7
Consumer Staples
4.7
4.2
Health Care
10.7
0.4
Financials
14.3
30.8
Information Technology
10.8
5.7
Communication Services
2.8
4.9
Utilities
3.2
4.4
Real Estate
8.9
2.6
Total
100
100
Source: MSCI and Thomson Reuters Datastream. Data as at December 31, 2022
Over the last 10 years, the global small cap index has achieved the strongest return, albeit with greater volatility (Figure 2). As with all markets, it is important to understand the investment risks.
Source: MSCI and Thomson Reuters Datastream. Note: Index returns are in Canadian dollars.
Understanding the risks
While active managers can mitigate some of the risks through research and careful selection of individual stocks, when it comes to global small caps, investors should recognize the following:
Liquidity risk: It can take longer to trade a small cap stock compared to large cap stocks.
Information flow: While higher insider ownership associated with small cap stocks aligns with the interests of investors, it can also lead to less transparency and flow of information common with global large cap investments.
Credit access: Small companies do not have the same access to credit markets as larger companies, which can sometimes limit a small company from realizing its potential.
Recognizing the potential benefits
Offsetting the risks are a number of potential benefits of global small cap investments:
Growth opportunity: For investors who can identify the next generation of small companies that grow faster and graduate into the large cap segment, the reward is significant.
Greater alignment of interest: Global small cap companies tend to have a more focused line of business and higher insider ownership, resulting in greater alignment of interests between the owners and shareholders.
Sector opportunity: Investors can benefit from the higher consumer discretionary and health care sector representation offered by the global small cap index. For example, consumer-spending patterns indicate the consumer discretionary sector is likely to perform well over the long term. The health care sector should also benefit from demographic aging in the developed world.
Added value opportunity: Small cap companies also tend to be less externally researched by the analyst community. As a result, active managers have a greater opportunity to outperform their index benchmark by identifying companies whose share price does not fully reflect their intrinsic value or growth prospects. Based on the eVestment database, 71% of managers in the active global small cap universe outperformed the MSCI World Small Cap Index over the 5 years ended December 31, 2022.
Style offset opportunity: At the end of 2022, over 4,425 companies were in the MSCI World Small Cap Index. The broader opportunity set has led to an increased number of global small cap strategies offered by systematic (quantitative) investment managers. With a systematic approach, an investment manager is able to benefit from a breadth of understanding on a large universe of companies, compared to the depth of understanding associated with fundamental managers, who are focused on selecting a smaller number of companies to invest in. As for other equity markets, investors who can accommodate multiple managers in an asset class can benefit from the complementary systematic and fundamental styles.
Case for global small cap equities
The last several years has witnessed increased concentration in the global large cap developed equity market index. Introducing a global small cap equity component to portfolios can provide a complimentary source of diversification, a broader opportunity set of less externally researched companies, and thereby offering the potential for delivering returns above the index through active management.
Banyan Capital Partners, a leading Canadian middle-market private equity firm, is pleased to announce the following updates from 2022 which marked another successful year for the firm.
New Hires and Promotions
Scott Morrison has been promoted to Vice President, Business Development
Chris Luongo has been promoted to Associate
Marat Altinbaev joined in April 2022 as Vice President
Michael Tan joined in August 2022 as Senior Analyst
Banyan’s success depends on its ability to attract, develop, and retain high-quality talent.
In Banyan’s first year of ownership, three new executives were hired: • Mike Betts joined as VP Sales & Marketing • Jason Bagley joined as COO • Anand Khanzode joined as CFO
Launch of the Banyan Operating Partner Network and welcoming Jason Grouette
In December 2022, Banyan partnered with Jason Grouette, a former 3M executive to target investment opportunities in the safety and industrial B2B space.
We look forward to another successful year and are excited to explore new investments and partnerships with middle market businesses across North America. We continue to invest out of our $216 million committed capital fund targeting investments between $10 million and $50 million of equity per transaction in companies with EBITDA of at least $5 million.
Sparked by China’s rapid reopening, emerging market equities staged a sharp recovery from the lows of last October with the MSCI EM Index up nearly 23% (in USD terms) since the end of October, led by China which is up 54%.
The Institute of International Finance reported that January flows into EM equities and debt were the second strongest on record — the strongest being post-lifting of lockdowns in late 2020.
Buoyant sentiment in India is set to be tested with the collapse of Adani Group’s follow on public offer (FPO) after a report by U.S. short seller Hindenburg Research accusing the conglomerate of “brazen stock manipulation and accounting fraud over decades.”
The news drowned out positive press on the Indian federal government’s budget, with tax relief for India’s middle class expected to boost consumption, alongside a drive to slash regulations and improve the ease of doing business across the country.
The Bank of Korea is raising rates aggressively, pressuring equities and property markets. There is also added pressure from the downswing in the semiconductor cycle hitting DRAM giants Samsung Electronics and SK Hynix. Macro in Korea is a drag but longer-term the U.S. Inflation Reduction Act will provide a meaningful tailwind for the economy, particularly for those companies operating in the EV and renewables supply chains. There is also added pressure from the downswing in the semiconductor cycle hitting DRAM giants Samsung Electronics and SK Hynix but both are guiding for a H2 recovery and a strong 2024 outlook.
Similarly in Taiwan, there are signs that the semi cycle is bottoming. TSMC reported results with management expecting a H2 rebound in demand driven by increasing demand from data centres/hyperscale servers/AI applications, along with greater penetration in EVs.
Money numbers in a number of major EM countries outside of Asia are picking up. In Brazil, inflation has fallen and there should soon be some scope for central bank easing (after pausing hikes at 13.75% last September). However, we are cautious of the impact of weakening commodities and political risk. In mid-January President Luiz Inácio Lula da Silva gave a TV interview where he stated that the formal independence of the central bank (enshrined into law in 2021) was “nonsense”. This was likely retaliation to comments from central bank governor Robert Neto that a spending boom by Lula’s government posed an inflationary risk. Tempering this political risk is a divided and right-leaning Brazilian Congress which should force Lula to moderate.
Can the EM bounce be sustained?
While 2022 was a painful year for EM equities (following a disappointing decade), the outlook is increasingly positive as a number of headwinds abate.
Inflation – superior monetary policy and greater fiscal discipline in EM is the foundation for falling inflation, which opens the door to policy easing as the Federal Reserve approaches the end of its tightening cycle.
Economic growth – global economic weakness remains a headwind. However, EM is forecast to outpace growth in the West, led by China reopening. GDP in EM economies is expected to grow by 3 ppts more than the rate in the U.S. over 2023 and 2024, versus even in 2022 (Morgan Stanley).
Earnings momentum – the relative profitability gap between EM and DM is set to close, as companies benefit from the end of an extended deleveraging cycle and the recent period of global monetary tightening. On the other hand, profit margins in the U.S. sit at all-time record levels, a significant hurdle in the face of higher labour and other input costs.
Valuations – attractive relative to history and to DM, with positioning in EM equities among global allocators currently at depressed levels (Copley Fund Research).
Dollar – the dollar slumping into year-end 2022 was a tailwind for EM, but we are sceptical that the slide will continue at this rate in the near-term. Positive catalysts for a weaker dollar will include inflation continuing to fall, thereby increasing the odds of a Fed pause, and improving EM growth relative to DM.
China rally – is it time for a breather?
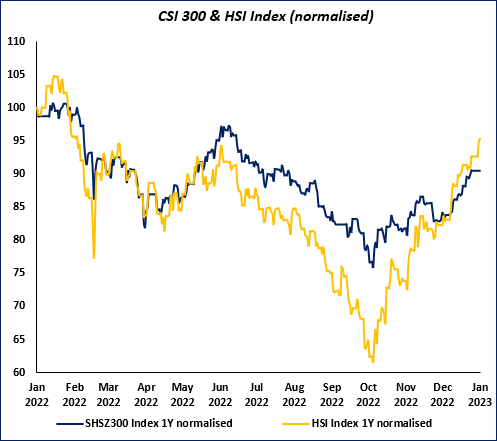
Chinese equities have run up a long away over the last two months following Xi’s pivot to more pragmatic policy on COVID, property, tech regulation and foreign relations. Abandoned by foreign investors earlier in 2022, H-shares rallied hard while A-shares lagged.
Source: Bloomberg
Source: Bloomberg
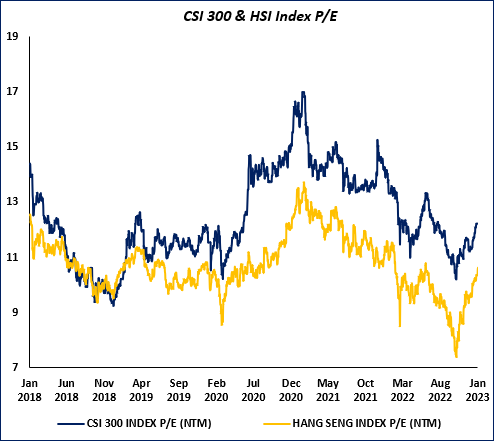
Valuations across Chinese equities remain supportive, although our view is that the “reopening trade” is now largely reflected in valuations. From here we see support for continued outperformance by Chinese stocks on an economic growth and corporate earnings recovery, along with positive money numbers. Consumption data over the Chinese New Year period were generally better than expected, with retail sales, passenger trip volumes, domestic tourism, box offices sales and restaurant sales up significantly and in many cases exceeding pre-COVID numbers.
That said, we do not expect a repeat of the reopening boom (in markets and the economy) that took place in the West when lockdowns ended. In the U.S. and Europe there were huge excess money balances and pent-up demand, to a far greater degree than what we currently see in China. On the latter, China was not subject to countrywide lockdowns, instead, harsh restrictions were applied on a regional basis to stamp out spikes in case numbers. In addition, the PBoC appears to be far less expansionary than Western counterparts, wary of setting off a wave of inflation as a result of pumping too much monetary stimulus. The weakness in the Chinese property market will also weigh on recovery as a negative wealth effect will hit consumer sentiment. Markets will be watching for additional government support to quash lingering structural risks in the sector.
Adani to test “India Inc.”
U.S. short-seller Hindenburg released a damaging short report claiming that giant Indian conglomerate Adani Group (with businesses across healthcare, energy, food and infrastructure) has been involved in “brazen stock manipulation and accounting fraud over decades.” The report argues that the group operated an elaborate web of shell companies across numerous tax havens, which were used as instruments to inflate Adani stock which in turn would be pledged as collateral for loans and thus placed the group on a “precarious financial footing”.
Hindenburg alleges the fraud enabled founder and Chairman Gautam Adani – who rose to prominence in Gujarat at the same time Prime Minister Narendra Modi was the state’s chief minister – to amass a personal fortune of over US$120 billion. Much of the wealth is owing to an 800% appreciation in stock prices across the Group’s seven listed companies over the last three years.
The release of the short report and subsequent collapse of Adani Enterprises’ stock has scuttled plans to raise over US$2 billion via a follow on public offer. Attention now turns to the Modi government and the Securities and Exchange Board of India to investigate any wrongdoing. Given both the close ties between Modi and Gautam Adani, and a business that lies at the heart of India’s economy, this will be an important test of institutional credibility.
We have written to clients extensively on India’s steady progress up the development ladder and opportunity this presents to investors. How authorities deal with this situation will provide an indicator of this progress – they will have to catch up to the local investment industry which has viewed Adani with suspicion for years. Hindenburg notes in its report that despite the Adani Group’s size, there is a dearth of reputable sell-side coverage on the companies, and no local active funds willing to hold these stocks in any meaningful size. We will watch on with interest to see how the government and the SEBI engage with the accusations – and hope for a tough response should they hold water.
We are sanguine with respect to the potential for systemic fallout in India should Adani collapse. India’s state banks would bear the brunt, however, it is likely that the viability of projects tied to Adani loans should cushion the blow. Indeed, should the market narrative around India’s rise lose some sheen in the coming months, we may see some emerging opportunities to add exposure to some names that we believe are long-term winners.
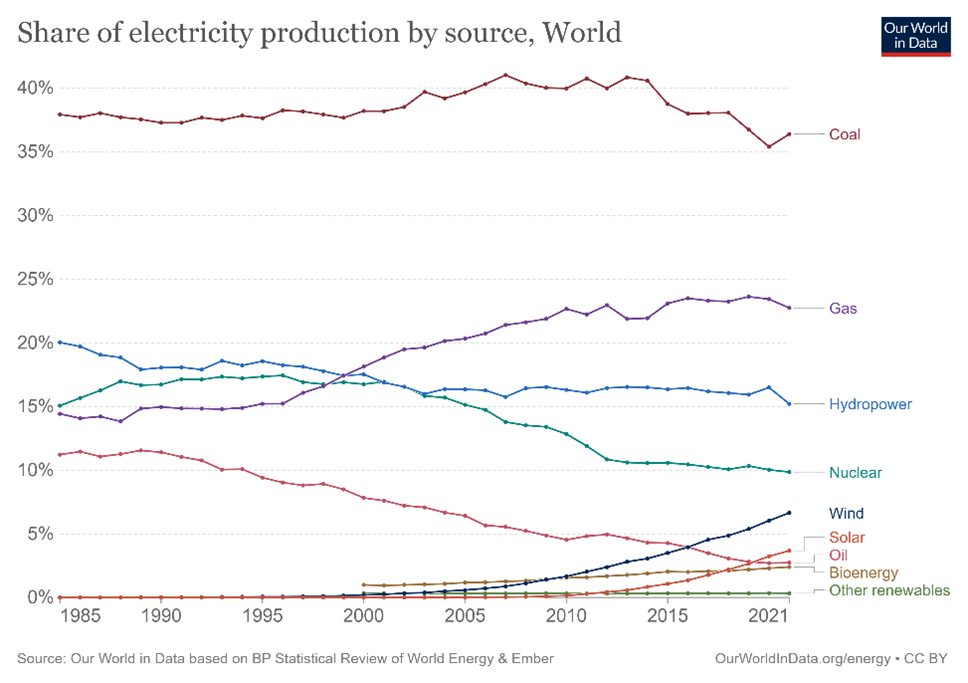
Nuclear power is a low-carbon, reliable source of energy. Yet, over the past decade, it has struggled to play a strong role in energy transition. Nuclear power generation has been around since the 1960s, and saw massive growth from the 1970s to 1990s. Since then, however, its share of global electricity production has declined from 17% in the 1990s to the current 10%, largely due to safety concerns following the tragic accidents in Chernobyl in 1986 and Fukushima in 2011.
Today, nuclear energy’s role in the energy system varies by country. In 2021, for example, nuclear accounted for 69% of total domestic electricity generation in France, 51% in Belgium, 28% in South Korea, 20% in the United States, 12% in Germany, 7% in Japan, and 5% in China.
Amid the global energy crisis following the war in Ukraine, many nations have prioritized efforts to reduce their reliance on imported fossil fuels. Add the backdrop of the global climate crisis, and the search for other sources takes on increased importance. Renewable energy sources have experienced remarkable growth in recent years, yet renewables alone are not sufficient to fully decarbonize the energy grid. This opens the door to an increased role for nuclear power.
According to the International Energy Agency (IEA), global nuclear capacity needs to expand by about 10 gigawatts (GW) per year to be on track with the Net Zero Emissions by 2050 Scenario. In 2022, nuclear energy had an operational capacity of 413 GW in 32 countries, thereby helping reduce reliance on fossil fuels while also avoiding 1.5 gigatonnes (Gt) of global emissions and 180 billion cubic metres of global gas demand a year. Emerging countries accounted for almost all new nuclear capacity added in recent years, while developed economies are catching up.
The UK currently has 5.88 GW of nuclear capacity, accounting for 15.5% of energy generated in 2022. It has set a goal to reach 24 GW by 2050, about 25% of UK’s predicted energy demand.
In the U.S., meanwhile, nuclear energy has consistently provided about 20% of total electricity generated over the past 30 years, and that country’s 93 operating nuclear reactors had a combined capacity of 95 GW at the end of 2021. However, as most of the American nuclear plants are approaching their 40-year design life, capacity will need to be extended or added to achieve the 2050 net zero goal.
Before the Fukushima disaster, Japan sourced about a third of its electricity from 54 nuclear reactors, but only nine are still operational. Following the war in Ukraine and the subsequent energy crisis, Japanese citizens’ sentiment toward nuclear reactors has shifted positively. In December 2022, the Japanese government announced a new nuclear energy policy aimed at maximizing the use of existing nuclear power plants and building next-generation reactors. Nuclear currently accounts for 7% of total power generation in Japan, and their goal is to increase the percentage to 20-22% by 2030. But getting there will require about 26 to 33 operational nuclear reactors.
Two major barriers hindering the growth of nuclear power are safety concerns, and elevated construction and operating costs. However, advancing technologies can help to overcome those barriers. Small Modular Reactor (SMR), for example, can be made in factories and installed on site, reducing both initial costs and construction times. The smaller size also makes economic sense for small electric grids. It is also believed to have enhanced safety characteristics.
Most recently, scientists have achieved a breakthrough by successfully producing a nuclear fusion reaction resulting in a net energy gain, instead of just breaking even as past experiments have done. Nuclear fusion provides carbon-free energy, without the highly radioactive, long lived nuclear waste created by current nuclear reactors. The process is inherently safe as fusion is a self-limiting process, the reaction could come to a halt within seconds. However, it will take years if not decades before fusion can meaningfully contribute to energy transition. The next step is to figure out how to produce more energy from nuclear fusion on a much larger scale, and at a lower cost.
Global Alpha has some holdings in the nuclear power sector that we believe offer good investment value.
For example:
Curtiss-Wright (CW US) supports the global nuclear power industry by providing precision components and highly engineered products and services. The company has an installed base of products at all nuclear plants operating in the U.S., and many operating internationally. Curtiss-Wright designed the world’s most advanced reactor coolant pump for Westinghouse’s AP1000 reactor, one of the safest and most economical nuclear plant designs available worldwide and has been approved or planned at many nuclear plant projects globally, notably in China, India, U.S., and UK. Curtiss-Wright also works with SMR and Advanced Reactors designers to ensure its presence in the future growth of this market. It has the opportunity to secure $10 million to $100 million in content per location.
Horiba (6856 JP) manufactures measurement equipment, specializing in the analytics and measurement of small particles in the field of environment, health, safety, and energy. Among its extensive product lineups, Horiba offers a wide range of measuring instruments and sensors to measure the pH of secondary water in nuclear power plants. For example, measurement of silica is paramount in preventing the problem of scaling, which reduces the efficiency of power generation. Horiba provides silica analyzers to allow for quick and automatic measurement for boiler water, and trace amount of silica present in pure water.
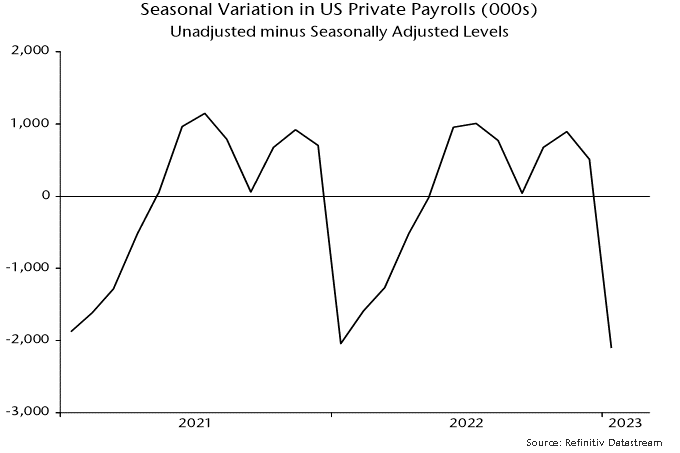
The unusually high level of job openings may be affecting the seasonality of US labour market data. An accurate read on the non-seasonal employment trend may not be possible until the spring.
The normal seasonality of US private payrolls is captured by the difference between BLS unadjusted and seasonally adjusted stock series, shown in chart 1. The seasonal effect is roughly neutral in September, rises to a peak in November, turns substantially negative in January and recovers back to neutral in May.
Chart 1
The normal pattern of employers shedding jobs on a large scale in January but rehiring into the spring / summer could change when the labour market is unusually tight, as currently. Firms may prefer to hold onto workers as seasonal activity slackens, anticipating difficulties refilling jobs later in the year. Laid-off employees may find alternative work more rapidly than in a normal year.
A change of behaviour may explain the blockbuster January payrolls rise, i.e. the seasonal adjustment may have significantly overestimated the seasonal drop in employment this year.
An alternative approach to assessing the underlying jobs trend is to compare months when the seasonal effect is neutral. As noted, September and May are neutral months, while seasonal deviations are significant over October-April. The average change in unadjusted payrolls over September-May should be an undistorted measure of employment growth.
If the suggestion of a seasonal distortion is correct, headline payrolls growth numbers for February-May could understate the underlying trend, compensating for January’s (possible) overstatement.
Suppose, for illustration, that monthly growth in unadjusted payrolls turns out to average 150,000 between the two seasonally neutral months of September 2022 and May 2023. (This equates to an annualised growth rate of 1.4%, in line with the reported expansion of the labour force in the year to January, i.e. the assumption is consistent with a stable unemployment rate.)
Such growth would imply a payrolls level of 132,686,000 in May 2023, with no significant seasonal element. This compares with a currently reported seasonally adjusted level of 132,684,000 for January. The headline payrolls measure, on these assumptions, would show negligible growth over February-May.
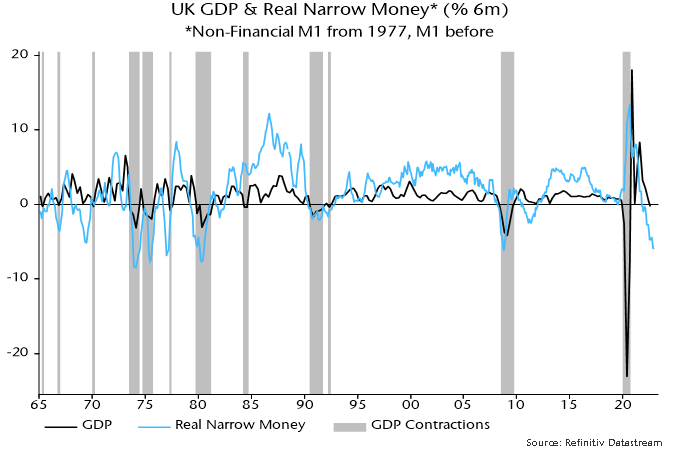
The consensus is gloomy about UK economic prospects but is it gloomy enough?
The current debate has echoes of mid-2008. Q2 2008 was the first quarter of the most severe post-war recession. The consensus that summer was that the economy would eke out growth with a limited rise in unemployment and no need for significant policy easing.
A recession is widely acknowledged / expected now but the majority view is that it will be shallow and short-lived, partly reflecting recent energy price relief. Labour market damage is projected to be modest and there is general approval of recent MPC policy tightening.
Monetary trends warned of worse-than-expected outcomes in 2008 and are giving an equally negative message now.
The six-month rate of contraction of real narrow money (i.e. non-financial M1 deflated by consumer prices) was unchanged at 5.9% (not annualised) in December, close to a 6.1% peak reached in October 2008 – see chart 1.
Chart 1
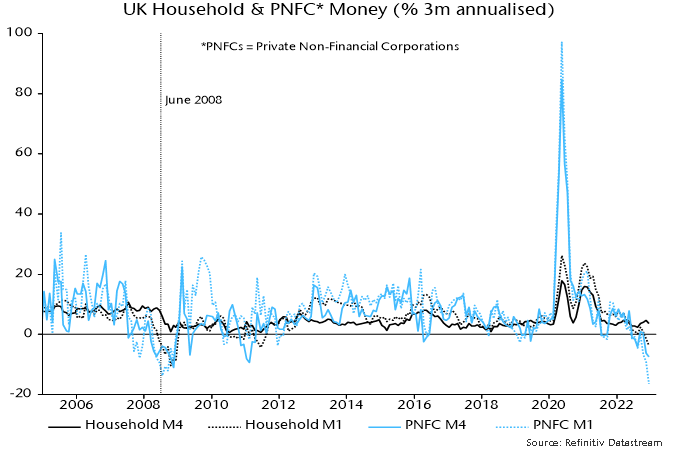
As in 2008, the real money squeeze reflects both high inflation and nominal money weakness. Sectoral nominal money trends are uncannily similar to mid-2008. Corporate M1 and M4 are contracting rapidly, consistent with a sharp fall in profits and suggesting cuts in employment and investment – chart 2.
Chart 2
Household M4 is still growing modestly but there has been a large-scale switch out of sight into time deposits in response to rising rates – a classic signal of a shift in consumer behaviour from spending to saving.
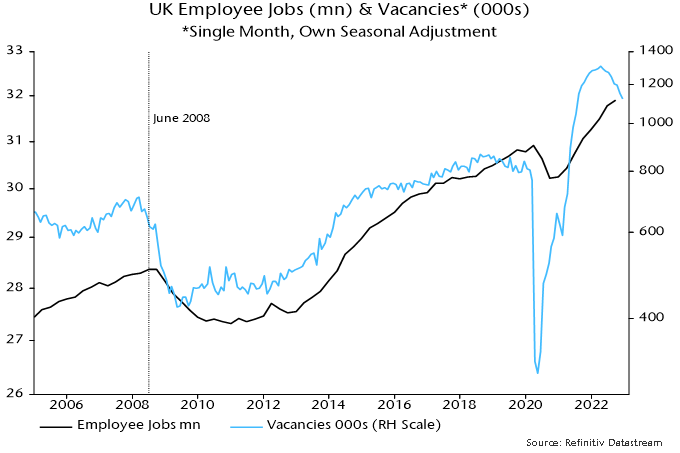
A continued rise in employee numbers in recent months has fed a narrative of labour market “resilience” that is expected to persist. Data and complacency were similar in mid-2008. The quarterly employee jobs series rose into Q3 2008 but the stock of vacancies in June was already down by 9% from its peak, warning of trouble ahead – chart 3. The level of vacancies is higher now but the fall from the peak has been larger, at 14%.
Chart 3
Eurozone flash PMIs this week were less bad than expected, bolstering a growing consensus that economic prospects are improving. Monetary trends continue to argue the opposite.
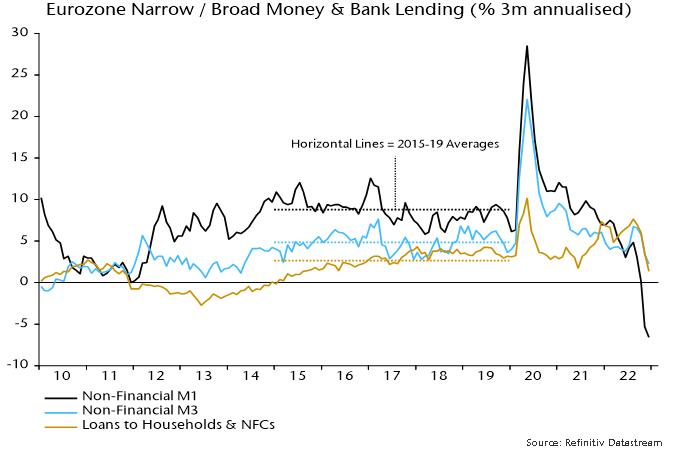
The preferred narrow money measure here – non-financial M1 – fell for a fourth consecutive month in December in nominal terms. Bank lending also contracted on the month, while the broad non-financial M3 measure grew by just 0.1%.
The three-month rate of contraction in narrow money is a record in data back to 1970. Three-month growth of non-financial M3 is down to 2.3% annualised, less than half its 2015-19 average. Bank loan growth is also now below its corresponding average – see chart 1.
Chart 1
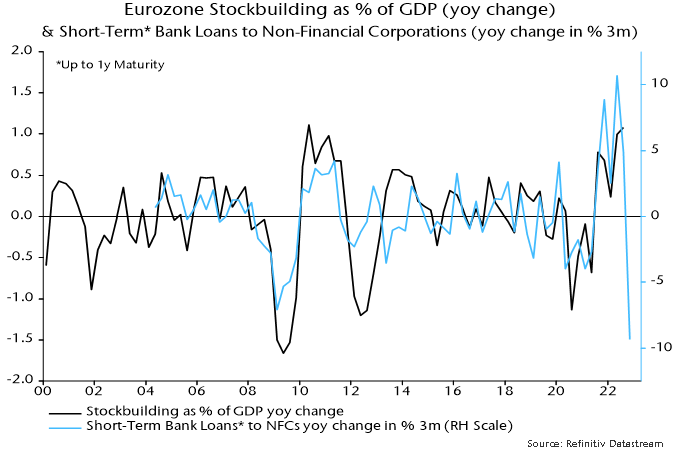
Bank lending weakness is being driven by repayment of short-term corporate loans, consistent with a violent downswing in the stockbuilding cycle – chart 2.
Chart 2
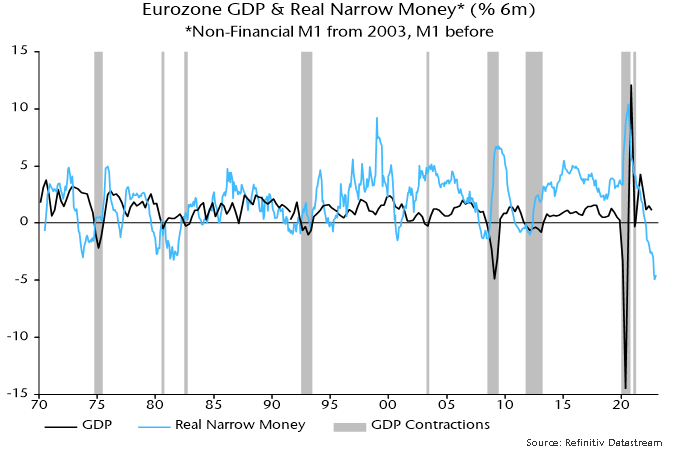
The six-month rate of decline of real narrow money was little changed from November’s record despite a sharp drop in six-month CPI momentum – chart 3.
Chart 3
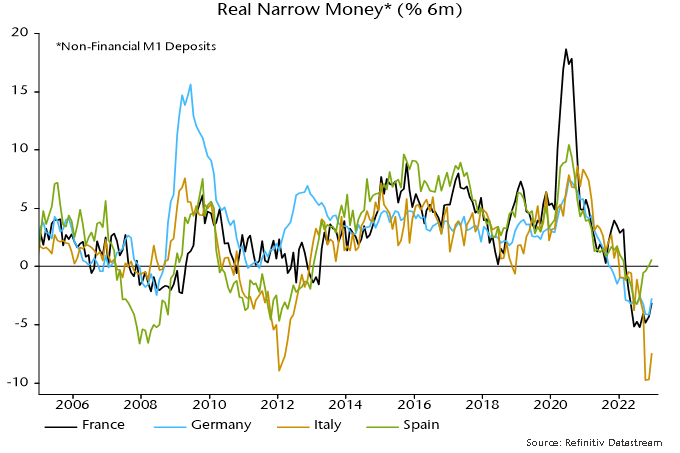
The rate of contraction of real M1 deposits remains fastest in Italy, reflecting both weaker nominal money trends and higher inflation. Spanish positive divergence is mainly due to a much sharper recent CPI slowdown.
Chart 4
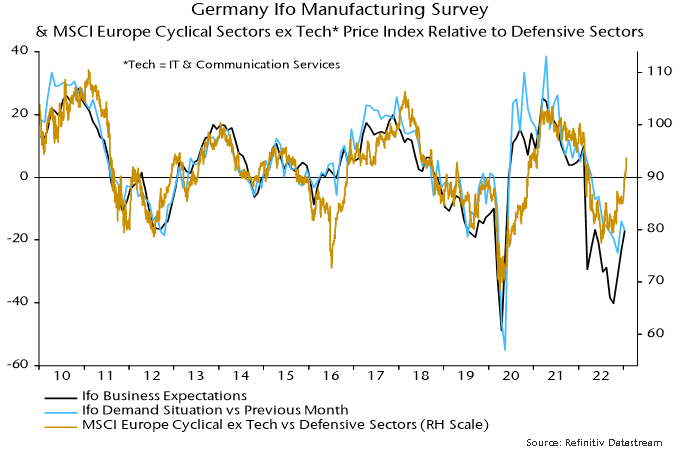
Echoing the better PMI news, German Ifo manufacturing expectations rose for a third month in January. The new demand index, however, has recovered by less and fell back this month – chart 5. European cyclical equity market sectors have outperformed on soft landing hopes and are vulnerable if business surveys now stall, as suggested by monetary trends.
Chart 5
A post in October gave a hopeful view of Chinese prospects, noting that “excess” money had accumulated and could flow into equities and the economy if policy-makers signalled a commitment to expansion.
The consensus is now optimistic, believing that property market support measures and the removal of pandemic control restrictions will result in strong economic acceleration through 2023. Yet the latest money / credit data signal caution.
Globally, Chinese reopening is expected to be reflationary. Reopening, however, will release supply as well as demand. The former effect could dominate, resulting in additional downward pressure on Chinese export prices.
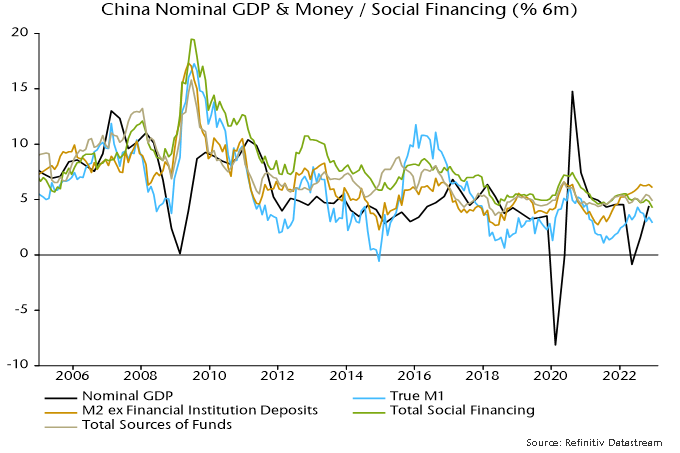
Six-month growth of true M1 peaked in July 2022, falling back to its March level in December – see chart 1. This suggests a slowing of underlying nominal GDP momentum from Q2. The levels of nominal and real narrow money growth are modest by historical standards.
Chart 1
Broad money trends are stronger, with six-month growth of the favoured measure here – M2 excluding deposits of non-bank financial institutions – ending 2022 near the top of its range in recent years. Money, however, needs to shift from time deposits into M1 to signal rising confidence and spending intentions.
Broad money growth may have been inflated by a switch out of wealth management products and other bank liabilities into deposits. The total stock of bank funding has been growing less strongly, with minimal acceleration since 2021 – chart 1.
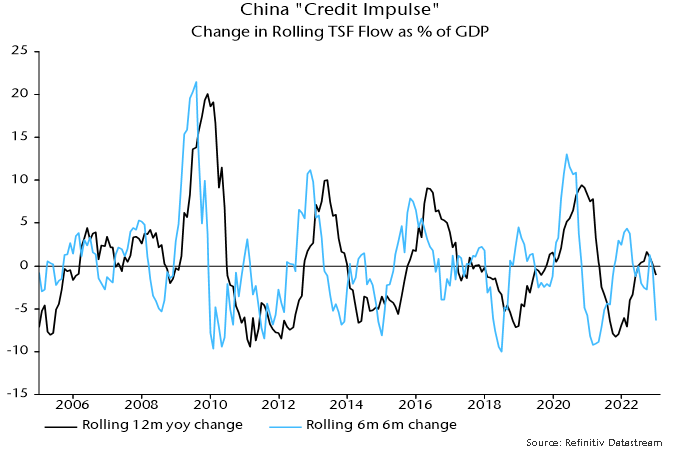
Many analysts follow the “credit impulse” – the rate of change of credit growth, usually expressed relative to GDP. This often gives the same message as narrow money trends (but is judged here to be less reliable) and also suggests a loss of economic momentum – chart 2.
Chart 2
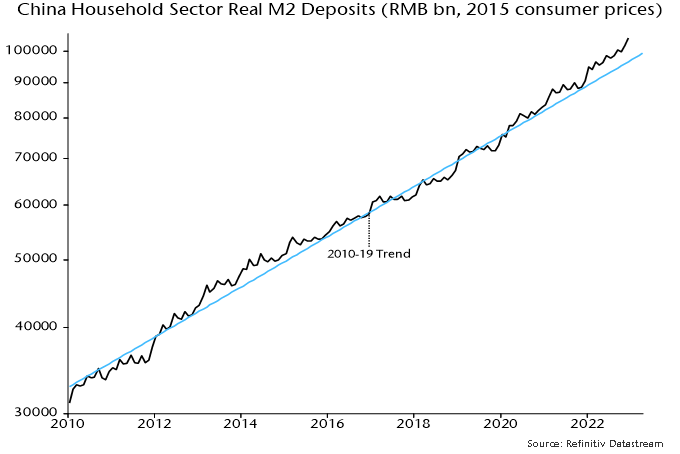
Bulls argue that excess household savings will fuel a consumption boom, drawing parallels with G7 experience following reopenings. Chinese households did not receive stimulus checks or direct wage support and the excess is likely to be considerably smaller, implying less pent-up demand.
Supporting this view, household real M2 deposits in December were 8% above their pre-pandemic trend (and may have been inflated by the early timing of the Chinese New Year) – chart 3. US household real M3 holdings reached a peak 24% overshoot of the comparable trend in March 2021 – chart 4.
Chart 3
Chart 4
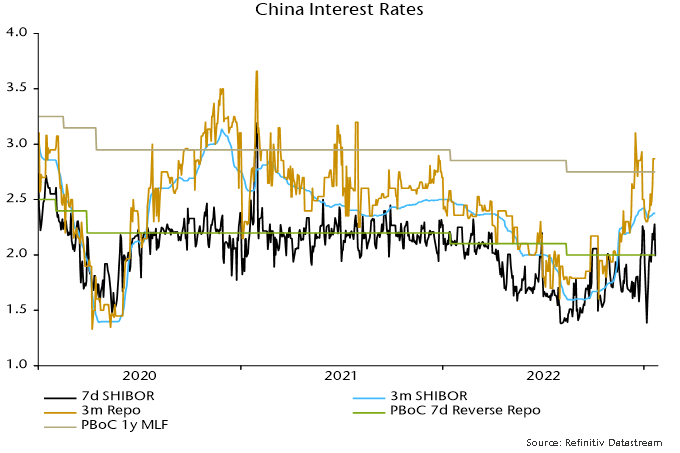
Fed policy remained expansionary as pandemic drags faded. The PBoC, by contrast, appears concerned about inflationary risks from rapid reopening and has engineered or at least tolerated a significant rise in term money rates. The increase in late 2022 was universally dismissed by China specialists as a year-end phenomenon unrelated to any policy shift but a minor fall in early January has since given way to another rise – chart 5.
Chart 5
The view here is that the reopening boost to domestic demand will be modest and biased towards services. For goods, supply expansion due to reduced disruption may outweigh the lift to demand.
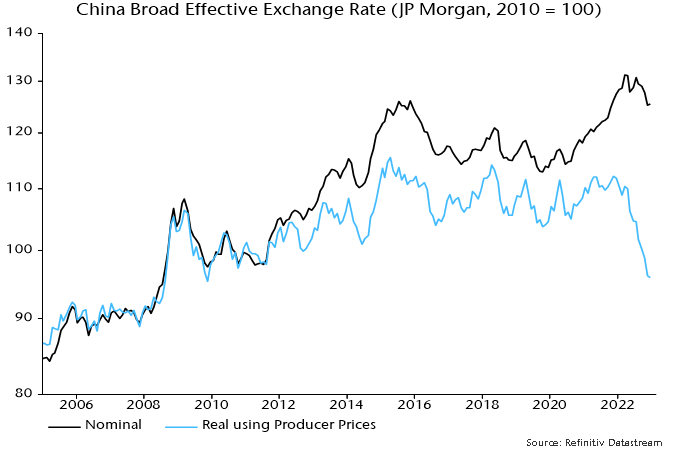
Global trade moved into contraction in late 2022, partly reflecting an accelerating downswing in the global stockbuilding cycle. With supply constraints easing, Chinese exporters are likely to cut prices to increase market share, especially given the super-competitive level of the RMB – chart 6.
Chart 6
The story of Little Red Riding Hood is perhaps the most implausible of all the pre-17th century European folk tales. Just how – a rational mind may presume – does a little girl mistake a ravenous wolf for her own grandmother? Like many such fables, the beauty in the Grimm brothers’ work lies in the extraction of rich metaphorical meaning from absurdity. Timeless lessons that have a habit, for those paying attention, of occasionally popping up in unexpected areas of our lives like a sagacious Whac-a-Mole. While Little Red Riding Hood is hardly a fulsome guide to investing, her ill-fated demise due to a case of mis-identity may still offer a lesson for investors.
As fundamental equity investors, it is critical that our decisions stem from objective reasoning. Spending each day striving to achieve the clarity of thought that comes with truly unbiased, matter-of-fact thinking, honed by experience and devoid of prejudice, is key not only to our long-term success but also in upholding the fiduciary duty to our clients.
It is why our philosophy centres on two simple ideas: invest with conviction and act with humility. The guiding principles behind each of our decisions that help us uncover wolves concealed amongst even our highest conviction ideas, and prevents deception from the seemingly familiar becoming – ironically – all too familiar.
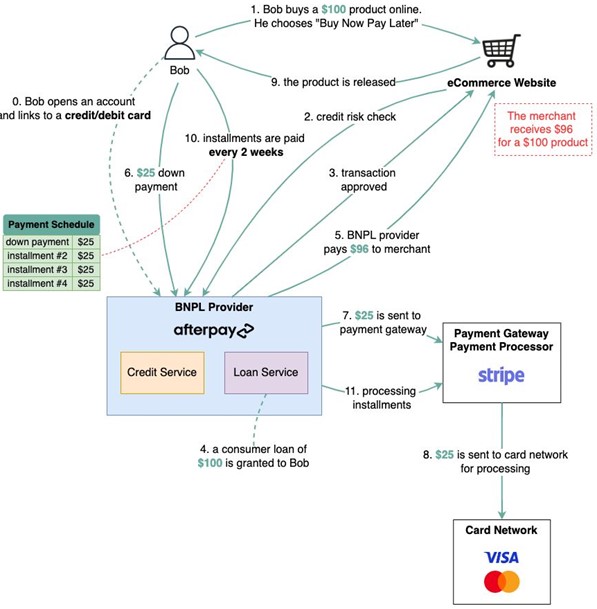
Buy-now-pay-later (BNPL) is one concept that we believe can be particularly deceptive. To the unassuming consumer, BNPL is wonderfully ingenious. Credit risk for your transaction is shouldered by the merchant from whom you purchase. It looks, smells and tastes like free money. Only alas! On closer inspection we find that BNPL is in fact just a craftily marketed, dolled up version of the same age-old credit process. Soft pastel colours and smiling millennials may have replaced images of burly debt collectors demanding pounds of flesh, but the core underlying credit agreement between consumer and lender remains unchanged. Missed payments will still result in the same letters in the post, demanding the same penalizing late fees. And opening them will still provoke the same sense of incredulity as you jump up and shout, “Oh my! I didn’t realise what big teeth you have!”
Contextualising BNPL as a branch of consumer credit is a prerequisite to appreciating its value. The ongoing arms race between technology giants Grab, GoTo and Sea Ltd over Southeast Asia’s 120 million Indonesian labour force participants who do not own a credit card is the archetype of the modern fintech battle that we see across many of our markets. There are millions of people in Egypt, Vietnam, Philippines, Nigeria, Kenya and Bangladesh without access to consumer credit, but poor pre-existing infrastructure makes it difficult for highly focused credit products such as BNPL to gain traction.[1] Here, the spoils of war will not be won on credit alone. Funding gaps of such depth and complexity must instead be addressed by a broad arsenal of fintech services including digital banking, cashless payments, credit reporting and cross-border transactions.
Alibaba’s Alipay is arguably the best example to-date, and its success in China has created a blueprint for many platform businesses within our markets. A collection of fledgling financial Megazords working to refine the configuration of their autonomous product constructs. For many it remains a work-in-progress. However, there are exceptional cases that indicate some may have found a winning formula.
Nestled away in a market of just 19 million people, Kaspi.kz has built a formidable application that boasts a user base comprising over 95% of the adult population of Kazakhstan. What originated as a humble Tier 2 bank has emerged over the last decade as the largest payment network, e-commerce platform and consumer finance business in the country.[2] Today, Kaspi.kz processes more transactions in Kazakhstan – where over two thirds of all transactions are cashless – than Visa and MasterCard combined.[3] Online purchases through the 260,000 active merchants on the platform account for over 70% of the entire e-commerce market.[4] And in 2021 they distributed over twice the amount of consumer loans compared to the largest and most systemically important bank in the country. In short, Kaspi.kz is not just a part of the fintech revolution in Kazakhstan. It is the revolution.
Figure 2: Kaspi.kz has multiple payments, e-commerce and credit products within a single application
Source: Kaspi.kz
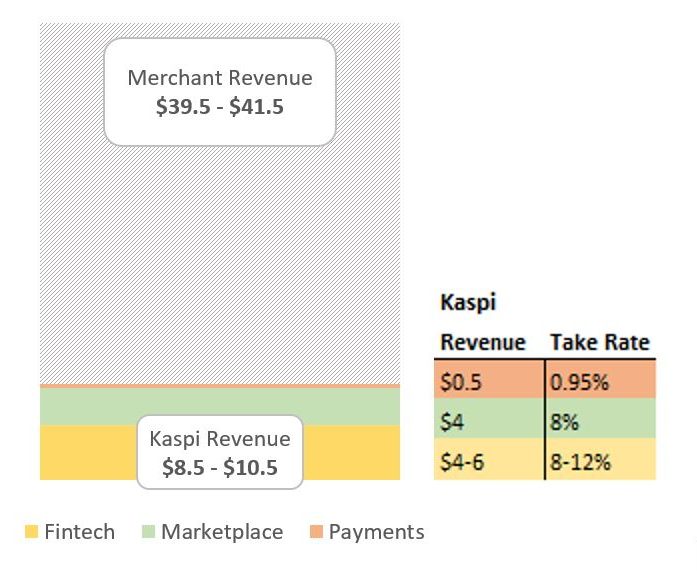
Indeed, outside of China, one would be hard pressed to find a company that has a firmer grip on the consumer spending journey than Kaspi.kz enjoys in Kazakhstan. In providing a place to purchase, a method to purchase and the means to fund that purchase, Kaspi.kz owns every commercial touchpoint of the transactions through its platform, thereby gaining access to the maximum profit pool of each consumer. Consider someone making a US$50 online purchase, funded through a three-month, 0% interest BNPL product. That single transaction has three revenue channels for Kaspi.kz, equating to between US$8.5 and US$10.5 in revenue. That is a whopping 17-21% of the overall transaction value.[5]
Figure 3: Revenue distribution for $50 e-commerce transaction funded through 3month BNPL
Sources: Kaspi.kz; Vergent Asset Management
The roots of success are often multifaceted, and Kaspi.kz is no exception. No doubt there are traces of the Matthew Effect, but equally we see attempts to deploy the same payments-marketplace-consumer finance trifecta in other markets as far inferior.[6] In our view, the triumph of Kaspi.kz in Kazakhstan is not as much in the business mix as it is in how those businesses are woven together. And in this case all yarns lead back to BNPL.
Figure 4: Kaspi.kz’s three businesses benefit from a strong network effect
Source: Kaspi.kz
Contrary to the traditional BNPL model of maximising standalone yields, Kaspi.kz utilizes BNPL as the engine room to drive the average transaction value (ATV) and volume of its users high enough to maximise the revenue of the entire platform. Incremental transactions generate proprietary data points on each user that pollinate other revenue generating areas of the business, whilst simultaneously diluting cost centres such as product development, sales and marketing, and risk management. That arms Kaspi.kz with new products and data to support more informed lending decisions, and thus the cycle repeats. Such is the potency of this lending model that through 2021— a period when the three global BNPL giants collectively burnt over US$1 billion of cash— Kaspi.kz’s standalone lending business generated a return on equity of over 45%.[7]
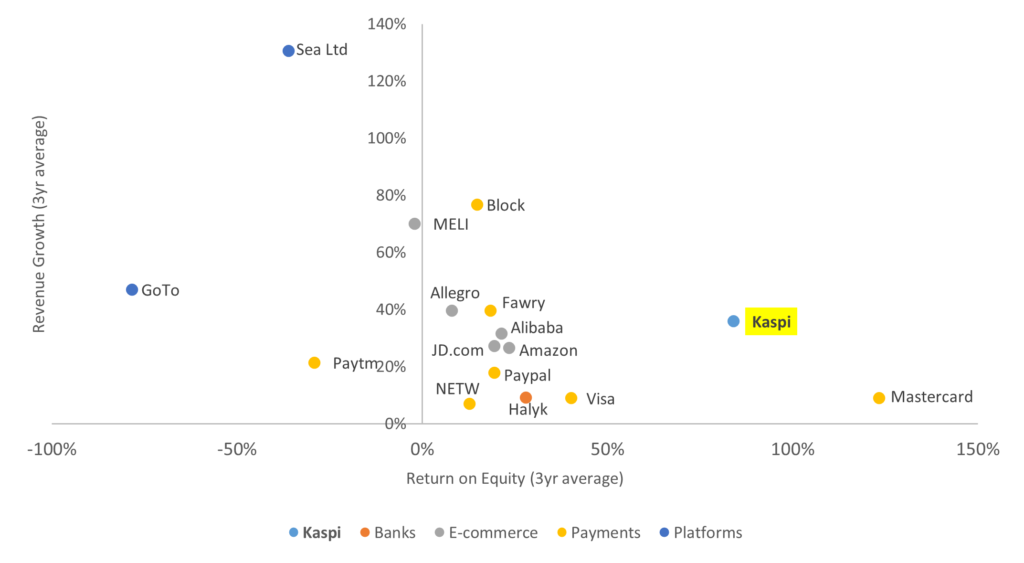
One of the most compelling upshots from this model is the impact on growth. Revenues magnified by intertwined, self-perpetuating products have a diluting effect on the cost base, sending operating leverage into overdrive. As a result, Kaspi.kz has managed to grow revenues at a 34% CAGR since 2019, despite spending on average just 4% of revenue on sales and marketing.[8] Even more astounding is that this growth was delivered at an average net margin of over 40%, for a combined growth and return profile that is best-in-class on an industry, regional and even global basis.
Figure 5: Revenue growth (three-year average) vs. return on equity (three-year average) for comparable peers
Sources: Bloomberg; Company Filings; Vergent Asset Management
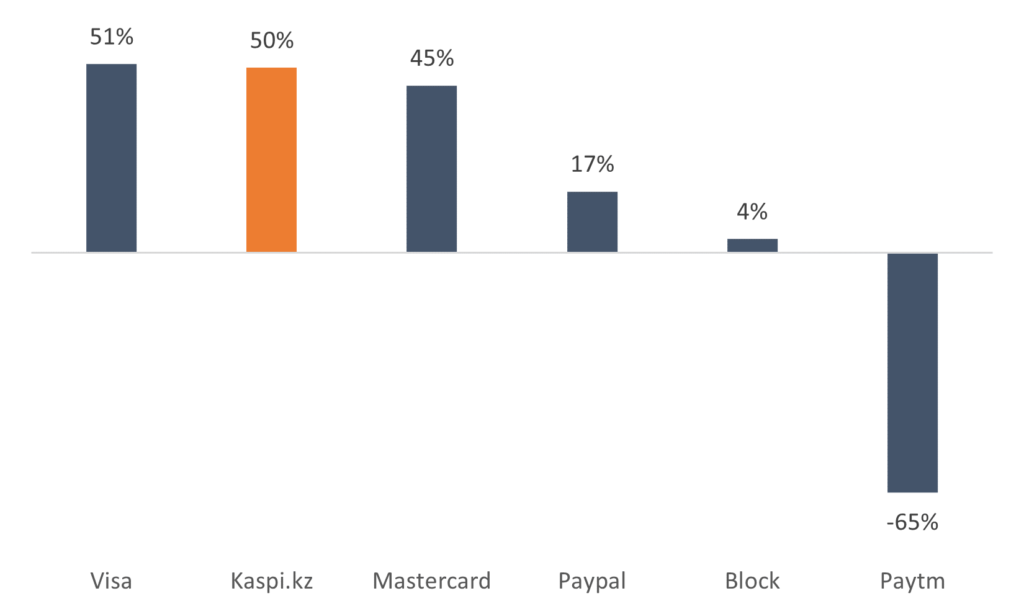
Consequently, Kaspi.kz enjoys the luxury of being able to subsidise strategic products profitably. In the marketplace business that means providing 95% of deliveries free of charge whilst still operating at over 60% net margin. Within payments, it means monetizing less than 10% of the peer-to-peer (P2P) transactions that constitute over 75% of total payments volume, thereby forgoing the lucrative interchange fee that typically represents the largest revenue line for digital banks, including Monzo and Revolut, as the cost of customer acquisition. That Kaspi.kz’s standalone payments business can still deliver net margins comparable to the largest and most successful global payments companies, despite surrendering these fees and operating in a market a fraction of the size, speaks to the harmony of its consolidated platform.
Figure 6: Net income margins of payments peers (three-year average to last reported period)
Source: Bloomberg; Kaspi.kz Data shown for Kaspi.kz is the standalone payments business
The term super-app is overused and, in our view, frequently misunderstood. Sifting through investment decks of the not-so-super, the moderately-super or even the one-day-we-are-sure-to-be-super apps that flood our markets can at times feel like dragging a philistine through a modern art exhibition. No matter how fervent the arguments may be that the blue square in front of you is a masterpiece – a unique perspective on modernism – to the untrained eye it all looks rather the same. When we suggest that Kaspi.kz is emerging as one of the few genuine super-apps it is not because the platform tells the same exhausted story of having multiple products under one roof. Strength here is not in numbers: It is in the intricate design of each product such that the sum of all products is greater than the parts.
Critically, the platform must have ‘plug and play’ compatibility with new products. Acting as a magnet for new services that yearn for an adrenaline shot of growth is vital for keeping the platform sharp, competition blunt, and deepening the competitive moat of any aspiring super-app.
Take for example, Santufei, a negligible rail and airline ticketing vendor that comprised just a handful of people and a few basic aggregator relationships when Kaspi.kz acquired it in August 2020 for a paltry US$5 million. Today, that business (rebranded ‘Kaspi Travel’) sells over 70,000 tickets per month through what is now the largest rail and ticketing platform in the country. And travel tickets are just the start. There is a not-so-distant future where we foresee an office worker in Almaty ordering a taxi after a long day, getting home to receive promotions for their favourite takeaway, placing an order and then tipping the delivery driver all through Kaspi.kz. In this world, it is 3rd party developers that must bow as Kaspi.kz ascends to the gilded heights of consolidator. The gatekeeper to an ecosystem so rich that 3rd parties are forced to cede a slice of the economics, despite assuming all the business risk.
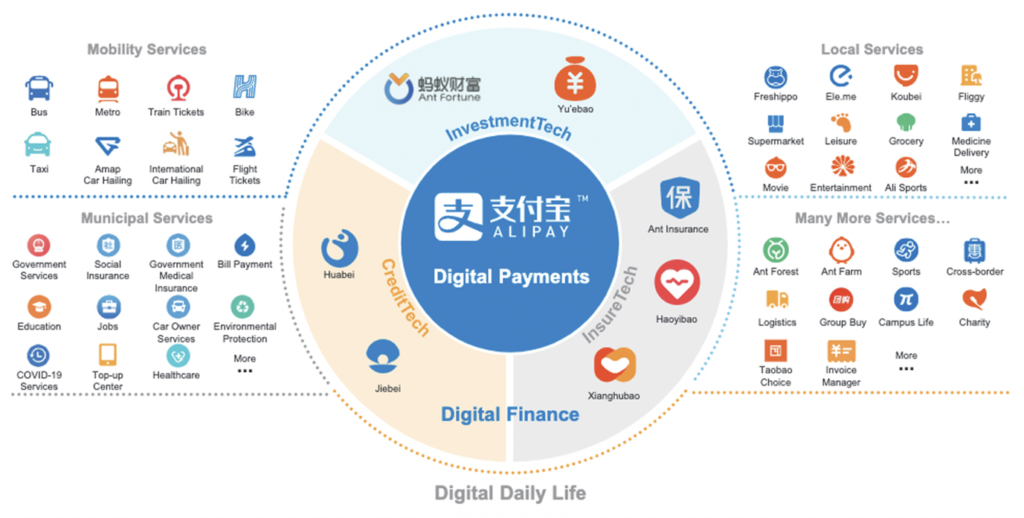
Platform compatibility is also relevant for the merchant base. Many services unbeknownst to consumers such as B2B payments, supply chain management solutions and merchant credit services offer equally attractive economic prospects, if not a means to entrench the platform deeper into the Kazakhstan economy than their consumer product counterparts. One only needs to look at the breadth of services offered through Alipay today to get a sense of how much more room there is for Kaspi.kz’s platform to grow.
Figure 7: Alipay offers insight into what the future Kaspi.kz platform may look like
Source: Alibaba; Vergent Asset Management
Although the example of Alipay offers a glimpse as to the end state for every aspiring super-app, we must remember that by no means does it reflect the sole operating model. Platforms with origins in payments will differ to those grown out of e-commerce, financial services, or one of the countless other services that can support the initial acquisition of customers. In our view, it is the understanding of this centrality that becomes essential in helping us see beyond a familiar and otherwise undifferentiated countenance.
So while Kaspi.kz will march on, continuing to forge new products against the idiosyncrasies of Kazakhstan, the near-term focus for us will remain firmly on BNPL. For today, that is the beating heart of the company’s ecosystem. The consumer credit juggernaut that in equal measures poses the greatest risks and opportunities to sustainable growth.[9] That we maintain our diligence, stay grounded in our approach and appreciate the consumer credit business for what it really is, will give us the best chance – we hope – of seeing Kaspi.kz write its own fairy tale ending.
[1] Based on ~139 million labour force and ~17 million credit cards in circulation. Sources: World Bank; Bank of Indonesia.
[2] Grossly simplified, Kaspi.kz is probably best thought of as a combination of Revolut, Paypal and Taobao. A somewhat fitting unity of East and West.
[3] Source: Analysis of the payment market in the Republic of Kazakhstan, PWC (March 2022).
[4] Source: Analysis of the retail e-commerce market in the Republic of Kazakhstan, PWC (October 2022).
[5] Moreover, this example is conservative. BNPL products that exceed three-months draw interest from the consumer and higher take rates from merchants, while certain e-commerce categories also command higher take rates.
[6] Taken from the Gospel of Matthew and popularized as the Power Law, the Matthew Effect is based on the idea that market leaders will attain a disproportionate amount of value over time. For companies with large network effects, that typically means being first to market.
[7] The three global BNPL giants referenced here are Klarna, Affirm and Afterpay, which reported US$631 million, US$431 million and US$159 million FY21 net losses respectively.
[8] Calculated as three years to June 2022.
[9] Macroeconomic risks associated with Kazakhstan are also at large, and the exclusion here for simplicity should not be confused with insignificance.