Global monetary trends appear inconsistent with economic expansion and recent levels of financial asset prices. Central banks are likely to be forced to reconsider policy stances, by market / financial instability and / or unexpected economic weakness.
Key developments during Q3 included:
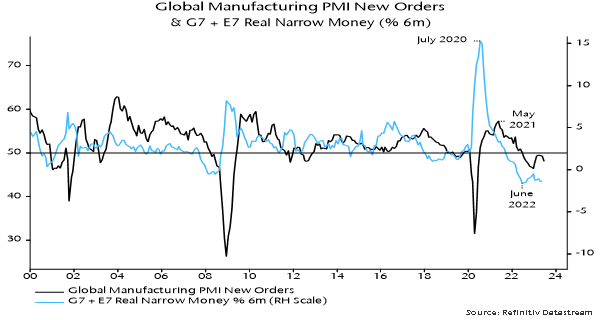
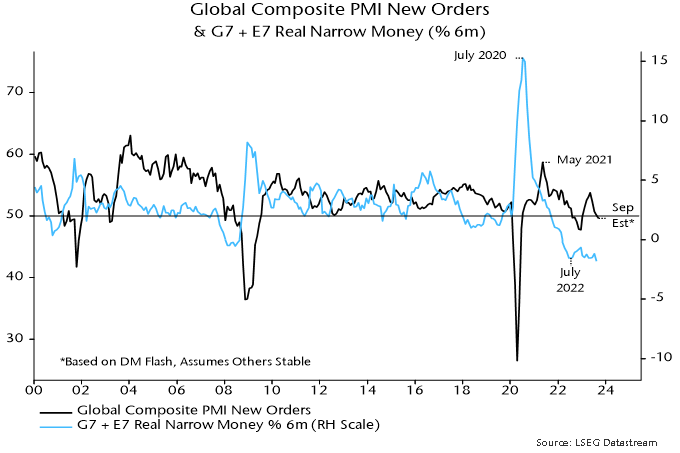
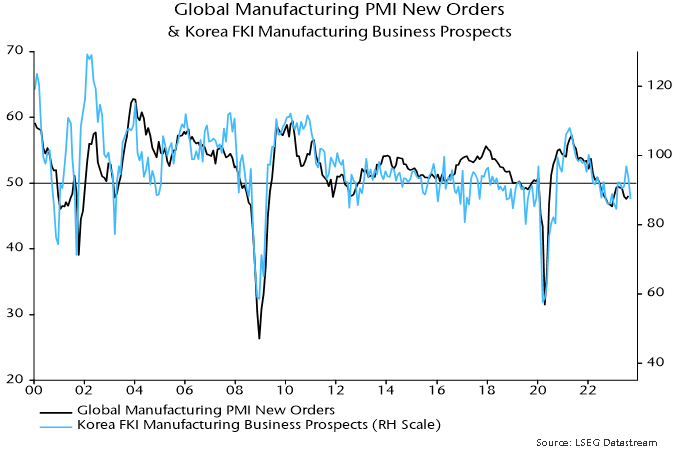
- Global composite PMI new orders – a timely indicator of economic momentum – extended a decline from a local peak in May.
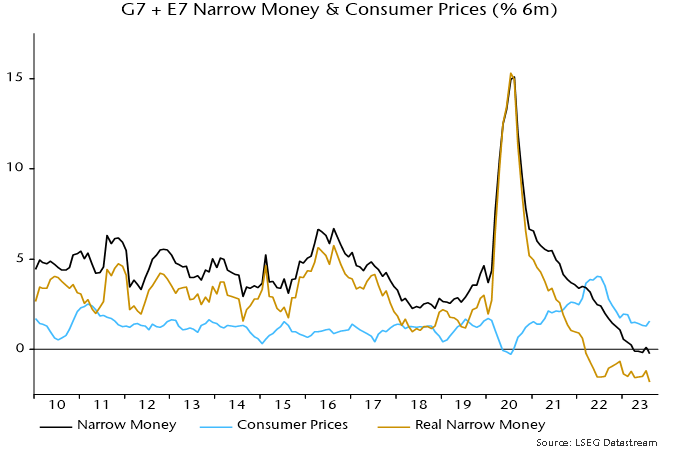
- Global six-month real narrow money momentum fell to a new low, suggesting a further PMI slide into early 2024 – see chart 1.
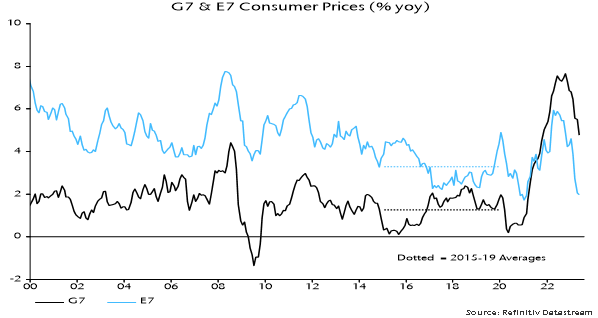
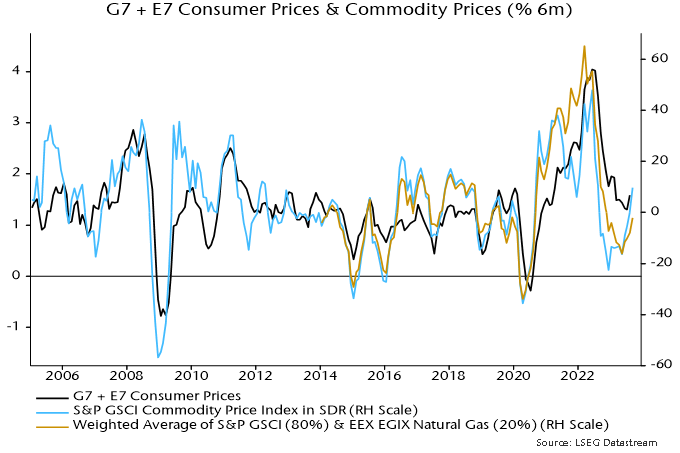
- Inflation news was favourable, with US and Eurozone core momentum slowing significantly.
- Major central banks ignored these developments, tightening policies further and signalling “higher for longer”.
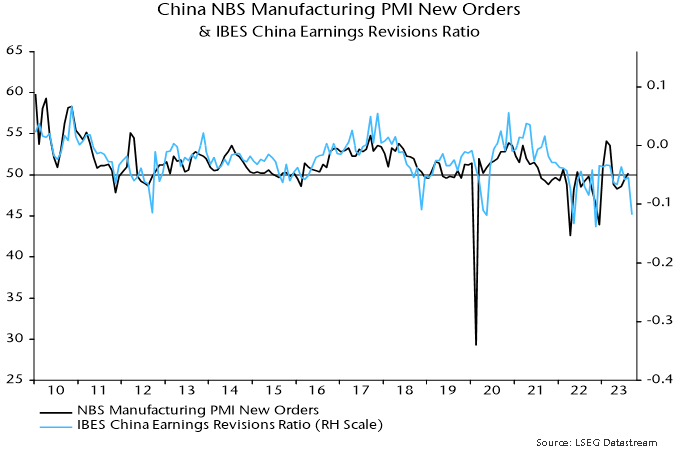
- Hopes that Chinese easing would act as a counterweight to G7 restriction were dashed by the PBoC allowing money rates to firm significantly into quarter-end, perhaps reflecting concern about capital outflows.
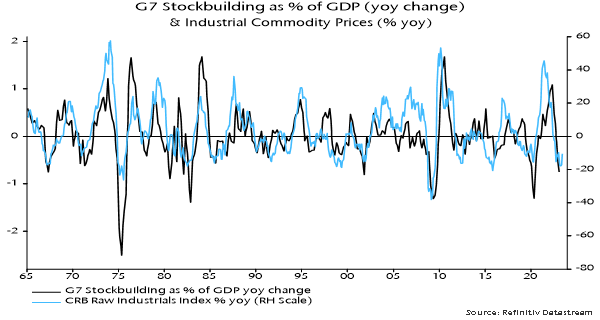
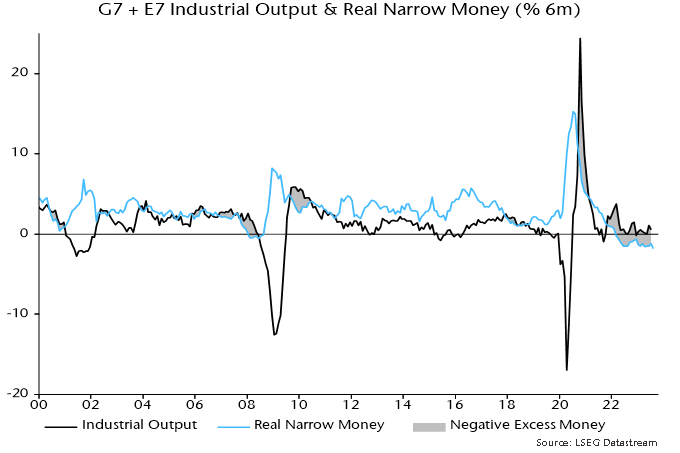
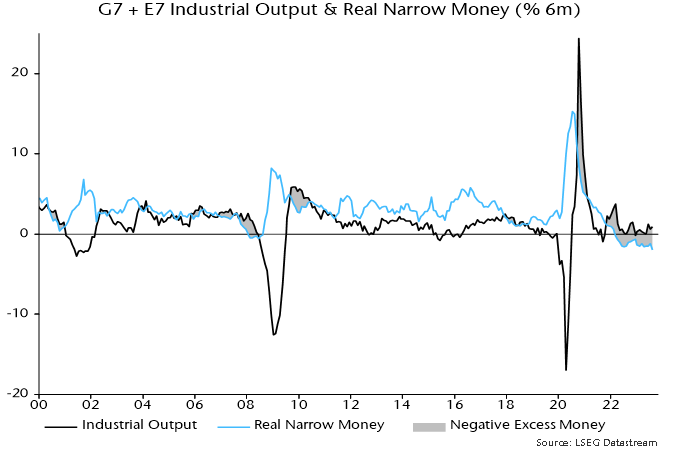
- Global “excess” money momentum, as measured by the differential between six-month rates of change of real narrow money and industrial output, became more negative – chart 2.
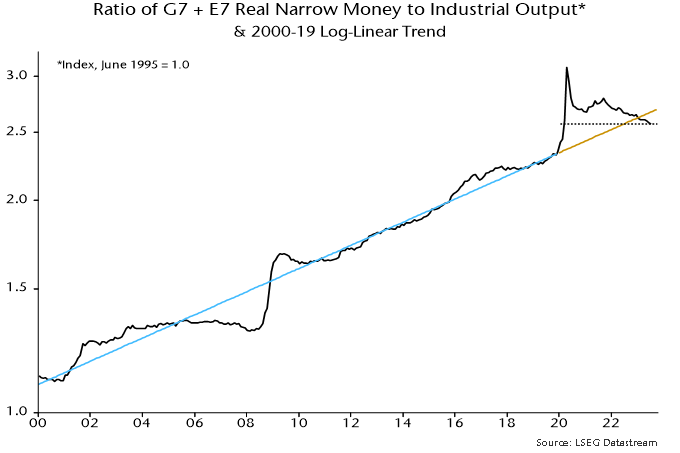
- The stock of excess money, i.e. the ratio of real narrow money to industrial output, fell to its lowest level since February 2020 before the covid policy response and associated monetary surge.
- US real Treasury yields extended a third major move higher since late 2021, interpreted here as reflecting the intensified excess money squeeze coupled with higher for longer guidance.
- Global equities gave back most of their Q2 gain as higher real yields dragged valuations lower.
- The yield surge contributed to underperformance of growth and non-US quality while restraining outperformance of defensive sectors.
Chart 1
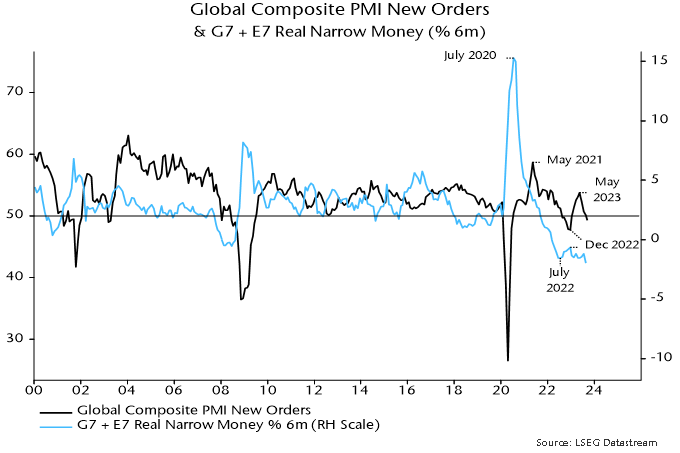
Chart 2
Current and prospective monetary trends appear too weak to support recent levels of economic activity and market wealth. Two scenarios for relieving the monetary shortage may be considered.
In the better scenario, a further fall in inflation coupled with modest weakness in activity results in global excess money contraction moderating into end-2023, with an associated reversal lower in real yields. (Equity market performance is related to the sign of the level of excess money momentum while yield movements are related to the sign of the rate of change.)
Inflation progress and softer labour market data prompt central banks to retract higher for longer guidance and cut rates in early 2024, extending the move lower in yields. Falling yields support growth and quality, limiting weakness in equity indices.
Lower rates revive nominal money momentum in H1 2024, laying the foundation for an economic recovery during H2. Inflation continues to fall as core / wage pressures fade, moving to an undershoot in late 2024 / 2025 in lagged reflection of monetary weakness in 2022 / 2023.
Equity markets recover during H1 2024 as excess money momentum turns positive. Near-term outperformance of defensive sectors reverses as improving economic prospects for late 2024 / 2025 lift cyclical areas.
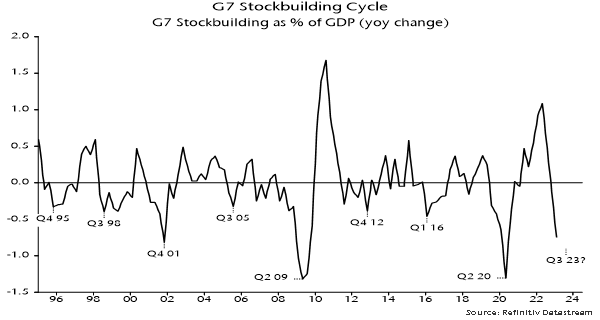
The suggestion in this scenario of modest / short-lived economic contraction is consistent with the cyclical analysis framework employed here: major downturns in the housing and business investment cycles are not expected before 2025, while the stockbuilding cycle is scheduled to recover in 2024.
In the worse scenario, recent policy tightening and surging yields result in a further fall in nominal money momentum, offsetting the impact of lower inflation and declining activity on real / excess trends.
Real yields are stickier and equity markets fall further, with defensive sectors outperforming significantly.
Intensified economic weakness and an ongoing monetary shortage trigger one or more credit “events”, raising financial stability concerns. Central banks cut rates but are viewed as having lost control. Investors price in a tail risk of excessive easing and another inflation surge later in the decade.
Inflation falls faster and further than in the better scenario, contributing to a larger eventual decline in rates and Treasury yields. The beneficial effect on monetary trends, however, is delayed by “endogenous” tightening via wider credit spreads and wealth losses.
The suggestion in this scenario of significant multi-quarter G7 recessions could be reconciled with the cycles framework by arguing that the rate shock advanced the housing cycle peak expected around 2025, i.e. the downswing will play out over 4-5 years rather than a more normal 2-3.
The subjective probabilities assigned here to the two scenarios will be adjusted in response to incoming nominal money data.
The further fall in global six-month real narrow money momentum in Q3 was mainly attributable to declines in China and India, confirming a need for PBoC easing and questioning consensus optimism about Indian economic prospects. Momentum remains weaker in Europe than the US – chart 3.
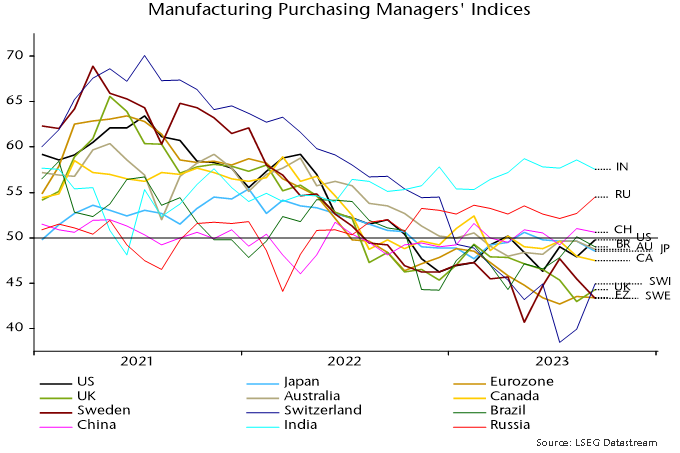
September manufacturing PMI results are broadly consistent with the real money momentum ranking – chart 4 (rank correlation coefficient = 0.76). Minor anomalies include India, Brazil and Switzerland (downside risk to current PMI ranking suggested by money trends), and Japan and Sweden (upside).
Chart 3

Chart 4