The US dollar and US Treasuries have long been seen as safe haven assets. In this edition of Outlook, we ask whether US assets are losing their special status.
Although market volatility has eased, the market shocks of April have brought to light several interesting observations that are worth exploring further.
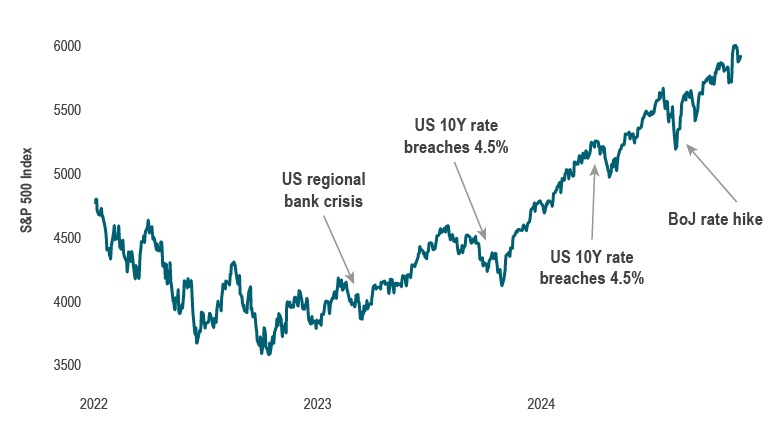
The usual relationships between “risky” and “safe” assets started breaking down, posing challenges for asset allocators. As stock markets plunged, long-dated Treasury yields increased and the US dollar weakened (see Chart 1). Notably, the 30-year Treasury yield surged over 65 basis points from its lowest to highest in just three trading days, surpassing 5% briefly.
Chart 1: US assets shaky
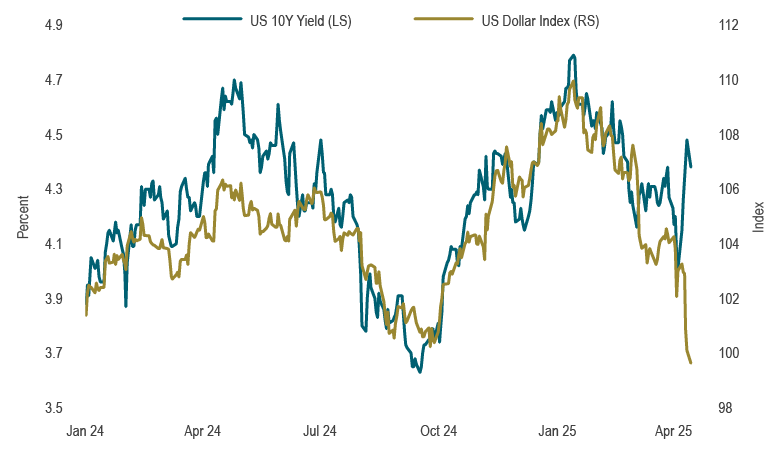
Source: US Department of the Treasury, Intercontinental Exchange (ICE), Macrobond
Normally when recession fears grow or investors move to “risk-off” mode, we would expect yields to drop and the US dollar to strengthen. The fact that Treasuries and the United States Dollar weakened during recent turmoil suggests that the US’s safe haven status may be fading.
Attempts at explaining the surge in yields include concerns about rising inflation, technical flows, liquidity squeezes, worries about the US dollar as the reserve currency, foreign investors exiting US-based assets and broad US fiscal concerns. We will examine the latter two in greater detail.
Foreign investors not yielding to pressure
Investors have piled money into the US at staggering rates in recent years (see Chart 2). Not only has foreign ownership of US equities risen to a record high, but foreign ownership of US Treasuries has increased nearly twofold since 2010, rising by USD4 trillion. While the bulk of US assets are held domestically, foreign ownership represents a sizeable share. Japan and China are the top two foreign holders of US Treasuries. In the context of geopolitical tensions and an unfriendly trade environment, it is plausible that investors in other countries, including China and Japan, were selling US Treasuries to increase yields and exert pressure on President Trump to reconsider recent tariff escalations. Yet, preliminary data indicate that US assets were sold by private Japanese investors. Given the US dollar was declining in parallel with Treasury bonds during this sell-off indicates investors were price-insensitive and getting ahead of potential government intervention. Additionally, the euro, Japanese yen, and British pound experienced some of the largest rallies against the US dollar during this period, which aligns with the fact that the Eurozone, Japan and the UK are three of the four largest foreign creditors to the Treasury market. In other words: direct measures to repatriate capital in response to the tariffs.
Chart 2: Foreign ownership of US securities has surged
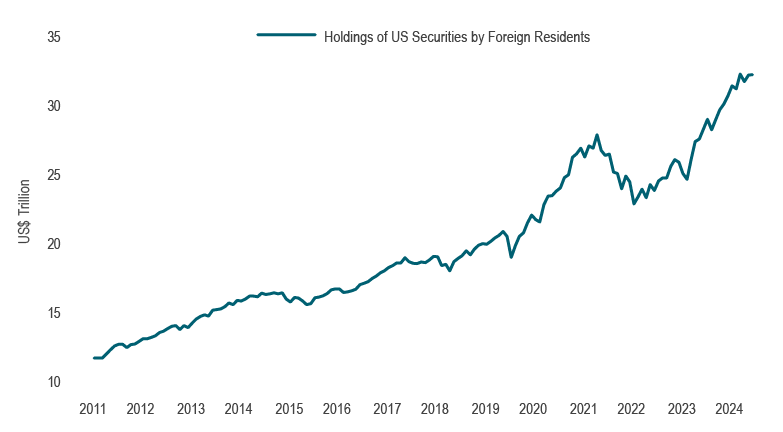
Source: US Treasury, Macrobond
Note: Includes US Treasury, agency, and corporate bonds and US equity securities.
However, there is likely a broader theme at play, which extends beyond actions taken by global central banks or hedge funds. In recent years, investors globally have had significant over-allocation to US assets denominated in US dollars – a phenomenon that has been intensified by the theme of US exceptionalism. This exceptionalism has grown out of two areas. First, the US has a longer term economic dominance in the world order. Second, a more recent leadership role in technology combined with sizeable post-pandemic fiscal expansion has resulted in outperformance in the US markets and economy compared to its developed market counterparts. The unwinding of the US exceptionalism trade could accelerate the divestment of US assets in US dollars, as global fund managers seek to manage risk and diversify their portfolios. There are numerous estimates regarding these figures, projected to be in the trillions. The unwinding of this trade and the reallocation of assets could take a considerable amount of time.
Fiscal hawks soar
Regarding US fiscal matters, there is growing evidence indicating that the Trump administration does not intend to use the revenue generated from tariffs to reduce the deficit. Instead, the funds are being allocated towards substantial tax cuts, which have been met with disapproval from proponents of fiscal conservatism. In early April in the midst of the tariff headlines, the US Senate approved a budget resolution for up to $5.3 trillion in tax cuts over 10 years and increased the debt limit. The increased fiscal deficit will lead to a higher supply of government bonds, so it is understandable that the long-term US bond market has experienced weakness.
Concerns over the rise in interest costs are growing for fiscal hawks (Chart 3). For instance, federal interest payments will cost 18.4 cents of every dollar of revenue in 2025, equaling the previous high set in 1991. This is projected to rise to 22.2 cents by 2035. While predictions about a fiscal crisis within the next 5-10 years are warranted, it is uncertain whether this might occur sooner or later.
Chart 3: Interest Costs Becoming a Concern
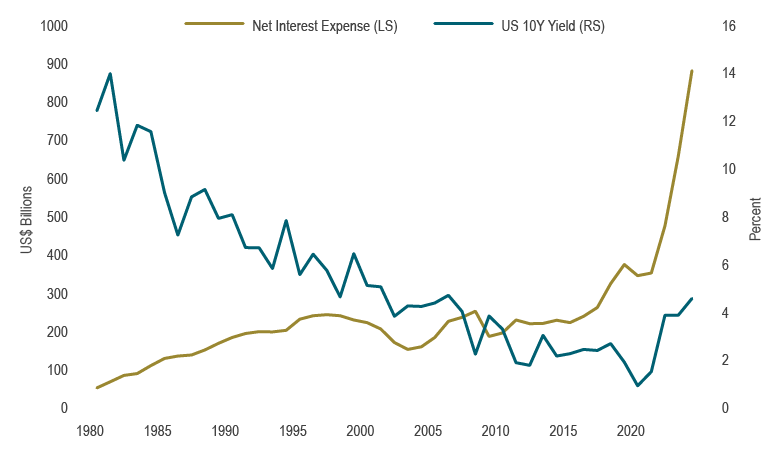
Source: US Congressional Budget Office, Macrobond
It is important to note that whenever there is a significant increase in US Treasury yields, concerns about fiscal sustainability often arise. Higher bond yields typically result in tighter financial conditions, which can slow economic activity. This often leads to a bond market rally, after which fiscal concerns diminish until the next sell-off. Typically, the narrative follows the price action. However, current observations suggest that the risk of a fiscal crisis may be higher now than before.
Conclusions
Global investors appear to be reassessing their substantial holdings in US dollar-denominated assets, partly due to concerns over geopolitical tensions and fiscal policies. Recently, we observed a brief glimpse of the potential market implications resulting from the end of US exceptionalism and the subsequent asset allocation reset. There are several key points to consider:
- President Trump toned down his tariff rhetoric because higher yields would make the fiscal situation in the US unsustainable. This confirmed the administration’s priority to keep long-term yields capped to manage federal interest expenses.
- A fractured geopolitical landscape, combined with rising uncertainty and increased debt supply, implies a repricing of the term premium — the additional return required for holding a longer-term bond — from its multi-decade lows. It biases bond yields higher (acting against the desire for lower yields in the first point). This in turn prevents bonds from providing the portfolio hedge they are meant to provide in risk-off situations. In theory, Treasuries must offer a higher yield. Taking it all together, we see a secular tailwind for non-USD-denominated assets.
- Changes in asset allocation are typically structural and take time to implement. While a shift away from the US may be under consideration, any resultant flows will take time to materialize. This process is expected to unfold over several months or even years, rather than within a few days.
Capital markets
April started with significant turbulence in financial markets due to the announcement of US reciprocal tariffs, causing a global sell-off. Equity markets collapsed, credit spreads widened sharply, and the volatility index (VIX) reached its highest level since the pandemic. The S&P 500 experienced its fifth-worst two-day decline since WWII following the announced tariffs. However, after multiple policy changes and subsequent reversals, the US equity market began to stabilize and conditions started to improve. Despite this, the S&P 500 declined by 0.7% in April, resulting in a third consecutive monthly loss and a year-to-date return of -4.9%.
Canadian equities fared better, declining only 0.1% in April. Defensive segments of the Canadian market, such as consumer staples and gold, emerged as the best performing sectors, whereas cyclical segments on average underperformed. In contrast to the US, Canadian equities (along with European and emerging market equities) have experienced positive returns this year. For Canada, that has been partly explained by the exposure to the gold sector, as gold prices rose for the fourth consecutive month, taking the year-to-date returns to +25.3%.
Other asset classes faced challenges and did not stabilize. WTI crude oil prices declined by 18.6% in April in response to global growth and trade concerns, while the US dollar index (DXY) declined by 4.6% in April, the largest two-month decline since 2002.
Bond markets have also been volatile. Although US Treasury yields spiked in April, they moderated later in the month and have declined for the year as market expectations for monetary easing from the US Federal Reserve (Fed) increased due to rising recession probabilities. The Fed has kept rates steady this year, which has drawn criticism from President Trump.
Canadian yields rose in April but declined so far in 2025 (excluding 30-year yields and to a lesser extent compared to US yields). In April, the Bank of Canada maintained its overnight rate at 2.75% for the first time since initiating its easing cycle last June, following two interest rate reductions in the first quarter. The FTSE Canada Universe Bond Index fell 0.7% in April, though has maintained a positive return year-to-date (+1.4%).
Portfolio strategy
Although economic data has taken a backseat to trade headlines, the effects of tariffs on data have already emerged. Survey releases (considered “soft data”) suggest severe economic slowing. This has not, however, been confirmed by “hard data” releases, some of which look to be distorted by tariff front-loading. Although it is uncertain whether the “soft data” will affect the “hard data,” we assign a reasonably high probability to the likelihood of a continued economic slowdown.
Recent inflation releases have been better than feared, providing relief to markets. Nevertheless, core inflation indicators continue to be elevated, and survey-based inflation expectations have surged to multi-decade high levels, which poses challenges for central banks. This situation has resulted in an unusual combination of slowing economic growth and persistent inflation.
Within balanced portfolios, we reduced the underweight position in equities as the market fell in early April. We maintain a cautious outlook as slowing economic growth, persistent inflation, and heightened uncertainty do not present a favourable environment for risk assets. Additionally, equity market valuations remain relatively expensive.
Fixed-income portfolios hold underweight positions in both provincial and corporate bonds. We expect the yield curve to steepen reflecting an expectation for higher long-term yields relative to short-term yields. Notably, inflationary pressures and fiscal concerns should see longer-dated bond yields under some upward pressure over the near term.
Fundamental equity portfolios have increased defensive holdings by reducing exposure to cyclical sectors such as banks and oil producers, instead favouring grocers, utilities, and gold.
We will continue to monitor the evolving near-term economic developments to understand whether the existing safe haven remains, or whether policy will reignite havoc.


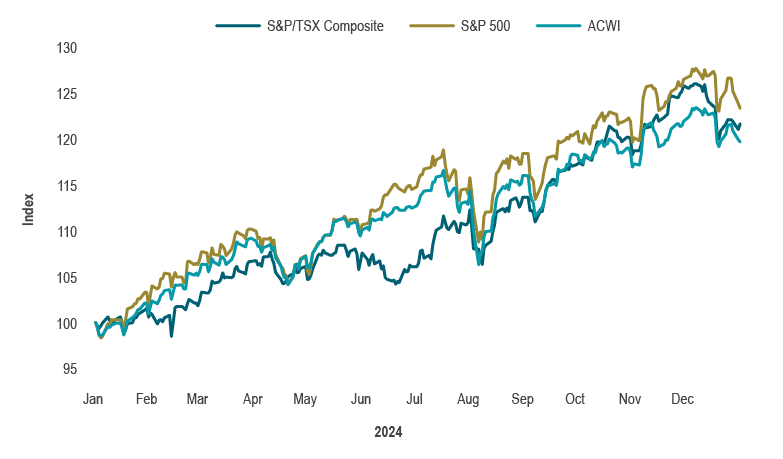 Source: TMX, S&P Global, MSCI, Macrobond
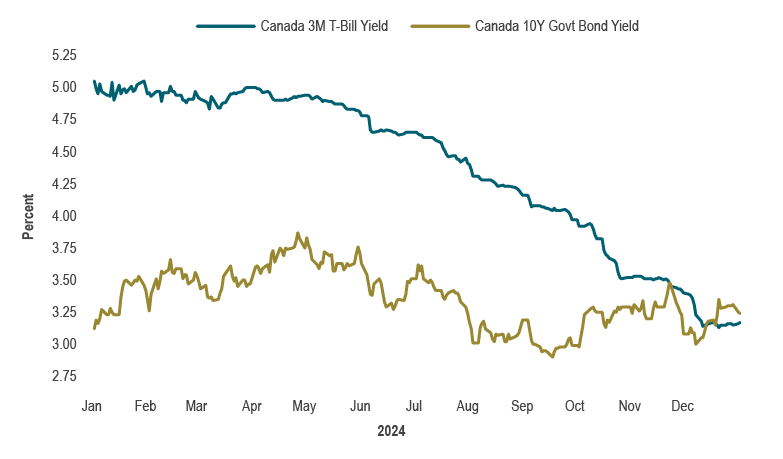 Source: Macrobond
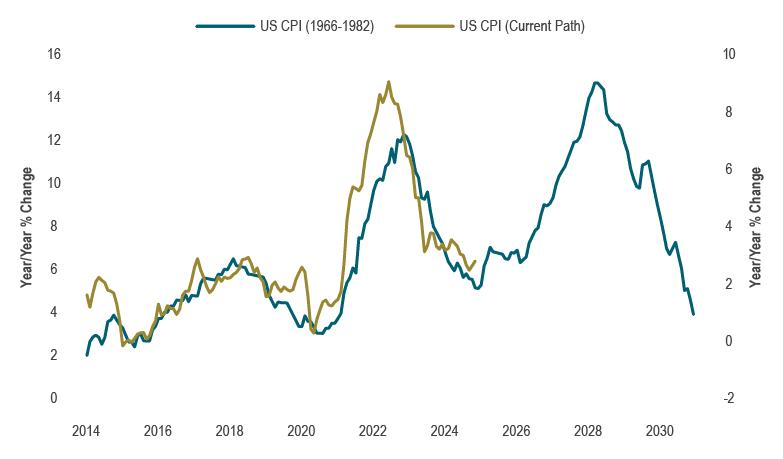 Source: BLS, Macrobond
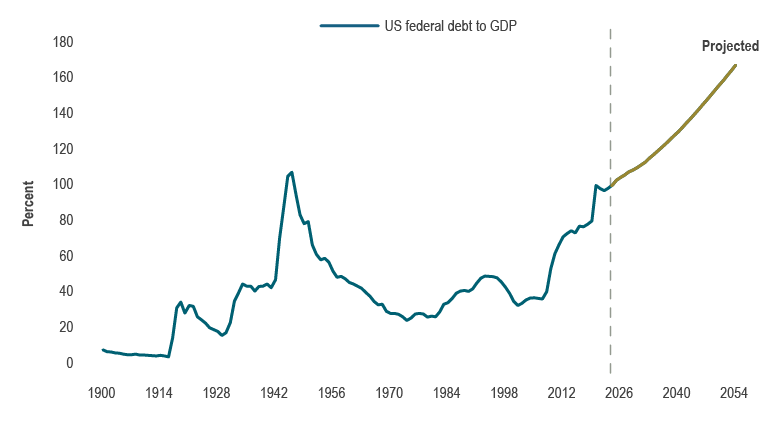 Source: CBO, Macrobond
 Source: IEA
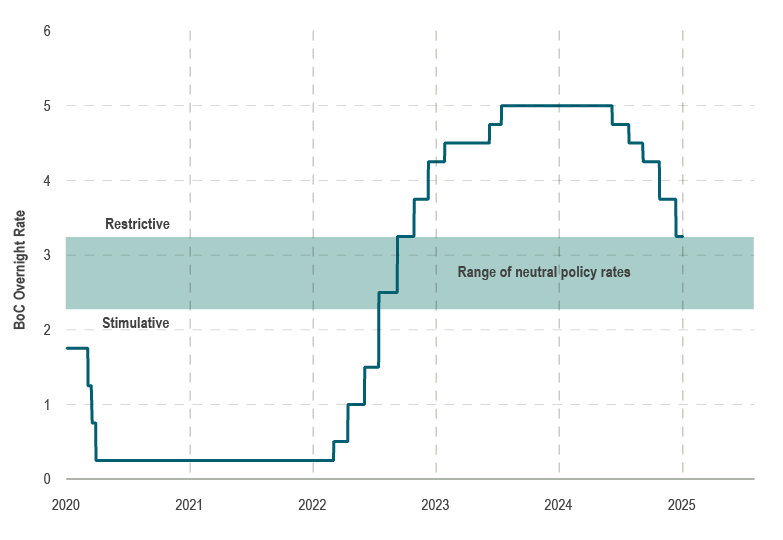 Source: BoC, Macrobond
 Source: Fed, Macrobond
 Source: ECB, Macrobond
 Source: JBT, Macrobond
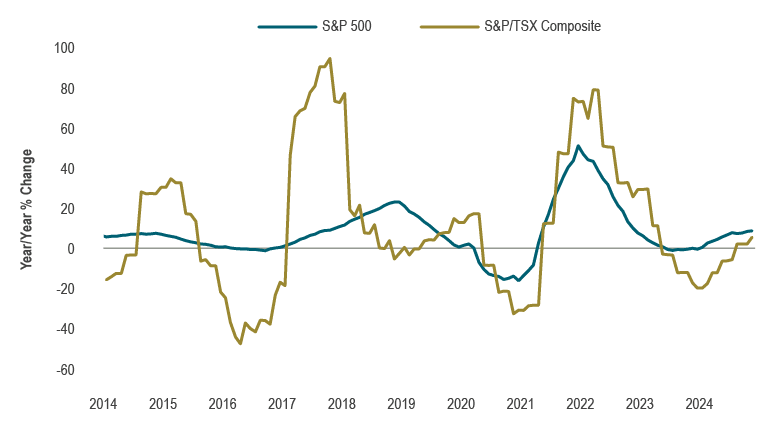 Source: I/B/E/S, Bloomberg, Macrobond
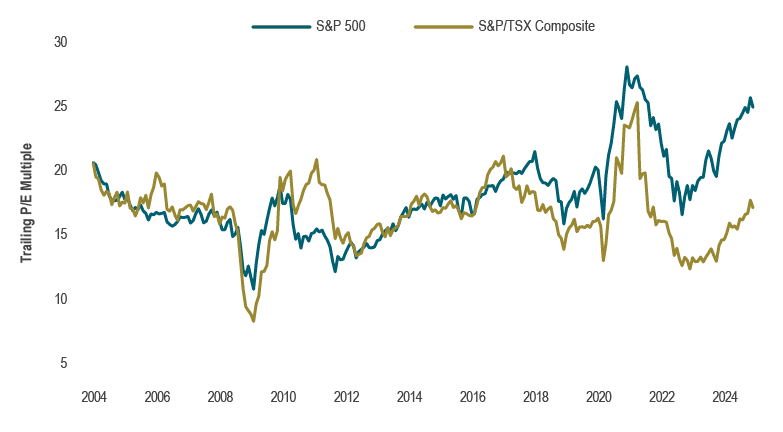 Source: I/B/E/S, Bloomberg, Macrobond
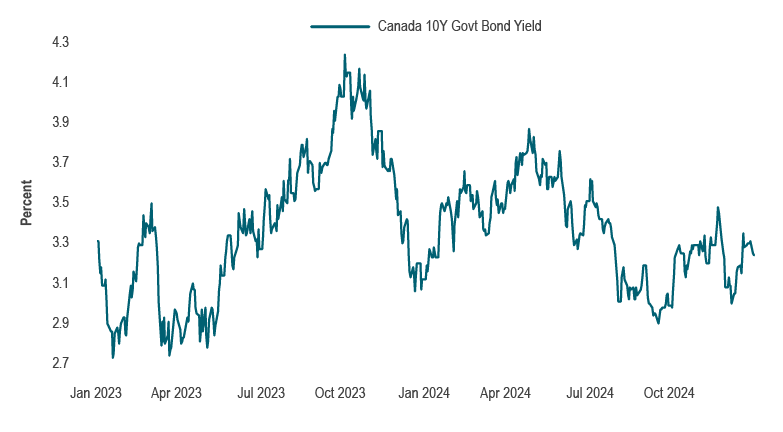 Source: Macrobond
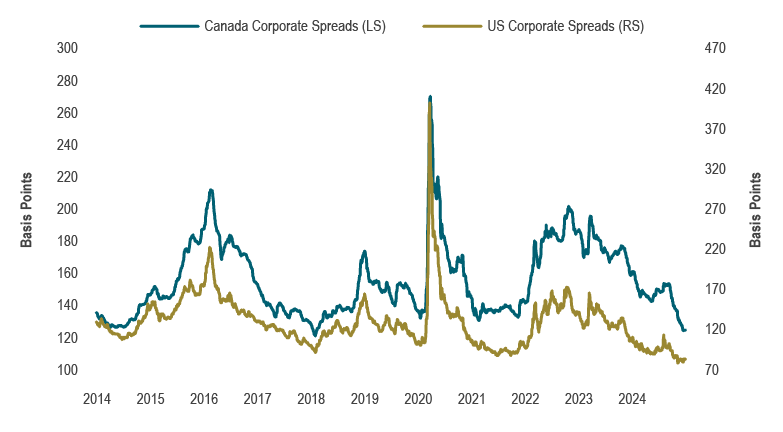 Source: FTSE Global Debt Capital Markets Inc., Connor, Clark & Lunn Investment Management Ltd., ICE BofA Indices