On May 15, 2024, Singapore swore in its first new prime minister in 20 years. Lawence Wong, at the age of 51, previously the deputy prime minister, succeeded Lee Hsien Loong.
While Lee Hsieng Loong is the son of Lee Kuan Yew (the founding father of Singapore), Lawence Wong was born to a family he described as ordinary, growing up in a public housing flat. He started his career as an economist at the Ministry of Trade and Industry (MTI), and later held several important positions in energy, culture, national development, education, healthcare and finance, among other departments.
Last week, Wong delivered his maiden National Day Rally speech and called for major reset of policies and attitudes. He is expected to keep the city-state as open as possible, maintaining independence through a wide network of bilateral and regional free-trade agreement. He pledged to look after various groups of Singaporeans, including the elderly, families and lower-income households. A few highlighted policy changes from his speech include: more paid paternity leave and shared paternity leave; temporary financial help for lower and middle-income workers who lose their jobs; discontinuation of the Gifted Education Program in primary schools; increasing support for affordable housing; and strengthening of the sporting culture.
A top-5 country by GDP per capita
Once known as one of the four Asian Tigers, Singapore experienced rapid economic growth thanks to exports and industrialization between 1960s and the Asian Financial Crisis of 1997. The 2000s were a tumultuous period for the country, however. Faced with the dot.com bust, SARS and the global financial crisis, Singapore restructured and diversified its economy. It began to bounce back, and is now the fifth richest country in the world based on GDP per capita, according to The Economist.
Resilient economic growth
2024 Q1 GDP growth of 3.0% and Q2 of 2.9% were both better than expected. Last week, MTI raised Singapore’s annual GDP growth forecast in 2024 to 2-3%, adding that external demand outlook is expected to be resilient for the rest of the year. Growth sectors will be manufacturing (especially electronics related to smartphones, PC, and AI-related chips), chemicals, tourism, aviation, finance and insurance.
A home to multinationals
Singapore and Hong Kong have traditionally been viewed as rivals, attracting many international companies and talents to work and live there. But Hong Kong’s ever-closer ties with mainland China have raised increasing concern among some people about democracy and safety, causing more and more foreign companies and foreign nationals to leave Hong Kong for Singapore. While Hong Kong’s standard corporate tax rate is as low as 16.5%, Singapore’s 17% tax rate can be cut to 13.5% or less for some activities. As a matter of fact, Singapore was regional headquarters to 4,200 multinational companies in 2023, compared to 1,336 in Hong Kong. A list of such companies includes FedEx Corp., Microsoft Corp., Google, TikTok, Shein and General Motors Co., etc. The often-cited reasons for this big gap are better relations with the West, a broader talent pool, diversified economy, and tax incentives.
Asia’s top financial center
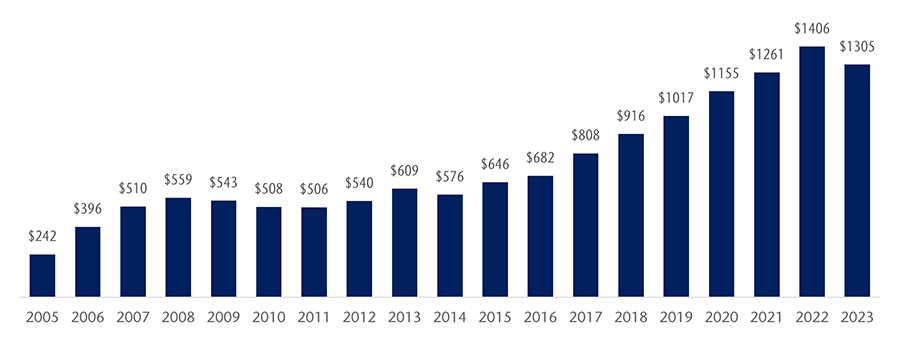
According to the latest 2024 Global Financial Centres Index, Singapore overtook Hong Kong for the third year in a row to become Asia’s top financial center, ranking third globally, behind New York and London. Singapore has also become an attractive asset management hub. Wealth overseen has doubled in the past six years, to about US$4 trillion, and about 80% of that is foreign. Government initiatives are the key driving forces. For example, in 2020, the government introduced a new legal structure called a variable capital company that provides tax and legal incentives to hedge funds, venture capital and private equity firms to set up in Singapore, comparable to Cayman Islands and Luxembourg.
Singapore’s economic backyard is Association of Southeast Asian Nations (ASEAN), a 10-nation region with a population of 680 million and an economy of US$3.6 trillion. Singapore’s stable political climate and high living standards make it an ideal destination for high-net-worth individuals and global financial professionals.
Our portfolio holding in Singapore – Raffles Medical Group
Founded in 1976, Raffles Medical is Singapore’s largest homegrown private healthcare provider and the first member in Asia to join the Mayo Clinic Care Network. It owns four hospitals and over 100 clinics in five countries including Singapore, China, Japan, Vietnam and Cambodia. It has over 7,000 corporate clients and 2.2 million patients.
Covid impacts on the company were mixed. On the one hand, hospital development in China was seriously delayed. On the other hand, Singapore business accelerated thanks to government-related Covid services.
Like many stocks that benefited from upticks in Covid-related revenue, Raffles Medical experienced tough comps following the pandemic. However, we are very confident about its growth potential thanks to its strong reputation in the industry, net cash position and consistent growth strategy in Asia.
Since February 2024, Dr. Loo Choon Yong, the owner and founder of Raffles Medical, has spent almost S$35 million of his own money to buy back shares in his company.
New chapter for Singapore
Although Singapore came into being only in 1965, it has developed from a red dot to a shining star in Asia. Looking ahead, Lawrence Wong, the fourth Prime Minister, will have to navigate through a challenging time with increasing geo-political tension, weak global economy and deglobalization. His party’s popularity will be tested, as will his personal popularity, in the general election to be held no later than November 2025. Let’s hope Singapore’s best years are ahead of us.


 Source: PitchBook.
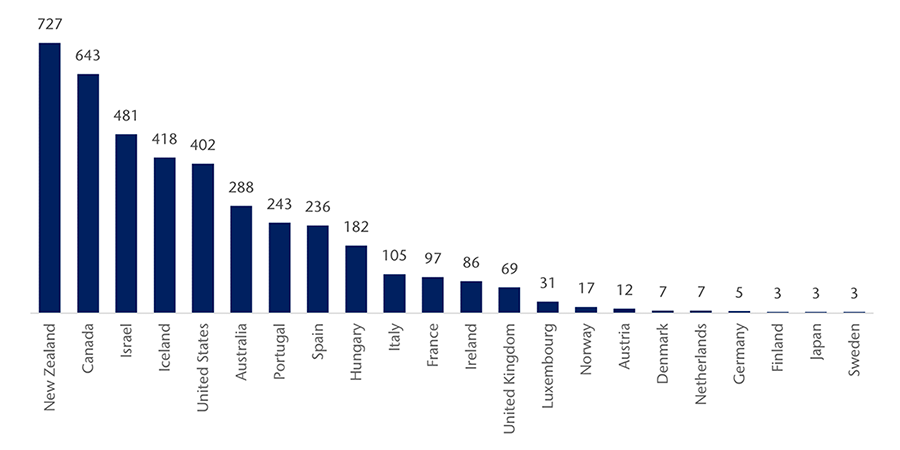 Source: Statista.