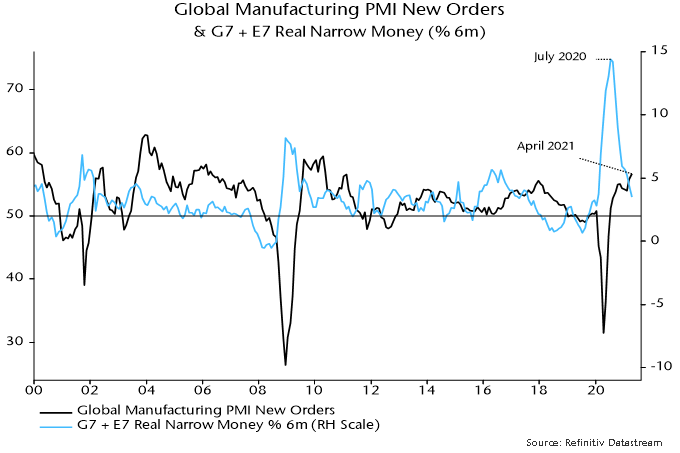
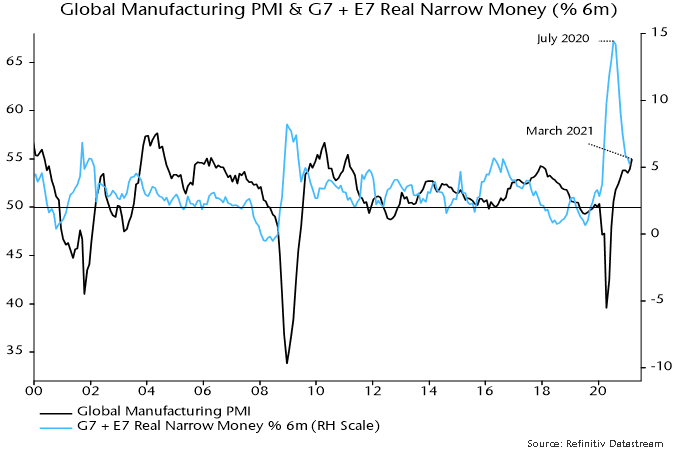
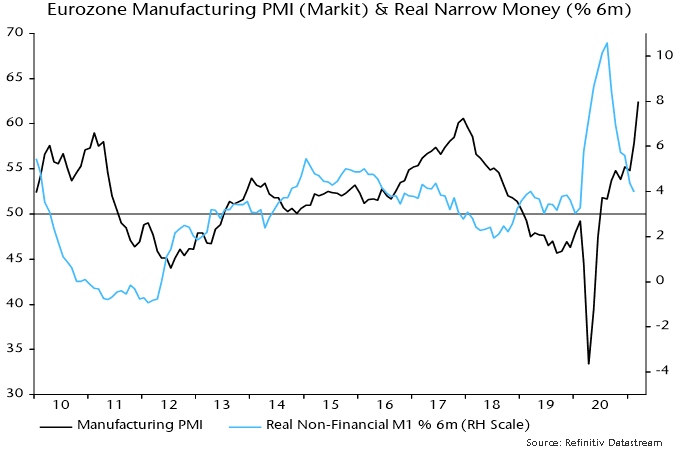
The forecast here remains that global industrial momentum, as measured by the manufacturing PMI new orders index, is at or close to a peak, with a multi-month decline in prospect.
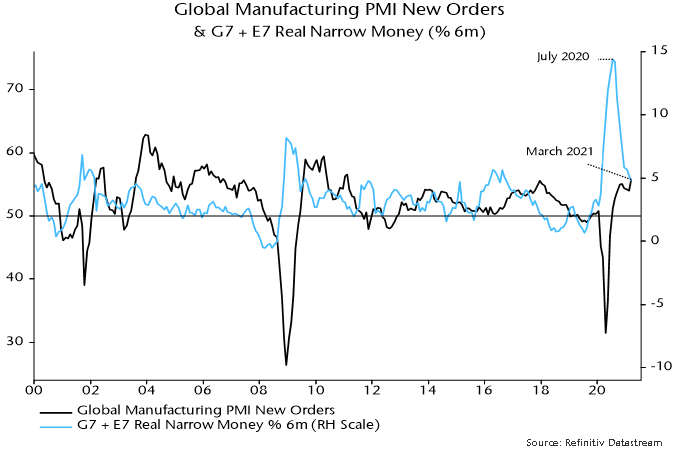
The basis for the forecast is a fall in global six-month real narrow money growth from a peak in July 2020 – the rise into that peak is judged to correspond to the increase in PMI new orders to an 11-year high in April.
Available April monetary data indicate that real narrow money growth fell further last month, suggesting that the expected PMI decline will extend into late 2021 – see chart 1.
Chart 1
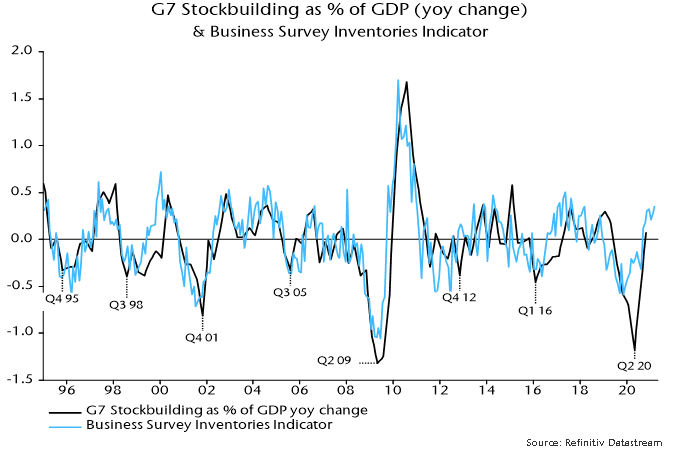
The presumption here is that PMI weakness will be modest, partly reflecting a view that the global stockbuilding cycle will remain in an upswing through H2. The cycle has averaged 3.5 years historically and bottomed in Q2 2020, suggesting a peak in Q1 2022 assuming an upswing of half-cycle length. Large declines in PMI new orders (i.e. to 50 or below) have usually occurred during cycle downswings.
Any PMI pull-back, however, could have significant market implications given consensus bullishness about global economic prospects.
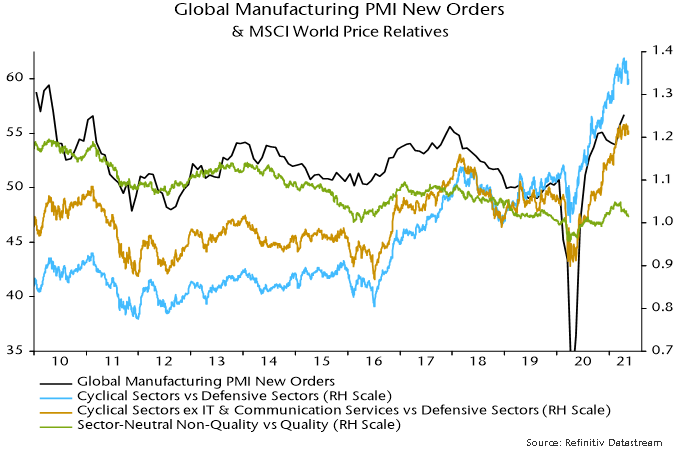
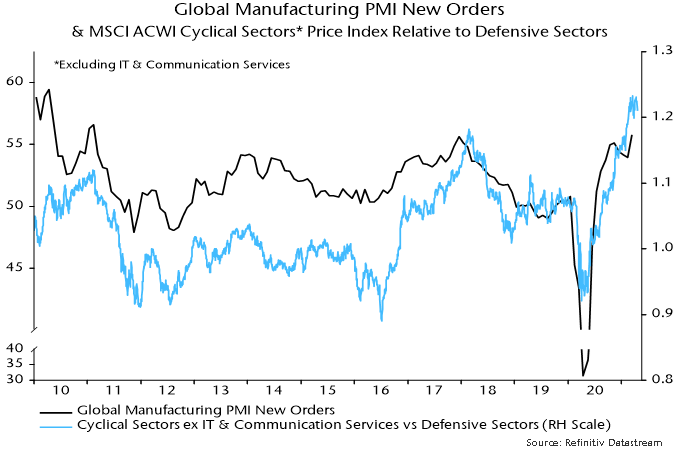
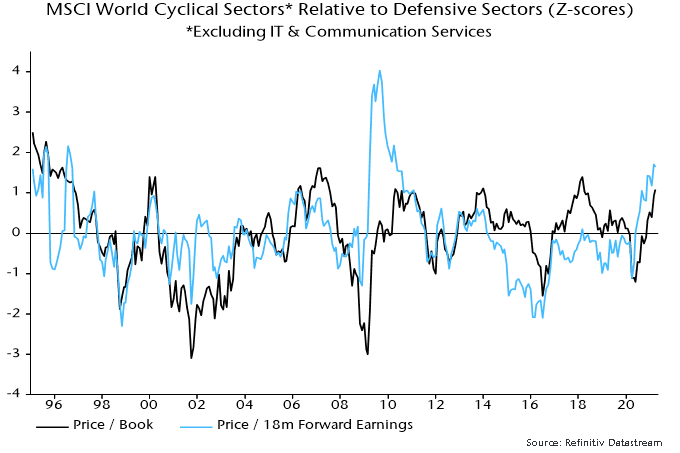
Historically, a declining trend in global manufacturing PMI new orders has been associated with underperformance of cyclical equity market sectors and outperformance of quality stocks within sectors. The price relative of MSCI World cyclical sectors to defensive sectors peaked in mid-April, falling to a three-month low last week – chart 2.
Chart 2
The decline has been driven by a correction in tech – the MSCI cyclical sectors basket includes IT and communication services. The price relative of non-tech cyclical sectors to defensive sectors has moved sideways since March.
The MSCI World sector-neutral quality index, meanwhile, has recovered relative to the non-quality portion of MSCI World since March, following underperformance in late 2020 / early 2021 when cyclical sectors were outperforming strongly.
Equity market behaviour, therefore, appears to have started to discount a PMI roll-over, although confirmation is required – in particular, a breakdown in the price relative of MSCI World non-tech cyclical sectors to defensive sectors.
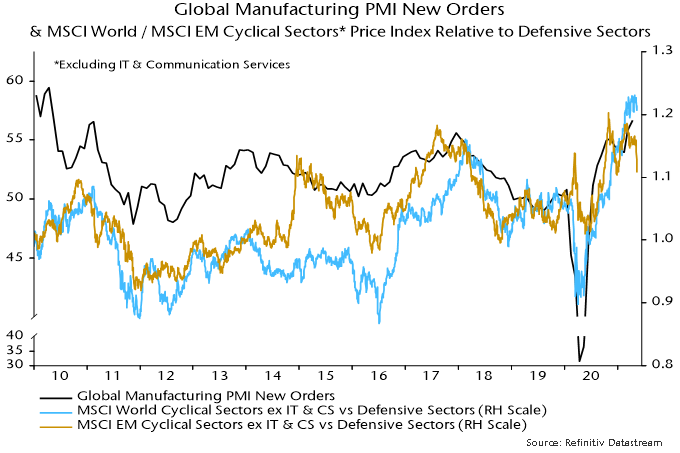
A sign that this could be imminent is a recent sharp fall in the non-tech cyclical to defensive sectors relative in emerging markets – chart 3. A possible interpretation is that the decline reflects worsening Chinese economic prospects, with China likely to be a key driver of a global slowdown. Early Chinese monetary policy easing may be required to mitigate this drag and lay the foundation for a resumption of cyclical outperformance.
Chart 3
On April 22 and 23, 2021, United States (US) President Joe Biden convened 40 world leaders for a virtual Leaders Summit on Climate, to rally the world in combatting the climate crisis.
Many countries announced ambitious new climate targets, ensuring that nations accounting for half of the world’s economy are now committed to the emission reductions needed globally to keep the goal of limiting global warming to 1.5 degrees Celsius within reach. For example:
The US submitted a new “nationally determined contribution” (NDC) under the Paris Agreement, setting an economy-wide emissions target of a 50-52% reduction below 2005 levels in 2030.
Japan will cut emissions by 46-50% below 2013 levels by 2030, with strong efforts toward achieving a 50% reduction, a significant acceleration from its existing 26% reduction goal.
Canada will strengthen its NDC to a 40-45% reduction from 2005 levels by 2030, a significant increase over its previous target to reduce emissions 30% below 2005 levels by 2030.
The United Kingdom will embed in law a 78% greenhouse gas reduction below 1990 levels by 2035.
The European Union is putting into law a target of reducing net greenhouse gas emissions by at least 55% by 2030, and a net zero target by 2050.
China and Russia also reaffirmed commitments to reduce emissions, and agreed to cooperate with the US on climate change despite division on issues like trade and human rights.
During one of the sessions, Unleashing Climate Innovation, world leaders urged investment in mitigation and adaptation technologies, which include clean fuels such as hydrogen; renewables such as offshore wind and geothermal energy; energy storage; clean desalination; carbon capture; advanced mobility; sustainable urban design; and monitoring technologies to verify emissions and stop deforestation.
At Global Alpha, sustainability is one of our five major investment themes. The energy transition towards a low-carbon society provides long-term growth opportunities. We look for niche market leaders who will benefit from this secular growth trend. A few current holdings include:
Clean Energy Fuels (CLNE US), based in the US, designs, builds and operates natural gas filling stations for vehicle fleets. It has 550+ stations in North America. Its primary fuel is Renewable Natural Gas (RNG), the only fuel available for heavy-duty vehicles that can have carbon-negative emissions (RNG avoids more emissions than it generates).
Ormat Technologies (ORA US), based in the US, is a leading renewable energy provider globally with a 932 megawatt portfolio. Its business expands from geothermal to recovered energy and energy storage.
Hexagon Composites (HEX NO), based in Norway, is a global market leader in a carbon fiber gas containment system used in the transportation industry. It operates in Norway, Germany and the US. Hexagon’s products are mostly used for clean alternatives, such as RNG, hydrogen, and propane.
We also invest in companies related to electric vehicles (EV) and waste management but this week, we would like to profile one of our new holdings, Iwatani Corporation (8088 JP), which is the largest distributor of hydrogen, LPG, and helium in Japan.
Business Overview
Founded in 1930, Iwatani is a leading distributor of gases for industrial and household use in Japan. It has several business areas. The industrial gases segment includes hydrogen, oxygen, nitrogen, helium, semi-conductor material gas and medical gas. The energy segment distributes a wide range of gases such as LPG, LNG, kerosene, and gasoline. The company also manufacturers machinery and environmental-friendly materials, such as biomass fuels, eco PET resin and EV-related battery materials.
Iwatani is the only fully-integrated supplier of hydrogen in Japan, with a nation-wide network, including manufacturing, transportation, storage, supply, and security.
Target Market
Iwatani has a steadily growing product portfolio led by LPG, but the new growth driver is hydrogen.
Japan was the first country to adopt a “Basic Hydrogen Strategy” as early as in 2017. Japan aims to increase the number of fuel cell vehicles (FCVs) to 40,000 units by 2020, to 200,000 units by 2025 and to 800,000 units by 2030. It also aims to increase the number of hydrogen stations to 160 by 2020, to 320 by 2025, and to 900 by 2030.[1]
#1 hydrogen stations network with 33% market share
#1 in helium sales with 50% Japan market share, and 8% global market share
#1 in LPG sales in the retail market with 4.1% market share
#1 in LPG sales in the wholesale market with 13.1% market share
#1 in the portable gas cooking stoves market with 80% market share
#1 in the cassette gas canisters with 60% market share
Close relationship with government as the industry leader
High entry barriers: a highly regulated industry because safety is of the utmost importance when handling industry gases.
Growth Strategy
Distribution: expand distribution network for hydrogen and LPG
Consolidation :
To acquire smaller LPG competitors
To acquire companies into its organized Marui Gas network
Management
Akiji Makino has been Iwatani’s Chairman and CEO since 2012. He joined the company in 2000 and has rich industry experience. Insiders own about 16%, including the Iwatani Naoji Foundation.
ESG
Iwatani has been an industry leader in energy transition. Its sustainability report is very comprehensive. Iwatani’s major offices are ISO14001 certified. The company is focused on eco-friendly products and promotes eco-efficient use of energy. At its workplace, Iwatani promotes diversity, employee development, and provides support for child care and nursing care.
Regarding corporate governance, Iwatani has met all the requirements of the Tokyo Stock Exchange. However, at Global Alpha, we apply more stringent requirements in line with western standards. For example, we encouraged the company to have at least one-third of board directors be independent, with a separate board chair and CEO, and at least one female board director.
Risks
Delay in the rollout of FCV commercialization ad FC technology development
Connor, Clark & Lunn Financial Group, one of Canada’s largest independent asset management firms, announced today the launch of the Connor, Clark & Lunn UCITS ICAV. The initial sub-funds include the CC&L Q Emerging Markets Equity UCITS Fund and the CC&L Q Global Equity Market Neutral UCITS Fund. The investment manager is Vancouver based Connor, Clark & Lunn Investment Management Ltd. (CC&L Investment Management), a team of 100 professionals who manage US$41.7 billion across a range of asset classes.
The CC&L Q Emerging Markets Equity UCITS Fund is an actively managed long-only equity strategy that targets long-term capital growth relative to emerging market equity indices.
The CC&L Q Global Equity Market Neutral UCITS Fund is an actively managed long/short equity strategy that seeks to generate returns that have a low correlation with global equity markets and to maximise long-term total return.
“We have successfully managed quantitative equity strategies for over two decades. Launching UCITS funds for our emerging markets and market neutral strategies allows these strategies to be available to European investors” said Martin Gerber, President & CIO of CC&L Investment Management.
The core of CC&L Investment Management’s investment philosophy is that equity prices are set by the growth, valuation and quality fundamentals of their companies over the long term. However, the market process by which prices accurately reflect these fundamentals is not perfect with a number of behavioral, informational and structural hurdles and frictions that can prevent stock prices from efficiently reflecting these fundamentals. This results in mispricings in the marketplace that offer opportunities to add value. These opportunities are evaluated using a systematic process that objectively assesses each company in relation to CC&L Investment Management’s entire global universe comprised of approximately 16,000 securities, 160 industry groups and 49 developed and emerging countries. The outcome of this daily process is an optimal portfolio that objectively and consistently invests in companies that will provide the best possible return while maintaining disciplined risk management.
“CC&L Investment Management’s experienced team and disciplined approach to investing provide the necessary foundation for success as they expand their product offering into Europe,” said Warren Stoddart, Co-CEO, Connor, Clark & Lunn Financial Group.
The Connor, Clark & Lunn UCITS ICAV is an Irish collective asset-management vehicle constituted as an umbrella fund with segregated liability among sub-funds and managed by Carne Global Fund Managers (Ireland) Limited. HSBC Global Fund Services is the administrator, registrar, depository, custodian and transfer agent; and Matheson acts as legal advisor as to Irish law.
For additional information on the sub-funds, click here to view the Prospectus, Supplements, and key investor information.
About Connor, Clark & Lunn Investment Management Ltd.
Connor, Clark & Lunn Investment Management Ltd. (CC&L Investment Management) is one of the largest independent partner-owned investment management firms in Canada with US$41.7 billion in assets under management. Founded in 1982, CC&L Investment Management offers a diverse array of investment services including equity, fixed income, balanced and alternative solutions including portable alpha, market neutral and absolute return strategies. CC&L Investment Management is a part of Connor, Clark & Lunn Financial Group Ltd.
About Connor, Clark & Lunn Financial Group Ltd.
Connor, Clark & Lunn Financial Group Ltd. (CC&L Financial Group) is a multi-boutique asset management firm that provides a broad range of investment management products and services to institutional investors, high net worth individuals and advisors. We bring significant scale and expertise to the delivery of non-investment management functions through the centralization of all operational and distribution functions, allowing our talented investment managers to focus on what they do best. With offices across Canada, and in Chicago and London, CC&L Financial Group’s affiliates manage over US$70 billion in assets. For more information, please visit www.cclgroup.com.
Contact
Carlos Stelin Director, Institutional Sales, Europe Connor, Clark & Lunn UK +44 (20) 3535 8107 [email protected]
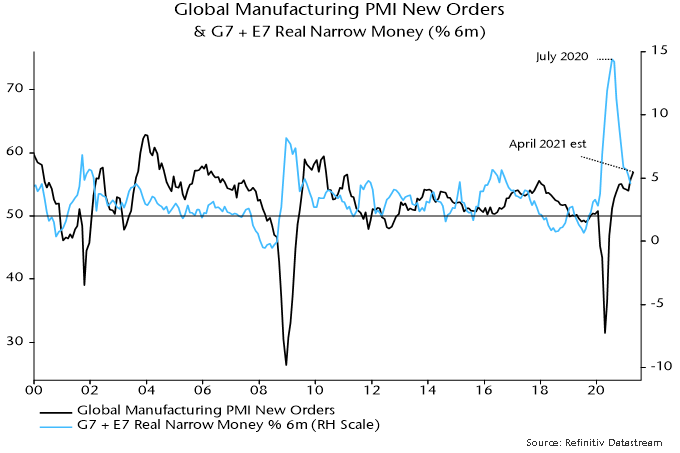
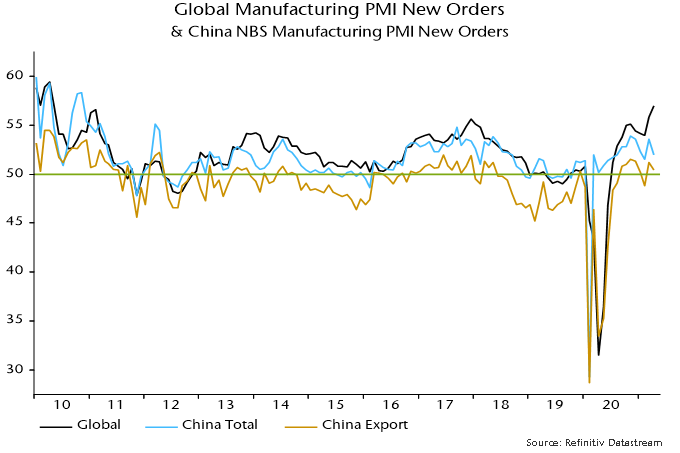
The forecast here at the start of the year was that the global manufacturing PMI new orders index – a key indicator of industrial momentum – would reach a peak in early 2021 and fall into the summer. The index declined slightly between November and February but rose to a new recovery high in March, with flash data last week and today’s Chinese results indicating a further significant increase in April. What has gone wrong?
The expectation of an early 2021 peak and subsequent relapse was based on a fall in global six-month real narrow money growth from an extreme peak in July 2020 – real money growth has led turning points in PMI new orders by 6-7 months on average historically. Six-month real narrow money momentum continued to weaken into March, so the monetary signal for PMI direction remains negative – see first chart.
Chart 1
There was meaningful variation around the 6-7 month historical average lead time. An April PMI new orders peak, were it to be confirmed, would imply a nine-month lead, which would be within one standard deviation of the average. So the further rise into April is not yet an unusual departure from the norm.
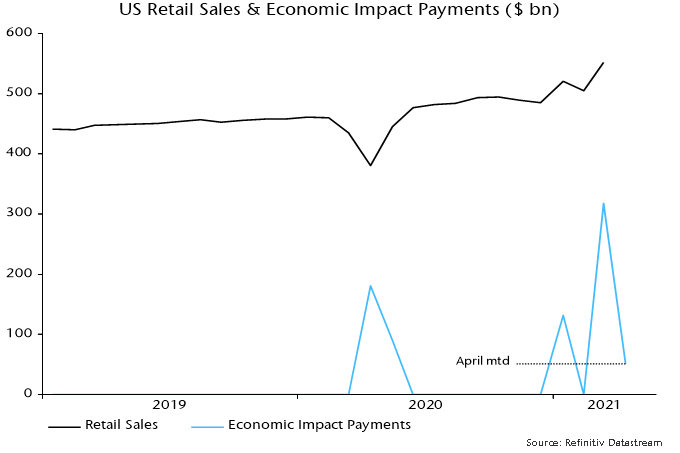
The most likely explanation is that the PMI upswing has been extended by US fiscal stimulus – particularly the third round of payments to households – along with initial moves towards economic reopening in the US, UK and other countries showing progress in virus containment. A 9.3% monthly surge in US retail sales in March may have been a key driver of stronger March / April new orders.
“Economic impact payments” authorised by the American Rescue Plan Act were $318 bn in March and $51 bn through 28 April for a total $369 bn, representing the bulk of a programme costed at $411 bn by the Congressional Budget Office.
New York Fed analysis of data collected in its monthly survey of consumer expectations indicates that households have spent or plan to spend 25% of the windfall, similar to the proportion in the first and second rounds, with remainder used to increase savings (42%) or pay down debt (34%). Rounding the $369 bn received to date up to $400 bn, this suggests additional consumer outlays of about $100 bn.
Assume that half of this amount is spent on goods, which could be an overestimate given that services account for two-thirds of total consumption. That would suggest additional retail sales – a rough proxy for goods spending – of about $50 bn. Monthly sales jumped by $47 bn between February and March. The suggestion is that the bulk of the boost to goods spending has already occurred and sales will fall back sharply into the summer.
Chart 2
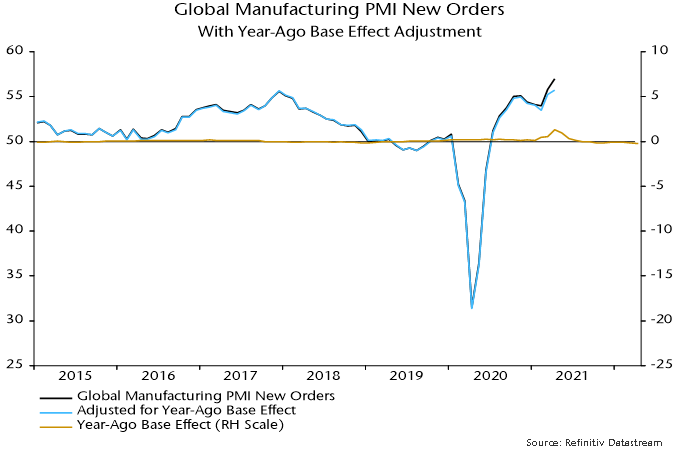
An additional technical explanation for the March / April rise in PMI new orders is a positive base effect from the slump in the index to a low in April 2020. Survey respondents are asked to draw a comparison with the previous month but there is evidence that some replies take into account the level of business in the same month a year earlier – understandable in cases where there is a strong seasonal pattern in demand.
Specifically, a regression of the global manufacturing PMI new orders index on its one- and 12-month lagged values finds a small but statistically significant negative coefficient on the latter*. The coefficient suggests that a 13.7 point plunge in the index in March / April 2020 contributed 0.8 of a point to the estimated 3.0 point increase in March / April 2021 – third chart. This boost will reverse by June, reflecting the recovery in the index after April last year.
Chart 3
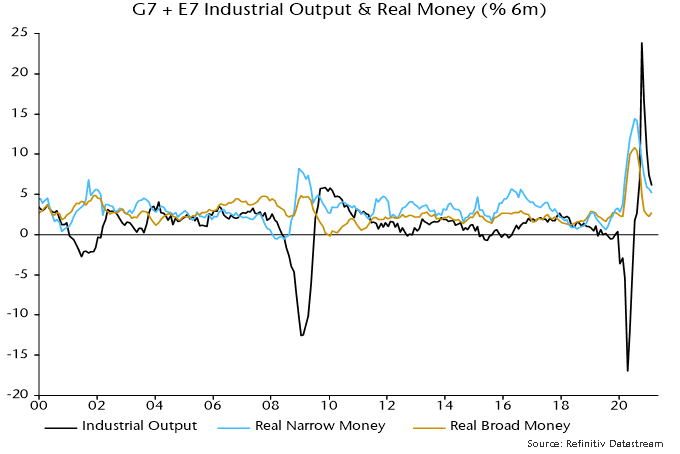
With global real narrow money growth still moderating, the US fiscal boost probably passing its maximum and China still on a slow growth path pending PBoC easing, the forecast here of a PMI pullback through late Q3 is maintained.
Chart 4
*The same result is obtained using US ISM manufacturing new orders data over a much longer sample.
Governments around the world are incurring record deficits to sustain their economies during the COVID-19 pandemic. These deficits are expected to persist, as revenue will be needed to rebuild infrastructure and support an aging population.
Benjamin Franklin, the inventor, philosopher, politician, and one of the founding fathers of the United States, famously said: “In this world, nothing can be said to be certain, except death and taxes.” Yet, in 2018, a record year for corporate profits levels, 91 Fortune 500 companies paid no federal income tax; among them, companies such as Amazon, Netflix, Chevron, GM, and Delta. Even more, their tax rate was -5%, meaning they got a tax refund. The 379 profitable Fortune 500 members paid an effective federal tax rate of 11.3%, almost half of the 21% tax rate established in the 2017 tax revamp. That represented a missing $73.9 billion worth of tax revenue for the federal government. As a result, in 2019, the Organisation for Economic Co-operation and Development (OECD) formally established base erosion and profit shifting (BEPS).
The digital economy giants have been very apt at using BEPS. Looking at cash taxes paid globally by FAANG stocks in 2019/2020, according to Global Alpha’s estimates, Facebook paid 12.75%, Apple 14.4%, Amazon 7%, Netflix 7.3%, and Google 11.9%. As an example of BEPS, Google declared $23 billion in revenues in Bermuda in 2017. Until 2015, Amazon was able to declare all its European revenues in Luxembourg.
The significant tax drag caused by these large multinationals was a major issue in negotiations over tax reforms at the OECD, since they were largely US corporations. The stalemate brought many local governments, such as Australia, the United Kingdom (UK), and France, to impose a local tax based on revenues earned in their respective country. That brought retaliation from the US by taxing imports from these countries.
This graph shows that in the 1970s, the largest corporation paid slightly higher tax rates than smaller ones. By the early 80s, the situation reversed, and the unfair advantage of larger companies has amplified since.
Why should we care? The tax system encourages businesses to consolidate and grow bigger. With a risk, they may abuse their market dominant position. The discussion until recently was concentrating on anti-trust measures. Companies like Amazon, Google and Facebook are currently being investigated by various government entities using anti-trust laws. As the case against Microsoft in 2001 demonstrated, it is hard to win a case against multinationals as current anti-trust regulations focus on the price paid by consumers. Anti-trust cases are overly complex and may take years before reaching a conclusion. Studies show that a minimum corporate tax would be a more effective way to ensure fairness and stable government revenues.
In the last few weeks, US President Joe Biden and his secretary of the Treasury, Janet Yellen, former Federal Reserve chairwoman, have proposed an ambitious plan to arrive at a global framework on taxation, which would stop the race to the bottom and allow countries to fund their needed services to their population.
The Biden tax plan includes the following proposed business tax changes:
Increase the corporate income tax rate, from 21 to 28 percent.
Create a minimum tax of at least 15% on corporations with book profits of $100 million or higher.
Double the tax rate on global income earned by subsidiaries of U.S. firms, from 10.5 percent to 21 percent.
Immediately, countries around the world, like France, Canada, Germany, Japan and many others, welcomed the idea. President Biden went further in supporting the idea of a local tax based on local revenues. There is a high likelihood that OECD negotiations may finally reach a new global tax accord by the end of this summer.
What would be the impact on stock markets?
First, we think the large cap US benchmarks would be most negatively affected, as they incorporate most of the large digital companies, which as explained above, have been the biggest users of BEPS. The S&P500 sells at a record price-to-sale ratio and at an extremely high 24x 2021 earnings. Increasing the tax on these earnings by 25% would mean a ratio above 30 times, which is unprecedented. That compares with a ratio of 17 times for the MSCI EAFE index (ex: North America).
Smaller companies, as discussed, pay a much higher tax rate. The impact of revised tax rates will be much smaller. The MSCI EAFE small-cap index sells at 17.9 times 2021 earnings. In addition, the MSCI World small-cap index, which includes the US and Canada, sells at 18.8 times 2021 earnings. The impact should be less for smaller companies, which should drive outperformance. Another aspect that we should mention is the increased importance of ESG in investment decisions.
The environmental impact and carbon footprint of companies is now an important topic for investors. We believe that aggressive tax planning and avoidance may very soon become another important factor that investors may look at.
When it comes to vaccination campaigns, the United States (US), United Kingdom (UK), and Israel continue to lead the way. Following the vaccination of some of the most vulnerable populations, the rate of hospitalizations are decreasing. Efficient vaccination campaigns in the US and UK have increased confidence that economic activity will continue to grow in the coming months. Many indications show strong pent-up demand from both consumers and corporates starting to increase.
In other parts of the world where vaccinations are taking longer, reopening will be slightly delayed. Despite the slow start in Europe, governments are intensifying their campaigns as the supply of vaccines increases. This should enable the economy to reopen and activity to rebound. As restrictions ease, we continue to expect the economy to recover rapidly beyond Q2.
There are some interesting data points that suggest a stronger economic activity as restrictions ease:
Resilience: Similar to what we experienced in the second COVID-19 wave, economies are showing signs of resilience in this third COVID wave.
Business optimism: Strong survey data for the industrial sector suggests that businesses are more optimistic.[1] This could lead to better business activity for Q2. We noticed some businesses commenting on better than expected business trends. After huge cost cutting efforts during 2020, businesses are gradually returning to capex and IT spending.
Some recreational and sports goods have become more popular in this pandemic as leisure options narrowed. Bicycle sales are enjoying phenomenal demand. Suppliers have indicated that stock levels in the supply chain are much too low and that the return to a more normal inventory level would already lead to a high double-digit market growth. RV manufacturers and RV rental marketplaces is another segment that cannot keep up with demand. Thanks to a tight supply chain, strong demand and low inventories, this segment should enjoy good order visibility for 2021 and beyond.
Regarding travel, US domestic and international flights are at the highest levels since the end of March 2020. Europe, which relies more on intercontinental traffic, has not improved much yet, but there are positive signs starting to emerge. The European Commission presented a proposal to create a digital Green Certificate to facilitate the safe free movement of citizens within the EU. Another example is Iceland, which will open its borders this week to visitors who have received the vaccine without the need for testing or quarantine. Australia and New Zealand will also have a similar arrangement starting next week.
Restaurant bookings are soaring in some parts of the US, but also in the UK, as outdoor bars and restaurants opened earlier this week.[2] With a reduced supply of pubs and restaurants, the ones that operate should enjoy strong consumer traffic. Apparently, outdoor tables booked out several weeks in advance after the UK government announced its reopening framework this winter.
These observations and data points are no surprise, as people look forward to leisure activities and travel after months of restrictions. The important variables now are how fast populations are being vaccinated and how efficient vaccines are in terms of preventing a person from carrying or passing on the virus.
[1] Bloomberg – EMEA WEEK AHEAD: ECB to Hold, Russia Hike, U.K. Jobs
[2] https://www.opentable.com/state-of-industry
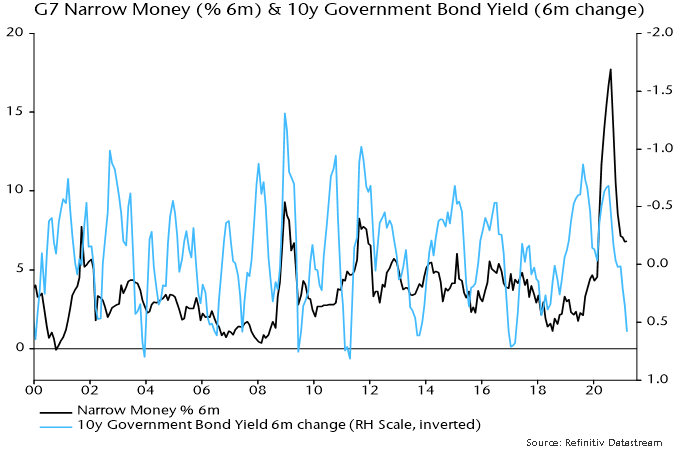
Global six-month real narrow money growth appears to have edged lower in March, continuing a downtrend since last summer. This suggests that an expected relapse in global industrial momentum will extend through late Q3 / early Q4.
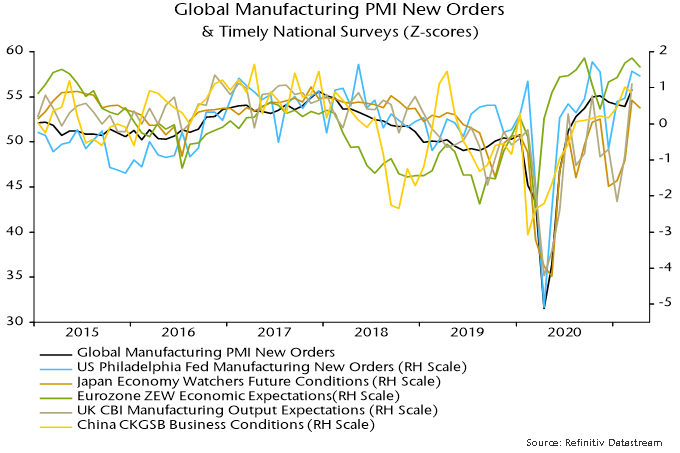
The global manufacturing PMI new orders index reached a new recovery high in March, consistent with a surge in six-month real narrow money growth into July / August 2020, allowing for the historical average 6-7 month lead time. More recent national surveys hint that March will mark a top – see chart 1.
Chart 1
The March real money growth estimate is based on information for the US, China, Japan, India and Brazil, together accounting for 70% of the G7 plus E7 aggregate tracked here. The US component is estimated from weekly data on currency in circulation and commercial bank deposits – official March money numbers are released next week and the Fed no longer provides weekly updates.
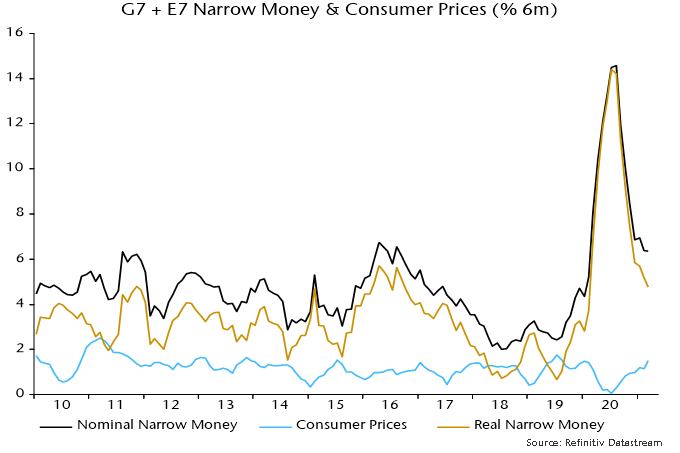
Global six-month real narrow money growth appears to have eased further to its lowest level since February 2020, reflecting stable nominal growth and another rise in six-month CPI inflation – charts 2 and 3.
Chart 2
Chart 3
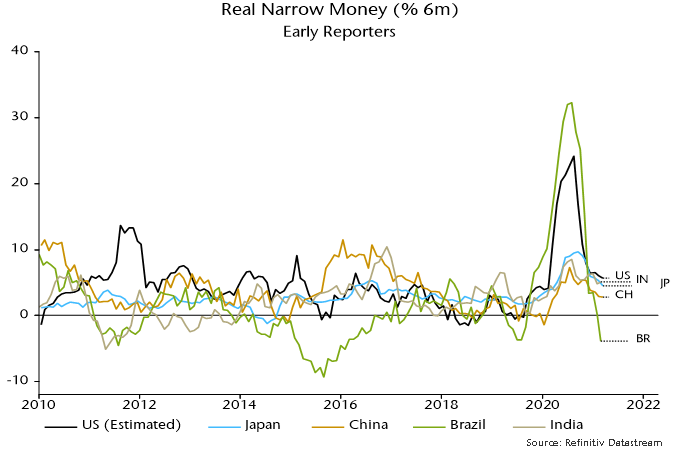
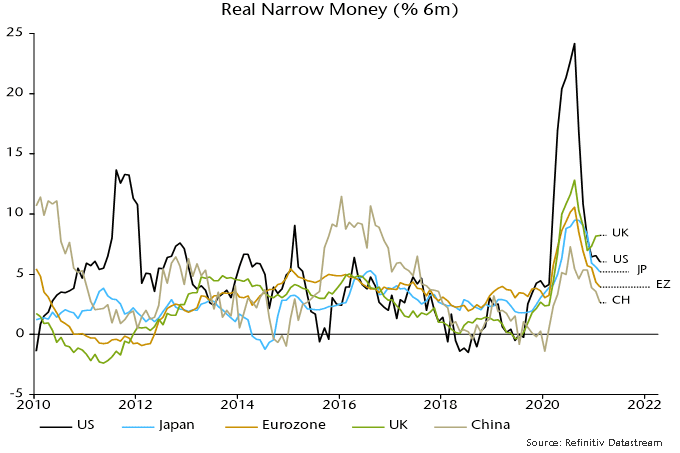
Chart 4 shows the early reporting countries individually. US six-month real narrow money growth is estimated to have edged lower despite disbursement of $318 bn of stimulus payments to households – these were made in the second half of the month and may have a larger impact in April (the money numbers are month averages).
Chart 4
Six-month growth also eased slightly further in Japan and China, with a small rise in India. Brazil moved into contraction although this needs to be placed in the context of an extraordinary surge last summer – 12-month growth is still strong.
Markets could be starting to offer corroboration of the scenario of a global manufacturing PMI new orders peak and pull-back, with Treasury yields stalling and equity market cyclical sectors no longer outperforming – chart 5.
Chart 5
Will global six-month real narrow money growth recover? Six-month CPI inflation is likely to rise slightly further in April / May but could fall back in H2 as commodity prices move sideways or correct.
Fiscal stimulus is acting to push up US nominal money growth but there may be an offsetting drag across the G7 from recent bond yield rises – chart 6.
Chart 6
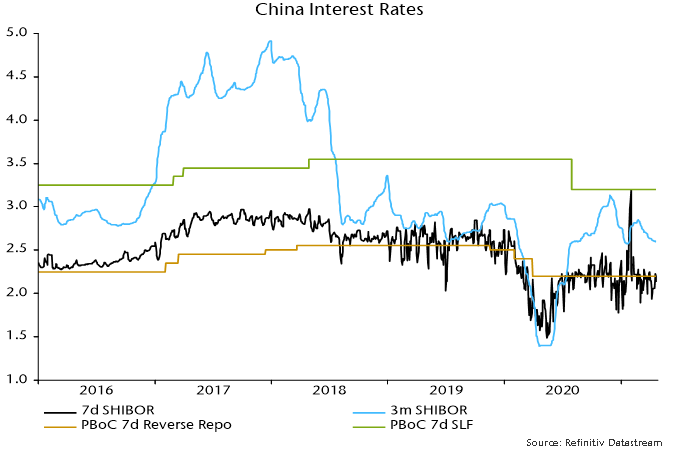
A revival in Chinese narrow money growth probably requires a PBoC policy shift. The view here has been that policy was overtightened in H2 2020 and the economy would slow in H1 2021. This scenario appears to be playing out, with Q1 GDP disappointing and industrial output falling in March. Core CPI inflation (i.e. ex. food and energy) is at 0.3% and a surge in PPI inflation reflects input cost rises that are squeezing downstream margins. The PBoC has allowed three-month SHIBOR to drift back to its January low, consistent with a switch to an easing bias – chart 7.
Chart 7
This year has started on strong footing for global mergers and acquisitions (M&A). According to Refinitiv, global M&A hit a new record of $1.3 trillion as of March 31st, 2021.[1] What is driving this boom? On the news we have seen many big deals take shape, from GE divesting its business to Canadian Pacific expanding its footprint. But behind the headlines, something else is accelerating M&A activities, especially in the Unites States (US). We are talking about SPAC, which alone represent about 25% of the total deal volume in the US.
The first quarter of this year was also one of the busiest for IPOs, of which, once again, SPACs took the limelight. There were 296 SPACs raising $87 billion, a 20-fold increase over the same period last year.
First, a sponsor raises capital and incurs the cost of an IPO in a new shell company. To make the deal attractive to investors, the units are usually priced at $10 each and provide a warrant to buy more shares. The sponsor then has 12 to 24 months to find the target. If no target is found, or if the investors decide to vote “no” on the deal, the holders can redeem their investments.
We have seen this movie before
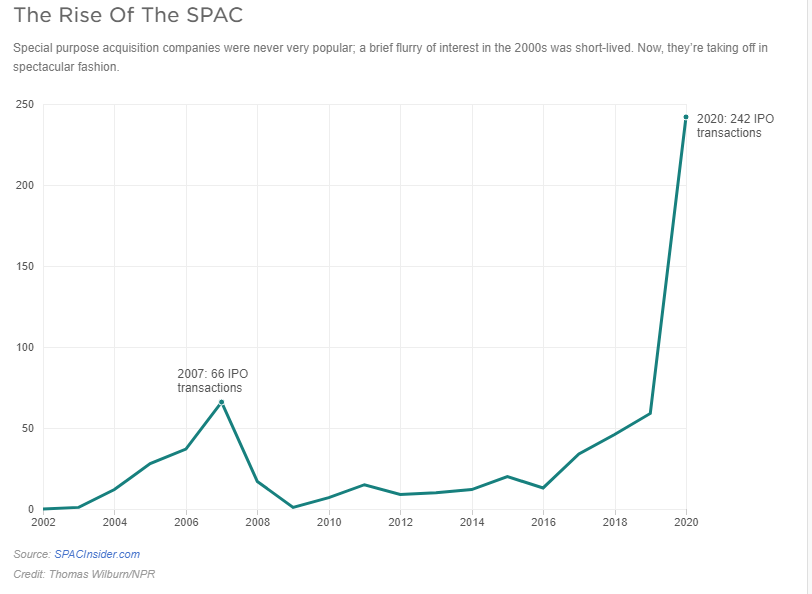
SPACs are in their third decade of existence. In the early 1990s, they were marketed as vehicles that helped small companies go public, while offering outsized favourable terms to their sponsors. In the late 90s, SPACs took a back seat. After all, why would a company do a reverse merger when you could easily raise money during the tech bubble? SPACs enjoyed a renaissance in late 2002, peaking at 66 IPOs just before the great financial crisis. They reappeared in early 2016, and have been going strong ever since. According to SPAC Analytics, in 2020, SPACs were 55% of IPOs, compared to 4% in 2013. So far this year, SPACs represent 79% of total IPOs.
SPACs versus a traditional IPO
SPACs are a pure genius way of going public. Since there is no identified target, a sponsor’s prospectus has no information about the business or the strategy. On the other hand, an IPO roadshow raises a lot of questions and invites a lot of scrutiny from investors.
In an IPO, there is no guarantee on the final valuation of the company. With a SPAC, the IPO has been done, and you have negotiated the valuation of your company with the sponsor. Plus the due diligence required for a merger is much less than SEC requirements for a regular IPO.
Cost could be another key factor. An IPO can cost anywhere between one to seven percent in fees for investment banks. With a SPAC, the underwriter may charge about five to six percent. However, there are other fees associated with the merger, which can end up being almost 20-25 percent of the total money the sponsor may raise.
Why are SPACs so popular?
A recent Wall Street Journal article counted 61 sports-related SPACs formed this year alone, compared to just five in 2019.[2] Athletes from Serena Williams, Stephen Curry, Naomi Osaka, Tony Hawk, Colin Kaepernick, and even Shaquille O’Neal, have shown interest in SPACs.
Everyone loves money, especially free money. SPAC founders and sponsors generally get about 20% of the shares of the SPAC as a fee for raising capital, finding the target, and, of course, giving it their brand name. Hedge Funds like it because they can use leverage to buy SPACs and also get preferential access to SPAC deals at the $10 share price. Everyone else has to wait and likely pay a higher price.
Most investors don’t read the annual reports of the companies they own, so they miss out on the fine print in the SPAC prospectus. For example, many are unaware of the lock-up period, which can be anywhere from six months to a year. Once the lock-up period is over, the floodgates open and add pressure to the stock price.
The clock is ticking?
SPACs don’t have time on their side because there is a limited window to close a deal. Targets are well aware of this restriction. They also know that a SPAC is required to spend at least 80% of its assets on a single deal. So the target always has the advantage. SPACs are paying a median price-to-sales ratio of 12.9, compared to 4.1 paid by other companies, according to 451 Research.[3]
SPAC-mania has been going on for a few years now, which means there is a lot of capital chasing deals, combined with ticking clock syndrome, which signals an inevitable decline in deal quality. We could easily see the SPAC bubble go bust once again.
How have SPACs performed historically?
A team of researchers analyzed completed mergers from January 2019 and June 2020, and found that SPACs lost 12% within the first six months, and dropped 35% on average after the first year. Bain & Co looked at 121 SPAC mergers from 2016 to 2020 and concluded that “more than 60% have lagged the S&P 500 since their merger dates, and 50% are trading down post-merger”. The other 40% are trading below the $10 IPO price.
At Global Alpha, we do not invest in SPACs. Our focus is on finding high-quality companies with defensible business models and strong balance sheets that should outperform the small-cap benchmark.
The assessment in the previous quarterly commentary was that the monetary backdrop for markets had deteriorated at end-2020. This was arguably reflected in weak bond market performance during Q1 but global equities rose further as earnings expectations were revised higher. The monetary indicators followed here continue to give a cautionary message for markets while suggesting that global industrial momentum will slow into late Q3. A summer growth “scare” could trigger a correction in equities and a recovery in defensive sectors.
The market assessment relies on two indicators of “excess” money, which, according to the “monetarist” view, is a key influence on demand for financial assets: the difference between global six-month real narrow money and industrial output growth, and the deviation of 12-month real money growth from a long-term moving average. The entire outperformance of global equities relative to US dollar cash since 1970 occurred during periods when both indicators were positive. Equities underperformed cash on average when either or both were negative.
Allowing for data publication lags, the indicators gave a joint positive signal at end-April 2020. The MSCI All Country World Index (ACWI) returned 33.9% in US dollar terms between then and end-2020, reflecting both a recovery in earnings expectations and a rerating of markets. The “buy” signal, however, was rescinded at end-December following a cross-over of real narrow money growth beneath industrial output growth – see chart 1.
Chart 1
Global equities derated during Q1 – the ACWI 12-month-forward PE ratio fell by 4.2% – but the index nevertheless returned 4.7% as forecast earnings rose by a further 8.6%. Earnings optimism was boosted by confirmation of additional large-scale US fiscal stimulus, which also contributed to continued outperformance of cyclical sectors. The view here, however, is that global industrial momentum is peaking and will slow through late 2021. This would be a shock to the consensus and could trigger an unravelling of recent market trends.
The slowdown forecast rests on the relapse of global six-month real narrow money growth from its July-August 2020 peak – turning points have led those in industrial output growth by nine months on average historically. The lead time on the global manufacturing purchasing managers’ index (PMI) is slightly shorter, suggesting that a new high in the index reached in March will mark the peak of the current upswing – chart 2.
Chart 2
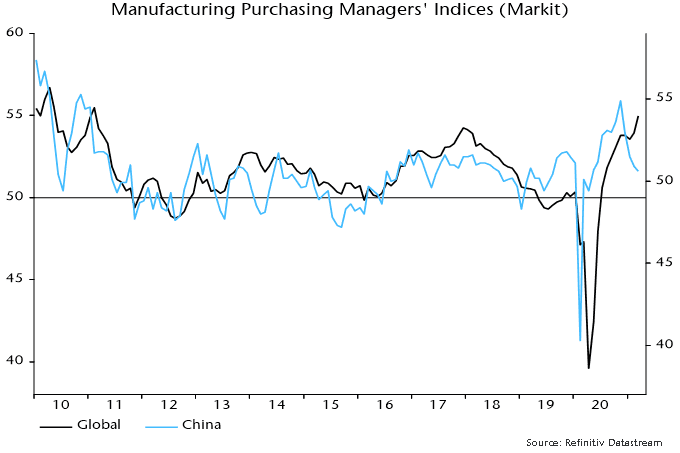
China’s industrial recovery has already decelerated, with the Markit / Caixin manufacturing PMI falling to an 11-month low in March. Chinese monetary policy was less stimulative than elsewhere in H1 2020 and retightened in H2, explaining relatively weak money trends – chart 3. China’s PMI has led the global measure since the GFC – chart 4.
Chart 3
Chart 4
Global six-month real narrow money growth continued to subside in February. A recovery could unfold into the summer as US money numbers are boosted by disbursement of fiscal stimulus and if the PBoC relaxes policy in response to softer economic data. Such a scenario could result in another “excess” money buy signal by mid-year while suggesting industrial reacceleration from late 2021. A money growth rebound, however, is likely rather than guaranteed and the judgement here is that the focus for now should be on downside economic / market risks.
An industrial slowdown could be offset in GDP terms by services strength if covid developments allow economic reopening. This could, however, contribute to industrial deceleration by reversing last year’s substitution by consumers of goods for services spending. Industrial trends are likely to be more important for markets, partly reflecting a stronger correlation with equity earnings. Services-driven GDP strength could make central banks less inclined to offer support in the event of industrial / market weakness.
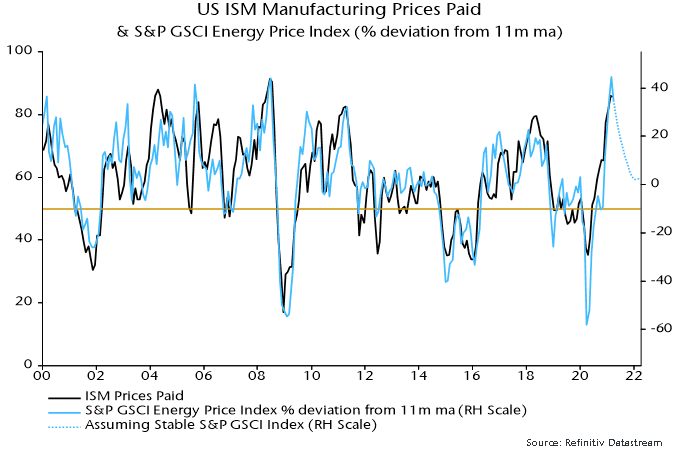
Global CPI inflation rates are spiking higher in reflection of recent commodity price moves and base effects but inflation worries could be near a short-term peak if the above industrial scenario unfolds – another reason for doubting that the cyclical / value rally will extend in Q2. Input price components of business surveys will fall away into the summer barring another surge in oil and other industrial commodities – chart 5. Cyclical sectors may be fully discounting “reflation”, judging by valuation relative to defensive sectors – chart 6.
Chart 5
Chart 6
The March rise in the global manufacturing PMI was driven by European components, with the US PMI little changed and China’s – as noted – easing further. Eurozone strength is consistent with a real money growth spike last summer but a subsequent slowdown argues against current levels being sustained – chart 7.
Chart 7
UK money trends, by contrast, are diverging positively from other majors, signalling a relatively bright economic outlook and possible support for UK equities – chart 3. Money growth strength reflects larger-scale monetary deficit financing than in other countries, which may continue given PM Johnson’s big spender bias and a supine Bank of England. “Excess” money could partly flow overseas, suggesting downside risk for sterling, in which speculators appear to have accumulated a significant long position.
The forecasting approach here uses cycle analysis as a cross-check of the monetary analysis and to provide longer-term perspective. The previous assessment, which is maintained, was that the stockbuilding and business investment cycles bottomed in Q2 2020, while the long-term housing cycle remains in an upswing. The suggestion that all three cycles were turning supportive for the global economy and markets reinforced the positive message from monetary trends in mid-2020.
The next scheduled low is in the short-term stockbuilding cycle. Based on an average historical cycle length of 3.5 years, this could occur in late 2023, with the downswing into the low starting 12-18 months earlier, i.e. in mid- to late 2022. Risk markets tend to weaken in the 18 months leading up to a cycle trough – major equity bear markets have usually occurred during this time window.
The suggestion is that the primary trend in the global economy and markets will remain up through H1 2022. Stockbuilding cycle upswings, however, typically unfold in a zig-zag pattern, with an initial upthrust followed by a corrective phase before a final move higher into the peak. The judgement here is that the initial phase is ending and cycle momentum will diminish into H2, consistent with the monetary forecast of an industrial slowdown. The view that the initial phase is mature is supported by the business survey inventories indicator in chart 8.
Chart 8
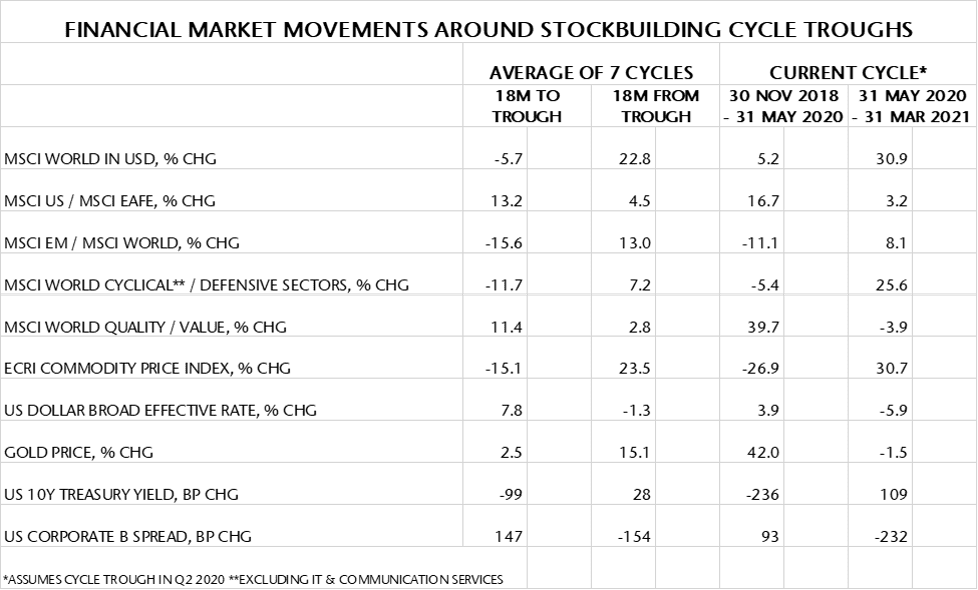
Market moves since Q2 last year, moreover, have in most cases matched or exceeded averages during 18-month periods following previous stockbuilding cycle lows – see table 1. Developed market equities, cyclical sectors and commodity prices, in particular, have performed strongly, suggesting limited further upside even though a stockbuilding cycle downswing may be a year or more away.
Table 1
Source: Refinitiv Datastream, own calculations
A further consideration is that the current stockbuilding cycle could be shorter than average. The covid shock appears to have extended the previous cycle to 4.25 years. If the current cycle were to display an offsetting deviation from the average 3.5 years, the next low would occur in early rather than late 2023 (i.e. 2.75 years from the Q2 2020 trough). This, in turn, would imply that the 18-month negative period for markets ahead of the low would start in H2 2021.
The latter possibility, it should be emphasised, is not the central case here and would require confirmation from a further fall in global six-month real narrow money growth during H1 2021 rather than the US-led rebound suggested earlier.
The comparison of recent returns with stockbuilding upswing averages, as well as supporting the case for reducing cyclical sector exposure in favour of defensive sectors, suggests relative value in emerging market equities, quality and gold, and scope for a further rally in the US dollar. Stronger EM equity performance, however, may be conditional on a recovery in Chinese money growth, probably requiring a prior PBoC policy shift.
These are the views of the author at the time of publication and may differ from the views of other individuals/teams at Janus Henderson Investors. Any securities, funds, sectors and indices mentioned within this article do not constitute or form part of any offer or solicitation to buy or sell them.
Past performance does not predict future returns. The value of an investment and the income from it can fall as well as rise and you may not get back the amount originally invested.
The information in this article does not qualify as an investment recommendation.
Marketing Communication.
This week, Global Alpha is taking a look at one of the more remarkable consequences of the COVID-19 pandemic – the impact on the pet industry. Pets4Homes, the United Kingdom’s (UK) leading free pet classifieds and information site, produced a report on the UK pet trade. At the peak of the first lockdown last May, demand for puppies more than doubled. This is unsurprising given that 94% of pet owners said having the companion animal helped their mental health. Further, 86% said owning a pet improved their mental health, and 84% said having a pet made them less lonely. It is likely that prospective owners wanted to experience the benefits of owning a pet as well.
There were 420 prospective buyers for each puppy offered for sale in the Pets4Homes classifieds, and the average price of puppies for sale in 2020 was £1,875, an increase of 131% from the prior year. And we thought the residential housing market was hot! The demand for cats and kittens also rose during the pandemic, but the average price increased a more moderate 42% from 2019. However, this price dynamic also resulted in more unsavory aspects – the rise of online scams and thefts. Dog thefts increased 170% in the UK compared to 2019.
The supply and demand disconnect has eased somewhat since the peak in May 2020. Increased activity from breeders has helped the supply side of the equation, while gradually easing lockdowns and increased pet ownership has helped slow demand. COVID-19 has undoubtedly given a positive tailwind to a market that was already undergoing structural growth. In 2020, the population of cats and dogs reach 21 million, an increase of 1.4 million from 2017, which in turn increased the estimated market size to £7 billion. The trend of humanizing pets can be seen in the increase in average spending. Dog owners, for example, spend £80 a month on medical treatment, food and insurance. Also, 59% of dogs have some form of insurance, while cats sit slightly lower at 41%.
CVS Group (CVSG:LN), a core holding in the Global Alpha portfolios, is a leading vertically integrated vet services provider in the UK. As well as a large UK presence, CVS Group also operates practices in the Republic of Ireland and the Netherlands. The integrated nature of the business allows CVS group to provide services throughout the life cycle of a pet. The typical life expectancy of a dog is 12 years, while for a cat the life expectancy is between 14 and 17 years. This translates into a lifetime cost of pet ownership for a dog of £16,800, while for a cat, it is estimated at £8,800[1]. CVS Group offers first opinion practices, laboratory tests, specialist referral interventions, online food sales via Animed Direct, and compassionate end of life care and cremation services.
Consolidation of UK veterinary practices has been a significant feature of the market, yet the market is still fragmented. CVS Group is the second largest player by number of premises with over 450 in the UK. IVC Evidensia, a private company is Europe’s largest veterinary care provider, operating over 800 premises in the UK. CVS Group has completed eight acquisitions thus far in the financial year, which ends in June. The focus continues to be on small animals and the company states that the pipeline of acquisition opportunities is strengthening. With a strong balance sheet, CVS Group possesses the funds to continue this strategy.
In a recent trading update, CVS Group continued to exhibit strong growth, driven by the core practices business, but also supplemented by very high growth from the online Animed Direct division. Vacancy rates for veterinary surgeons, the largest determinant of profitability, remain stable, meaning excellent growth at this level also. Around 40% of active small animal customers (430,000 customers), are signed up to the Healthy Pet Club. This service offers discounted products and services for a monthly fee.
To conclude, a rising number of pets, the continued humanization of companion animals and the increased value placed on their care, advancements in treatment and resulting in an extended average life, make the long-term dynamics of the pet market very appealing and Global Alpha continues to see CVS Group as well positioned to benefit.
[1] Pet Care – A Dog is For Life Charles Hall (Peel Hunt), March 22, 2021