Image alt text: Upper left: Old Town Warsaw, Poland during sunset. Lower right: Sunrise over The Blue Mosque, Istanbul, Turkey.

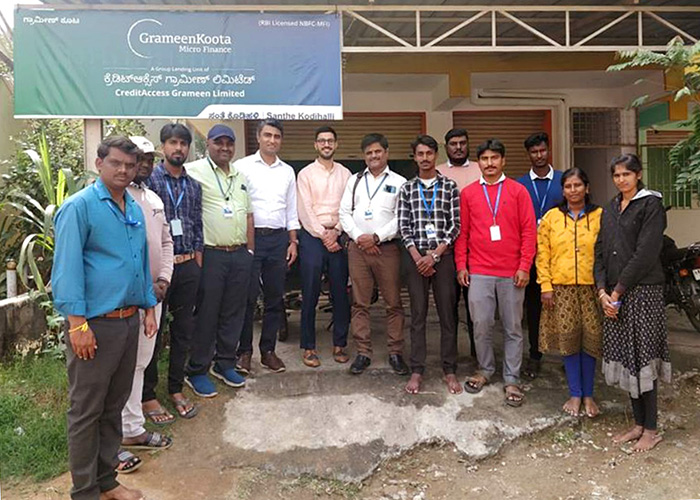
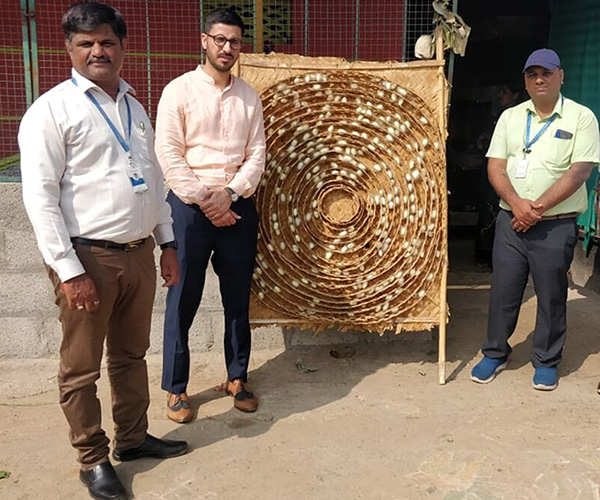
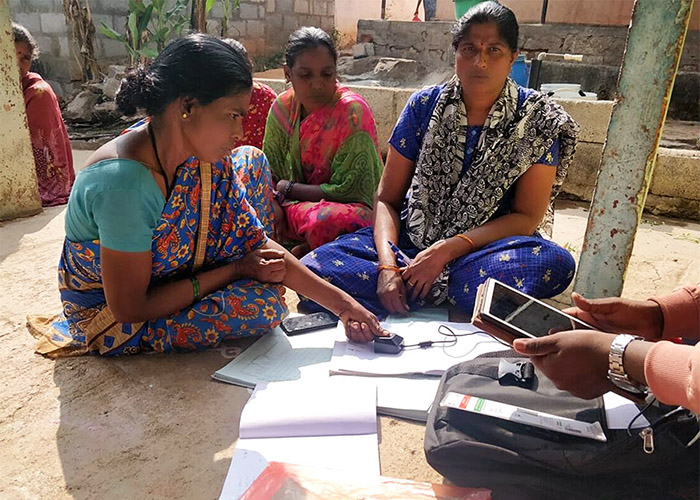
In March, our team embarked on a two-week trip to two of the most dynamic economies within Emerging Markets: Poland and Turkey. During our visit, we engaged with companies spanning a variety of industries – from construction and renewable energy to waste management, IT, commercial services, airlines and airport operators. Also, we gained insights into the consumer sector, meeting with leaders in production and distribution for a wide range of consumer products, including confectionery, fast food, denim, automotive, electronics, soft drinks and beer. The trip’s objective was not only to check up on existing holdings but also to identify nascent opportunities and understand the challenges these businesses face.

Poland’s optimistic outlook

It has been a year since our previous visit to Poland. During that visit, we observed consumers struggling with high inflation, wage growth continuing to decline, public concerns around the upcoming parliamentary elections and hopes for a swift resolution to the war in Ukraine, which would bring peace and vast opportunities for Polish companies.

We were happy to see a rise in optimism regarding these concerns during our latest visit. Most of our interviewees were more bullish this time around. Post the parliamentary elections, we sensed a renewed optimism as a pro-European Union (EU) coalition regained power. The new Polish government seems committed to mending relations with the EU, having successfully unblocked the first tranche of €76 billion frozen by the European Commission due to legal concerns after judicial reforms by the former government. Since joining the union, Poland has been a significant beneficiary of EU funds, receiving approximately €164 billion from 2004 to 2020. For context, Poland’s GDP was €750 billion last year. These substantial financial inflows have contributed to various crucial projects across the country, enhancing infrastructure and improving structural economic growth and overall wellbeing​. No wonder these EU funds are expected to drive economic growth for several years to come. Coming in the form of grants and low-interest loans, this financing is mainly for funding infrastructure and renewable energy projects.

Contrary to last year, this time we saw consumers in Poland enjoying strong real wage growth of around 10%, with no labour market slowdown. With inflation easing to low single digits in the first quarter of 2024, these factors create a conducive backdrop for the robust recovery of Polish consumers. Growing disposable income is likely to not only rebuild their savings but also drive rebound in consumption.

However, the road ahead may be bumpy due to potential inflation spikes in the second half of 2024 on the back of higher energy prices, a VAT hike on groceries, fulfillment of costly pre-election commitments, domestic political tensions and the potential escalation of the ongoing war in Ukraine. The war remains one of the major risks to the region and was a frequent topic in our conversations, not only with corporate executives but also with ordinary citizens. Centuries of conflict between Poland and Russia have left deep scars in the psyche of the average Polish citizen.

Turkish economic reforms and investor confidence

In Turkey, a surprising pivot to orthodox monetary policy last year reignited hopes for economic normalization, buoyed the local stock market and turned foreigners in net buyers for the first time since 2019. Committed to controlling escalating inflation, the central bank raised its key policy rate from 8.5% in June 2023 to a staggering 50% in March 2024. Moreover, the monetary authority signaled its readiness for further rate hikes if necessary. Investors welcomed the government’s adoption of market-friendly measures, which drove the Turkish stock market higher by over 30% in US-dollar terms since the first hike last summer. Simultaneously, foreign reserves have started to recover, sovereign credit spreads have tightened to multi-year lows and the current account balance is expected to get meaningful support from the tourism season starting in May.

Although the recent municipal elections marked a significant defeat for the current leadership, President Erdogan reiterated policy continuity and his commitment to an economic turnaround program in the second half of the year. With no elections for the next four years, the government has time to tackle inflation and achieve long-awaited results. However, this requires the implementation of further austerity measures, including fiscal ones. Current market expectations see inflation peaking in May above 70% before declining to 30%-40% by year-end. However, potential new rounds of minimum wage hikes, premature rate cuts and higher energy prices continue to threaten the turnaround policy and could derail efforts to reduce inflation and improve the trade balance.

Nearshoring opportunities

Despite being influenced by very different forces, Poland and Turkey share some commonalities. In the last few years, the term “nearshoring” has become strongly associated with Mexico and Vietnam. We explored the impact on the Mexican economy in a previous commentary. However, Poland and Turkey have turned out to be underappreciated beneficiaries of supply chain shifts toward near- or friendshoring as a way to reduce reliance on China. Nearshoring opportunities repeatedly came up in our discussions with corporates in both countries. We see Poland as a launching pad for opportunities into Western Europe and hard-to-access markets in the east like Hungary, Romania and Bulgaria. Similarly, Turkey offers a gateway to explore opportunities in CIS countries and less liquid frontier markets. We highlight one such opportunity below.

As bottom-up investors, we focus our macroeconomic analysis primarily on enhancing the risk management aspect of our portfolio management. When investing in highly turbulent economies, we prefer to stick to companies that we believe can succeed even when their domestic economies face challenges. Additionally, we look to benefit from a possible decline in country risk premiums in the event of macro normalization.

Investment spotlight: Coca-Cola Icecek and Mo-BRUK

Our largest position in Turkey is Coca-Cola Icecek (CCOLA TI), a coke bottler. In the last 20 years, the company has evolved from a single-country operator to the third-largest coke bottler globally, with a footprint spanning 12 countries and 600 million people. Icecek generates less than 30% of its EBITDA in Turkey, with Pakistan, Kazakhstan, Uzbekistan and another eight countries in the Middle East and Central Asia accounting for the major part of the business. Robust strategic alignment with The Coca-Cola Company, combined with Icecek’s proven record of successful integration, positions it as the preferred partner for further consolidation of Coca-Cola’s bottling operations in the region.

Bangladesh is the recent addition to Icecek’s portfolio. It is a country with over 170 million people and a heavily underpenetrated non-alcoholic beverage industry poised for double-digit volume growth over the next decade. This positions Icecek well to replicate its successful strategy of distribution network enhancement to ensure product availability, build infrastructure and enrich merchandise offerings. Leveraging its leading brand portfolio and a highly experienced management team, Icecek is set to continue capitalizing on the vast potential of its markets.

Mo-BRUK (MBR PW) is a waste management company in Poland specialized in processing hazardous waste. The founding family established the business more than 30 years ago and has built a strong franchise in an industry characterized by high entry barriers. The company does not operate landfills and focuses solely on processing waste. EU regulations on waste management create significant tailwinds for the industry in Poland, as the country must undertake considerable efforts to meet EU objectives. Due to its specialization in hazardous waste and limited competition due to entry barriers, Mo-BRUK enjoys superior business economics. High margins are driven by volume growth and technology improvements, as well as price hikes due to limited capacities in the country. In terms of growth strategy, the company is conducting several expansion projects within available permits. At the same time, it is filing for new permits. Remediation of the illegal landfills or so-called ecological bombs represents an attractive business for Mo-BRUK, but it is highly dependent on the budget allocation by municipalities. The cadence of such projects is erratic, but the company intends to participate in all tenders as they are announced. Additionally, the management team sees multiple consolidation opportunities in the country. In late-2023, Mo-BRUK acquired two independent operators that not only provided the company with scarce permits but also expanded its footprint in northern Poland.

Bird's eye view over the beach of the coastal side of Mombasa, Kenya at sunrise.

The strategy focuses on investing in frontier and emerging market companies that our team expects will benefit from demographic trends, changing consumer behaviour, policy and regulatory reform, and technological advancements.

Below, we explore some of the key factors influencing returns and share observations on the portfolio and the markets.

Financial Services Portfolio

The strategy saw strong returns from financial services, driven by the financial technology portion of the portfolio. The primary driver of returns at the security level was Kenya’s Safaricom PLC, the country’s leading telecommunication and mobile money services provider, whose share price appreciated by nearly 60% in US dollars in the quarter. This strong share-price performance is largely attributed to a decline in the risk premium attached to Kenyan assets.

Like many frontier and lower-income emerging markets, Kenya’s fiscal and balance of payments position was severely compromised over the last four years as it grappled with a host of global challenges, including high and volatile commodity prices, supply chain tightness, rising interest rates, and a strong US dollar. Domestically, successive droughts and the election of a new government in August 2022 created further uncertainty and negatively impacted consumer confidence (note: agriculture contributes over 30% to Kenya’s GDP and employs over 40% of the total population). Consequently, Kenya was all but shut out of international capital markets, impairing its ability to issue hard currency debt to finance its growing liabilities and leading to a 20% depreciation in the Kenyan Shilling against the US Dollar in 2023. The country’s fortunes began to turn around at the beginning of 2024 as it took advantage of a window of opportunity to issue its first Eurobond since 2021. Kenya enticed investors by offering a relatively lucrative yield of 11.0%, which was oversubscribed five times and ultimately raised US$1.5 billion at a tightened yield of 10.375% with a 10-year maturity. The government’s decision to pay up for capital has so far proven to be the right one as concerns quickly abated over the level of FX reserves and the country’s ability to service a US$2.0 billion Eurobond maturing in June 2024. The result was a compression in yields across the curve and a restored confidence in the Shilling, which, as of the date of writing, is the world’s best-performing currency versus the US dollar (~19% appreciation in the quarter). The significant appreciation in the currency is bringing imported inflation down, and with the start of the rainy season and a better harvest, it should serve to further subdue inflation through lower food prices.

As would be expected, the improvement in Kenya’s economic prospects was swiftly reflected in the share price of Safaricom as well as the broader market. Through M-Pesa, Safaricom is particularly geared to economic activity as it is the dominant platform through which its ~32 million active customers (~60% of Kenya’s population) transact using services like peer-to-peer transfers, bill payments, remittances, and borrowing and saving. In the year ending December 2023, M-Pesa facilitated ~$280 billion of transaction value (nearly 3x Kenya’s GDP), a number that is expected to grow as economic activity picks up and as many of the use cases that management is rolling out are adopted by its large and scaled base of customers and merchants.

Another notable contributor to the period’s returns from the financial technology portfolio was Kazakhstan’s Kaspi.kz, a company we have written extensively about in a previous post. Over the last three years, Kaspi’s management team have been working on a plan to move the company’s share listing venue from London (LSE) to the Nasdaq. Kaspi’s shares have been relatively illiquid on the LSE, with one-year average daily traded value of US$2.8 million, a low percentage of the free-float market capitalisation of over US$3.0 billion. Management have long made the case that the LSE listing undervalued their shares and that the right home for Kaspi as a technology company is the Nasdaq. True to their word, management pulled off the listing in January this year to become the first Kazakh company to list on the Nasdaq (the shares were subsequently delisted from the LSE). Since the listing, daily traded value averaged US$43.0 million, ~15x what it used to trade on the LSE. It is too early to say whether that liquidity boost will underpin a higher multiple on the shares as management hopes, but we are confident in their ability to execute operationally and believe that this will ultimately drive long-term shareholder value. The Nasdaq listing has also been celebrated by the President of Kazakhstan, which we believe should only help reinforce Kaspi’s national champion status and strategic importance to the country’s ambition to draw in foreign direct investment.

Consumer Portfolio

The strategy’s consumer portfolio delivered good performance this quarter, driven by the Philippines’ Century Pacific Food Inc. and Indonesia’s Sido Muncul (Sido). Century Pacific is the largest canned food company in the Philippines, with an 85% and a 52% share in seafood (tuna and sardines) and meat, respectively. Over the last few years, Century’s management have successfully executed an entry into the dairy category, with market share as of end of 2023 reaching ~28% in powdered milk (from 2% in 2016), a strong number two and lagging only behind Nestle, the market leader with a ~60% share.

The milk category is in its infancy in the Philippines, with annual consumption per capita at the bottom of the list among Asian countries. Management believes that milk consumption is at an inflection point and have positioned the company strongly to benefit from the growth in the category over the next decade. The diversification and resilience of Century’s portfolio have served it well in the last twelve months; Filipino consumers have experienced considerable pressure on their disposable incomes from a rise in rice prices and high interest rates which has led them to trade down to categories that offer more value for money. Simultaneously, softer input prices allowed Century to increase its gross profit margins and invest in advertising and promotions to drive demand and reinforce the equity of its brands while thoughtfully increasing dividend payout to shareholders. Momentum seems to also be building in other parts of the Century portfolio, including coconut water where the company announced an expansion of its agreement with The Vita Coco Company, alternative meats where it is now in 1,800 Walmart locations in the US, and pet food where it is making inroads in modern retail doors in the Philippines.

Sido, the herbal medicine company that we have discussed extensively in the past, emerged from a difficult 2023 with a strong exit performance in the last quarter of the year and a promising outlook for the first half of 2024. Sido is one of the most profitable consumer health companies in the world, with EBITDA margins above 44% and return on capital ratios that are consistently in the range of high 20%s to low 30%s. This profitability underpins high cash conversion and allows the company to continually run a zero-debt balance sheet. More recently, the controlling shareholder Irwan family bought out the full 17% stake of Affinity Equity Partners, a private equity investor that had come to the end of its investment cycle in the company. The transaction was done at a 30% premium to the three-month average price, signalling confidence from the family in the prospects of the business, and removing the overhang on the shares that typically arises with late-stage private equity ownership of public companies in our markets.

 Outlook

After three difficult years, we are observing an improvement in the environment for the strategy. We sense more optimism in our discussions with the majority of portfolio companies on their operations and outlook for their businesses. We also see a growing opportunity set for the strategy as investability returns to markets like Kenya, Egypt, Pakistan, and Bangladesh. We also see more opportunities emerging out of ASEAN markets like Malaysia and Thailand, and Middle Eastern markets like the UAE. This has been reflected in the strategy’s cash levels, which have reached a three-year low as of the end of the quarter.

We look forward to continuing to update you on the strategy over the rest of the year.

Silhouette of an oil pump station during sunset in Qatar.

MENA equity markets rounded up the first quarter of 2024 with returns of 3.2% (for the S&P Pan Arabian Index Total Return), ahead of the MSCI Emerging Markets Index, which was up 2.3% in the same period.

While Index-level returns were fairly muted, underlying performance and market activity levels remained robust. In Saudi Arabia, the performance divergence theme that we discussed in past letters picked up pace in the quarter, with the MSCI Saudi Midcap Index gaining 10.1%, outperforming the broader MSCI Saudi Index by ~8.0%. Accompanying this performance was a significant increase in liquidity on the exchange, with average daily traded value (ADTV) in the quarter reaching ~US$2.4 billion, higher by 68% (or nearly US$1.0 billion) compared to the ADTV for the full year of 2023. This surge in liquidity appears to be driven by a combination of domestic and foreign institutional flows, increased primary market activity drawing in new capital, and perhaps most interestingly, the emergence of high-frequency trading (HFT) as a new type of market participant. Estimates from HSBC suggest that HFT contribution to ADTV reached ~15% in March 2024 compared to low single digits in 2023. HFT contribution in our opinion is likely to materially grow in the mix over the next few quarters, driven by the stock exchange’s initiative to provide co-location services and an increase in the market’s capacity to accommodate additional liquidity through increases in free float and new listings. For comparison, HFT’s contribution to Turkey’s stock exchange volumes currently ranges between 25% and 30%. Capital market development in the region, and particularly in Saudi, is a powerful theme that the strategy has expressed through various position sizes depending on valuation through Saudi Tadawul Group, the stock exchange holding company which itself is a listed company on the market.

Another theme the strategy has been building exposure to over the last few quarters is Qatar’s liquified natural gas (LNG) value chain, which received a boost from Qatar Energy’s announcement in February of a capacity expansion plan that will add 16 million metric tons to annual capacity, taking it to 142 million tons by 2030. As the world’s lowest-cost producer of natural gas, with a lifting cost of US$0.30 per MMBTU compared to a range of US$3.0 to US$5.0 globally, Qatar is well-positioned to capitalize on its reserves over the next decade. Emboldened by this cost advantage and the US government’s decision to pause LNG export approvals until after the 2024 elections, Qatar seems intent on getting the most out of its reserves in the next decade. By keeping production high, Qatar will reinforce its position as the lowest-cost supplier to growing Asian markets and secure its role as a key player in the recalibration of energy supply chains that is taking place following the Russia-Ukraine war.

Qatar Gas Transport Company Ltd. (QGTS), the owner and operator of the world’s largest LNG shipping fleet, is a primary beneficiary of this theme. This was recently validated by the awarding of a contract for the addition of 25 conventional size LNG carriers (to an existing fleet of 74 vessels) by Qatar Energy following February’s capacity expansion announcement.

A key event in the quarter was the devaluation of the Egyptian Pound (EGP) in the first week of March. The Central Bank of Egypt (CBE) and the government of Egypt finally capitulated and devalued the currency from just above 30/USD to 50/USD after having held the rate at the former level since January 2023. The devaluation came two weeks after the government sealed a mega property deal with one of Abu Dhabi’s sovereign wealth funds that broadly involved a land sale in exchange for US$35 billion, of which US$14 billion would be in direct cash transfers and US$11 billion in a debt swap on existing UAE debt to Egypt. This substantial deal, equivalent to nearly 10% of Egypt’s GDP, has the immediate effect of reducing Egypt’s external debt by 7%. The floatation of the EGP following the Abu Dhabi deal has unlocked further funding from the IMF, which upsized its loan agreement with Egypt from US$3 billion to US$8 billion. The devaluation and improvement in Egypt’s external balances have opened up the foreign exchange market and cleared the backlog that had built up over the last 12 months. This should bring Egypt back from the brink of an MSCI reclassification from “Emerging” to “Frontier” or “Standalone” as we had seen from FTSE, which removed its special treatment classification following the devaluation.

While there is a lot to cheer about, those familiar with Egypt have seen this scenario before. Our recent conversations with companies suggest there is still a high degree of uncertainty among businesses and consumers. High interest rates (12-month T-bills are ~26% as of the date of writing) and limited progress on the reform front from the government will likely weigh on real earnings growth and keep valuation multiples fairly low. Egypt needs to demonstrate a willingness to make bold reforms that stimulate growth and attract foreign direct investment to break its cycle of reliance on friendly governments and multilateral agencies. In the absence of such reforms, the prospects for a multi-year earnings growth cycle in Egypt seem remote. That being said, we do see a window to potentially generate returns in Egypt in the next six to twelve months as US-dollar returns are likely to be protected over that timeframe given the recent devaluation. We believe the UAE’s Al Ansari Financial Services is an interesting way to play the reopening of the FX market in Egypt through the recovery in remittance flows from the UAE to Egypt. At its peak, Egypt was the third-largest FX corridor for Al Ansari, and thus the potential for an earnings recovery in the second half of 2024 is strong as volumes recover from a near halt in 2023. Under the right conditions, we also anticipate the strategy increasing our ownership of Egypt-listed businesses, details of which we will share if we make material investments there.

We look forward to continuing to update you on the strategy throughout the year.

Loupe focusing on the text "Emerging Market" on financial newspaper.

Calling for the turn in EM performance has long been dismissed by sceptics as investing’s tribute to Samuel Beckett’s play, Waiting for Godot. The story centres on two strangers who both happen to be waiting for a man named Godot to appear, and pass the time by contemplating the meaning of life in a seemingly endless cycle of anticipation and uncertainty.

Defenders of the asset class argue this is too harsh for such a diverse subset of countries and companies, providing ample room for stock pickers to seek out alpha.  On the other hand, EM investors have largely struggled to escape the gravitational pull of a dollar bull market that has lasted for over a decade, illustrated in the charts below.

USD has been both a key signal and driver for emerging market equities
Line graph of the MSCI EM Price Index relative to the MSCI World Index from 1970 to 2024.
Source: NS Partners & Refinitiv Datastream


Was October 2022 a USD secular peak? The recent rally has yet to breach that high
Line graph of the real US dollar index compared to advanced foreign economies, pre-1970 to 2024.
Source: NS Partners & Refinitiv Datastream

 
US equities have been ascendant for nearly a decade and a half, led by the superior earnings growth and profitability of the tech titans. Many large EMs have had to work through sharp recessions, deleveraging, balance of payments issues, foreign capital exodus and related currency weakness. The dynamics create a reflexive vicious circle where these negatives feed on each other, providing a poor backdrop for EM equities.

The result is global allocators herding into US stocks at the most concentrated levels since at least 1929 (see chart below), and within that weighting to the US, we saw the seven largest stocks in the S&P500 grow from 21% of the index to 30% by the end of 2023.
 

The current concentration of US stocks helped to drive an exceptional period of market returns

Line graph showing growth of market cap of the S&P 500 Index between 1980 and 2024.
Source: Goldman Sachs, February 2024. Universe consists of US stocks with price, shares, and revenue data listed on the NYSE, AMEX, or NASDAQ exchanges. Series prior to 1985 estimated based on data from the Kenneth French data library, sourced from CRSP, reflecting the market cap distribution of NYSE stocks.

Going long US equities has been the winning trade for a long time. However, sticking solely with what has worked can risk falling into the behavioural trap of recency bias, and letting opportunities slip by.

Emerging markets have been left out in the cold, and we have hardly been banging the table over the last year or so. Everyone has heard the contrarian bull case of troughing EM economies, earnings, currencies and valuations.

Valuations are compelling
Line graph comparing forward PE and price-to-book ratios for the MSCI EM and MSCI World indicies from 1995 to 2024.
Source: NS Partners & Refinitiv Datastream


EM currencies look cheap (Brazil and Mexico are outliers)
Line graph comparing exchange rates between Brazil, Mexico, China, Taiwan, India, South Africa, Korea and Indonesia from 2015 to 2024.
Source: NS Partners & Refinitiv Datastream

We have emphasised their superior money numbers and better inflation management by EM central banks, providing plenty of room to ease from very high levels of real rates.

However, the clincher in our view is a potential shift globally to positive excess money growth (real narrow money growth in excess of economic growth). This “double positive” condition of stronger money growth in EM than DM combined with positive global excess money has historically been correlated with EM outperformance.

This dynamic is illustrated in the charts below, the first mapping our two monetary indicators to periods of EM out- and underperformance (shading highlights double positive readings), while the second reinforces this with a hypothetical EM portfolio that moves to cash whenever either of the monetary indicators is negative.

Excess money measures mixed, double positive soon?
Line graph comparing MSCI EM Cumulative Return Index, MSCI World Index and excess money measures from 1990 to 2024.
Source: NS Partners & Refinitiv Datastream


Hypothetical performance of excess money switching rule
Line graph showing hypothetical performance of excess money switching rule from 1990 to 2024.
Source: NS Partners & Refinitiv Datastream

As you can see, that blue line for global excess money has been trending less negative and could be about to enter positive territory.

While it may be some time yet for the money and dollar signals to fall firmly in favour of emerging markets, our view is that point is getting closer.

With EM positioning plumbing the depths, catching the upswing in sentiment will reward those non-conformists with the stomach to embrace the uncomfortable.

Upper left: Riyadh skyline at night in Saudi Arabia. Lower right: Dubai skyline and cityscape at sunrise in UAE.

In February, we travelled to Saudi Arabia and Dubai to meet with a long-time holding in Jeddah, attend the second instalment of the Saudi Capital Markets Forum in Riyadh, and visit a newer addition to the portfolio in the United Arab Emirates (UAE).

1. Company visit in Jeddah

Our last research visit to Jeddah was in 2019, a time when the world looked remarkably different, and markets were not accounting for the successful execution of Saudi Arabia’s Vision 2030 transformation.

Located on the country’s Western coastline, Jeddah enjoys a more temperate climate and serves as both a gateway to the holy cities and a bustling commercial port. It has historically been more liberal than the capital, Riyadh, which has recently advanced at the forefront of the Kingdom’s social and cultural evolution.

The Saudia Dairy and Foodstuff Company (SADAFCO), established in 1976 in Jeddah, manufactures and sells Long-Life (UHT) milk, tomato paste, and ice cream under its flagship brand, Saudia. Leading the market in Long-Life Milk (64% market share), tomato paste (56%), and ice cream (31%), the company boasts strong distribution channels with three factories, 23 depots, and almost 1,000 trucks, generating annual revenues of $700 million.


SADAFCO factory, Jeddah.

During our visit, we toured the ice cream and milk factories within the HQ compound, built in 2020 and 1976, respectively. Both facilities impressed us with their high levels of automation and operational efficiency, producing over 50,000 ice cream products and 10,000 litres of milk per hour. The company’s approach to reconstitute milk from skimmed milk powder (SMP) instead of producing fresh milk is advantageous in Saudi Arabia due to limited renewable water resources and recent subsidy removals on cattle feed. Water consumption for UHT milk production is significantly lower compared to fresh milk (under 1.9 litres of water per litre of UHT milk versus over 600 litres for fresh milk). Management have been proactively economising water usage through a water recovery system that collects hot water, cools it to an ambient temperature, and recirculates it in a closed system. This has led to savings of 45 million litres of water per year at an average cost of over $200,000.

Total water withdrawl/production volume

Source: Sustainability Report.

Competitors relying on fresh milk have seen their production costs increase, leading to pressure to raise prices. This situation, along with recent SMP price declines, has supported SADAFCO’s margins.

Gross margins vs. average SMP price vs. product prices

Source: Company, CIAL.

The business has diversified over the years, with the ice cream segment showing rapid growth and recent extensions into out-of-home (OOH) markets, doubling the potential addressable market. We are confident in the brand’s strength, the company’s wide distribution reach, and a strong management team focused on long-term value creation.

2. Saudi Capital Markets Forum in Riyadh

We spent three days in Riyadh, attending the second Saudi Capital Market Forum (SCMF), and conducting site visits across retail, fitness centres, and pharmacies.

The 2024 SCMF hosted twice the number of investors as in 2023, indicative of the growing interest in the market. Many participants were new to the country, and the diversity of the attendees was a notable shift from previous years. On recent flights to Riyadh, we have noticed more tourists visiting for music and sporting events, as well as creatives capitalising on the boom in media spending and domestic tourism – a distinct experience from past trips when we saw mostly business travellers and locals.

There is an appetite to accelerate the learning curve on the country given Saudi Arabia’s weighting in the Emerging Markets (EM) index and historically low involvement with the region. Saudi is not your typical EM, with a per capita GDP comparable to Czechia and Slovakia and a modest population of 36 million people.

GDP per capita (purchasing power parity)

Source: World Bank.

From a socioeconomic perspective, the country lags in terms of human development measures, especially relative to income per capita levels as shown in this chart:

Beyond the country’s cross-sectional nuances, there are well-documented economic and social changes taking place, underpinned by Vision 2030. Each of our visits to the country serves as a snapshot of the remarkable transformation taking place. Even with all the commentary about it, nothing compares to seeing the changes firsthand.

Notable developments in civil liberties include the dilution of the religious police’s power as early as 2016, allowing music concerts, female gyms, and cinemas since 2017, and 2018’s lifting of the ban on women driving. Whilst evident in 2019, it is only more recently that cumulative change alongside growing internal conviction in the country’s evolution have aided a lighter and more liberated atmosphere.

Female participation in the workforce has increased (up to 40% vs. 33% in 2016), impacting sectors differently. Since many women live with their husbands or parents, the rise in disposable income is largely discretionary. Concurrently, growth in leisure options is cannibalising the time previously spent in shopping malls. There is huge excitement for the tourism sector given the government’s willingness and fiscal capability to drive the industry. In healthcare and education, the government once held both regulatory and provisional roles, but is now focusing on the former and setting ambitious privatisation targets.

So, while the typical analyses of conventional EMs may not fully apply to Saudi Arabia, there are plenty of industries with promising growth prospects reflecting the leadership’s long-term goals.

3. Company visit in Dubai

Our final stop was Dubai, where we visited Taaleem, a recent addition to the portfolio.

Taaleem is one of the UAE’s largest K12 school operators, with 16,500 students across 14 private schools offering British, International Baccalaureate, and American curricula. Positioned in the ‘Premium’ market segment, with tuition fees from $15,000 to $20,000, Taaleem also partners with the government in operating 18 schools comprising 19,000 students, where the company earns fixed fees per student as well as variable fees based on academic attainment.


Greenfields International School (GIS).

Unlike Saudi Arabia (16% private education penetration), the UAE has a high private education penetration, driven by a large expat population. The market is expanding, with private enrolments expected to reach 570,000 by 2027. The demand for high-quality schools is increasing as more expats establish roots in the country.

Private education market in KSA is still the lowest in GCC

Source: NCLE Presentation 1Q24.

We visited Greenfields International School, a 1,500 student International Baccalaureate (IB) school in Dubai Investment Park. A substantial proportion of the students are expats from within the region, yet the school is home to 75 different nationalities, reflecting the IB diploma’s broad appeal. Fees average $15,000 but vary widely, ranging from $8,900 for pre-school to $21,400 for the upper grades. Contributing 10% to Taaleem’s total revenues, the school (est. 2007) has improved its performance and ratings under new leadership.

Historically, Greenfields underperformed the rest of Taaleem’s portfolio in Dubai’s Educational Ratings, earning a ‘Good’ and scoring IB exam results below the UAE average. Since a new Principal took over in mid-2021, IB scores and pass rates have improved, and the school’s rating is now ‘Very Good.’ Most recently, Greenfields was recognised as one of Dubai’s top-5 IB schools.

GIS average IB score & pass rate (%) vs. UAE average IB score

Source: KHDA.

Our experience suggests that for private education providers, financial results often correlate with academic achievement and student/parent satisfaction. In the first quarter of this year, the school increased its utilisation rate to 98% from the mid-70% range pre-2023. Construction is underway to add 500 more seats for the next academic year and management feels confident about filling this increased capacity.

GIS utilisation (%)

Source: Company/KHDA.

We believe there is embedded average fee growth as the student base graduates to higher grades from pre-school. The main cash costs for the business are staff, and there is more interest from teachers in the UK and Europe due to lifestyle and earnings advantages. Taaleem benefits from government partnerships and is playing a role in improving education standards. Land is scarce in both Dubai and Abu Dhabi but as an education provider, Taaleem benefits from the government’s earmarking of space for schools and hospitals.

Despite potential risks, such as the UAE’s shifting appeal as an expat destination, we are confident in the quality-price ratio of Taaleem’s schools and expect them to be less impacted, so long as academic achievement and parent satisfaction remain high.

From the strides in Jeddah’s industrial sector to Riyadh’s evolving market landscape and Dubai’s educational innovation, our trip illuminated the swift changes and emerging opportunities within these economies and how tradition and modernity are coming together to shape the future.

Cityscape at sunset captured from a residential skyscraper in downtown NYC.


Michael Mormile, former Citadel portfolio manager, along with Jonathan Hartofilis and Richard Li, are partnering with Connor, Clark & Lunn Financial Group Ltd. (CC&L Financial Group) to jointly launch FortWood Capital (FortWood), a new emerging markets credit investment manager. In connection with the launch, CC&L Financial Group will provide seed capital along with investment from other clients.

FortWood seeks to capitalize on opportunities presented by structural inefficiencies in global emerging markets credit through a diverse portfolio of debt instruments. Michael Mormile explains, “Our approach combines thorough macroeconomic and fundamental analysis with a rigorous risk management framework to effectively manage the complexities of the emerging markets credit landscape and turn inherent market volatility into portfolio strength.”

FortWood’s absolute return and active long-only emerging markets strategies target corporate and sovereign external currency debt. These strategies are designed for clients looking to capture the attractive yields and value discrepancies found in under-researched markets.

“Partnering with Michael, Jonathan and Richard to expand into emerging markets credit is an exciting development for us. The FortWood team’s expertise in these regions and markets provides clients with the opportunity for additional diversification complementary to our existing offerings, along with potentially higher returns,” says Warren Stoddart, CC&L Financial Group’s CEO.

“By joining forces with CC&L Financial Group, we gain not only institutional operational support and global distribution but also a shared culture of excellence that will undoubtedly enhance our ability to focus on what we do best and achieve outstanding results for our clients,” says Michael Mormile.

This partnership, rooted in a strong team and shared principles, positions FortWood and CC&L Financial Group to exploit a growing asset class and new opportunities to deliver better client outcomes.

About FortWood Capital

FortWood Capital specializes in actively managed emerging markets credit strategies. Leveraging its investment expertise and a robust risk management framework, FortWood navigates complex markets and challenging environments to uncover value. Headquartered in Greenwich, Connecticut, FortWood is a part of CC&L Financial Group. For more information, please visit fortwoodcapital.com.

About Connor, Clark & Lunn Financial Group Ltd.

CC&L Financial Group is an independent, employee-owned, multi-boutique asset management firm that partners with investment professionals to build and grow successful asset management businesses. CC&L Financial Group offers through its affiliates a wide array of traditional and alternative investment management products and solutions to institutional, high-net-worth and retail clients. With offices in the US, the UK, India, and across Canada, CC&L Financial Group has over 40 years of history and its affiliates collectively manage approximately US$90 billion in assets. For more information, please visit cclgroup.com.


Media contact:

Rebecca Jan
[email protected]

Global sales contacts:

USA
Eric Hasenauer
[email protected]

Europe & EMEA
Carlos Stelin
[email protected]

Canada
Brent Wilkins
[email protected]

Asian traveler with suitcase next to row of luggage carts at airport.

Summary

  • A bounce in unloved Chinese equities led a positive month for EM stocks, with the MSCI EM Index up nearly 5% in USD terms.
  • Among the leaders was portfolio holding Trip.com, which surged over 25%, reflecting a recovery in consumer demand for travel in China.
  • Korean stocks continued a run of strong performance fed by enthusiasm for the government’s proposed Corporate Value-up Program (covered in detail in last month’s commentary: Super-cheap Korean equities rally on market reform talks).
  • With around a third of South Korea’s population actively participating in the stock market, the reforms have boosted the ruling Democratic Party’s legislative election prospects, its approval rating reaching 40% against 33% for the opposition. The chart below from CLSA shows the turnaround in fortunes since the program was announced earlier in the year.

Korea general election poll
Line graph showing election polling results in Korea, July 2023 to February 2024.
Source: Gallup Korea &  CLSA, March 2024.

  • With less than one month before the election, re-election of the Democratic Party with a mandate to press forward with the reforms could be a catalyst for further outperformance by Korean equities.


AI boom exposes supply chain bottlenecks

The global rush is on to harness an explosion of AI innovation, with investment by hyperscale cloud and consumer tech giants only the first wave of adoption powering demand for the technology.

Waves of AI adoption


Source: Nvidia Corporate Presentation, 2024.


What unleashed this step change? While some more complex neural network architectures and algorithms have emerged in recent decades, the real shift has been the rapid advances in brute processing power that enables machine learning.

The chart below illustrates the yawning gap which has opened up between the power of GPUs (green line) and conventional CPUs (blue line), with the former now capable of executing many trillions more operations per second (TOPS).

Explosion in power of high-end chips
Line graph showing increasing GPU computing performance relative to CPUs.
Source: Nvidia/Arteris, 2023.


The chart also hints at one of the key bottlenecks to scaling AI applications like ChatGPT – aside from the difficulty of meeting the sheer scale of demand for Nvidia’s high-end GPUs –  which is “memory wall.”

To illustrate the concept, one useful analogy we have heard is to imagine an AI server as a steam train, with the GPU being the engine, data being the coal, and the network being the person shovelling the coal. Getting all the juice out of the massive GPU engine depends in large part on how quickly that coal (data) can be shovelled into the furnace.

This is where High Bandwidth Memory (HBM) comes in. HBM is physically bonded to the GPUs in stacked layers via thousands of pins which enable “massively parallel data throughout” (The Pragmatic Engineer: Five Real-World Engineering Challenges).

HBM stack

Source: Semiconductor Engineering, 2023.


This tech enables the data transmission at a speed of about 3TB/second, around 100 times faster than conventional data transfer architecture powering PCs. This speed is crucial given the massive amounts of data that need to be fed into large language models like ChatGPT.

The issue (and opportunity) is that this wave of demand for leading-edge computing tech to power AI is far outpacing supply. HBM costs around five times more than conventional memory, with Korean memory giant SK Hynix controlling half of global supply, and the remainder split between Samsung and Micron. Hynix is set to enjoy a margin boost driven by premium memory products such as HBM, which it forecasts to grow at a 60-80% CAGR for the next five years.

Emerging markets are home to a host of companies like Hynix, which dominate their respective niches in the AI supply chain. Opportunities exist across multiple segments including fabrication, design, and testing capabilities, as well as key components (like HBM) that form the foundations of hyperscale computing that powers AI.

Chinese stocks outperform as stimulus efforts kick into gear

Chinese stocks are plumbing the depths, now trading at a CAPE of around 10X (from 21X in 2021) discounting a deflationary outlook. While Premier Li Qiang attended the World Economic Forum meeting in Davos earlier this year to announce that China met its 5% GDP growth target for 2023, investors were fretting about steepening consumer price declines. The stock market is signalling an increasing risk of corporate bankruptcies (BBC – Evergrande: Crisis-hit Chinese property giant ordered to liquidate) and financial instability in the absence of decisive monetary and/or fiscal intervention.

Will the authorities blink? It is certainly within the Party’s wheelhouse to pivot, especially given the risk that further economic malaise stokes political instability. The abrupt end to zero-COVID policy in 2022 is the most recent pragmatic policy turn under Xi. Could he reprise Deng Xiaoping’s dictum that “to get rich is glorious” alongside an announcement of fiscal stimulus?

That is doubtful to say the least, but recent activity suggests the authorities understand there is a problem. SOE and SOE-linked names outperformed through February on the back of the “national team” (state-backed financial services companies) ploughing US$57 billion into Chinese equities so far in 2024 (China ‘national team’ ETF buying reaches $57bn this year, says UBS). The chart below from fund data provider EPFR shows flows from local Chinese investors into domestically domiciled China funds (blue line) of just under $100 billion over the 12 months to 31st January 2024. Contrast this with negative flows for foreign-domiciled China funds (i.e. for foreign investors) over the same period.

Line graph comparing domestic and foreign investment in China-based equities, March 2023 to March 2024.
Source: EPFR


During the month, Xi Jinping was briefed by the China Securities Regulatory Commission (CSRC), coinciding with the replacement of the Commission’s chief Yi Huiman in favour of former banking regulation veteran Wu Qing (known as the “broker butcher”). Bloomberg noted that the move echoed government efforts in 2016 to boost market confidence by dismissing financial regulators amid a market rout (China Replaces Top Markets Regulator as Xi Tries to End Rout).

A visit to the central bank by Xi last year preceded record levels of lending from the PBoC to the banks in Q4, followed by an earlier and larger than expected cut in the reserve requirement ratio (RRR) in January, which suggests the central bank is now back on an easing track.

Money rates responding to liquidity injection

Interest rate movements in China, 2020 to 2024.
Source: LSEG Datastream.


On the fiscal side, the government revealed a GDP target of “around 5%” at its National People’s Congress, suggesting further modest stimulus is on the way.

We have flagged in previous commentary the risk that deteriorating institutional quality under Xi appears to be crushing the animal spirits of entrepreneurs and consumers. Indeed, we saw Xi tighten the CCP’s grip over the private sector, announcing new anti-corruption crackdowns across a host of key sectors in January.

Tone-deaf policymaking amid a fragile economic backdrop is causing economic paralysis and interferes with the credit impulse. No one is complaining about a shortage of credit. The real issue is a shortage of confidence among consumers and businesspeople. Consumers are hoarding cash in time deposits, while banks aren’t looking to borrow short and lend long to businesses to invest. While all of this is structurally negative for China over the long term, continued policy easing at these valuations could be the catalyst for a large trading rally in Chinese equities.

MSCI China at record discount to rest of EM

Line graph comparing the MSCI China Index and MSCI EM ex. China Index price-to-book and 12-month forward earnings.
Source: LSEG Datastream.
Our strategy is to maintain a modest underweight to China and position defensively while waiting for further confirmation that liquidity is improving.

A display of colorful woven fabrics from India.

One of the perks of being on the road to meet our holdings is the opportunity to see firsthand the daily challenges of running a business. It’s often said that the devil is in the details, and this holds particularly true in emerging markets, where every few kilometres bring a change in culture, customs and language. Some industries demand more from their execution strategies than others, with the microfinance sector standing out due to its complexity. While simple in concept, providing loans to underserved populations is more nuanced in practice.

The birth of microfinance

The microfinance business has its origins in Bangladesh, where Nobel Laureate Mohammed Yunus discovered that, despite their lack of resources, the impoverished were neither lacking in financial savvy nor in reliability as borrowers. In 1983, Yunus founded Grameen Bank, focusing on the strengths of his clients, including trustworthiness and creativity, rather than their lack of formal education or financial resources.

One of our holdings, CreditAccess Grameen (CREDAG IN), mirrors Grameen Bank’s business model and name. Our recent visit with CREDAG allowed us to observe its operations and engage with its customers, 99% of whom are women. As India’s largest microfinance institution, with 1,900 branches, 4.6 million clients and $2.7 billion in assets under management, CREDAG in our view exemplifies how to handle the complexities of a demanding businesses.

Ground-level insights

CREDAG’s strategy emphasizes local engagement and consistently doing the “little things” right. In a nation with 22 official languages, having branches staffed by locals who understand the regional dialect and economy are key. This local presence marks many employees’ first foray into the formal job market, fostering a strong sense of loyalty among them.


Outside a typical rural CREDAG branch in rural Bangladore.

We got to see CREDAG in action, where morning efforts focus on collections and afternoons on new client acquisition. The company’s investment in employee wellbeing, evidenced by providing kitchen spaces, covering grocery costs and reimbursing fuel expenses, further translates to high employee loyalty.

Relationship building – more than just transactions

The local economy in the villages we toured is driven by dairy and silk farming. In fact, the district is India’s largest cocoon silk producer.


A CREDAG client with her home silkworm business. The silkworms are feeding on mulberry leaves.


Silkworm cocoons in a bamboo tray for the local wholesale market.

Building customer relationships

Our participation in collection meetings highlighted the importance of CREDAG’s joint lending model.


A CREDAG collection meeting outside the village temple.

Meetings start and end with pledges, underscoring the powerful psychology of positive reinforcement to change borrowers’ behaviour for the better.

Leadership within borrower groups streamlines the payment process, allowing for relationship building, educational and sales opportunities. With most of its customers having no credit history or verifiable income, local connections (and intelligence) become crucial parts of good underwriting.

We also had the chance to see an income-generation loan being paid out to a dairy farmer.


Receipt for a 2-year, Rs 50,000 loan for buying a cow to be repaid in 104 installments.

Customized innovation: tradition meets tech

CREDAG leads in integrating technology, reducing client onboarding times and introducing new products rapidly. Its core banking solution caters to remote areas. Even with no internet connection, loan applications can be processed offline and then bulk uploaded when access is available. This allows CREDAG to offer flexible repayment options that align with its customers’ income cycle and new products like gold loans to reduce product time to market.

We also saw its technology in action. CREDAG offers cash emergency loans of up to RS 1000 as a complimentary service to creditworthy customers. This is especially beneficial to those in far-flung areas with no nearby bank branch. Customers can scan their biometric details to pull up their account information on the loan officer’s tablet. Once account details are verified, cash is disbursed on the spot. The whole exercise takes less than five minutes!


A CREDAG customer getting her biometrics scanned for account verification.

Details, details, details

Our visit with CREDAG reinforced how small details matter in building loyalty and maintaining operational efficiency. In the case of CREDAG, it translates to a best-in-class cost structure and customer retention ratio. While we recognize the inherent cyclicality of the microfinance sector, our visit helped us appreciate the need for rigorous execution and a deep understanding of the local context to achieve operational excellence.

Hands holding freshly roasted aromatic coffee beans.

Coffee is one of the most valuable agricultural commodities and the most widely used socially acceptable drug, yet few people take the time to understand its significance in modern society and human history. Originating from an Ethiopian mountainside a couple of thousand years ago, today’s coffee market sustains roughly 125 million jobs. With its total addressable market estimated at $468 billion, it’s on track to outpace global GDP, fueled by rising per capita consumption in emerging markets.

Medicinal luxury to cultural staple

Initially, coffee in Europe was a medicinal luxury for the elite. As it became more accessible, it gradually became the favoured drink of both blue- and white-collar workers, embedding itself in Western culture. The first English coffeehouse opened at Oxford University in 1650. By 1700, there were over 2,000 coffeehouses paying more rent than any other trade at the time. Coffee’s exploding popularity can be attributed to the historical British reputation for alcohol consumption; coffee presented a healthier alternative that still offered a communal space for socializing – and it helped with hangovers.

Coffee’s political and economic influence

In 18th century Germany, its popularity even led Frederick the Great to ban it to curb the outflow of money abroad and promote beer, Germany’s traditional beverage. This prohibition spurred a flourishing black market and large-scale protests that lasted four years before being revoked. The impact of coffee in England and Germany, however, pales in comparison to its role in shaping American culture and history.

Coffee and the American Revolution

The famous Boston Tea Party is often cited as the tipping point of coffee in the US. Americans were already avid consumers of tea, coffee and beer at the time and most taverns and coffeehouses offered all three options to their patrons. In an act of defiance against King George’s tea tax, Americans embraced coffee as a symbol of independence, significantly boosting its consumption. From 0.19 pounds per capita in 1772 to 1.41 pounds by 1799, coffee became intertwined with the fabric of the nation, a trend that has only grown stronger with time.

Why coffee captures our attention

So, why is Global Alpha excited about coffee? Are we investing in coffee beans? If you’ve been reading our commentaries for a while, you’ll know that we often seek creative and sometimes indirect exposure to secular themes that we favour. Like most commodities, coffee is a volatile and hard to predict market prone to oversupply and weather events – areas outside our expertise. Instead, we are invested in a company that provides tools for coffee enthusiasts to enjoy their drinks precisely as they want to.

Brewing success in the coffee appliance market

De’Longhi SpA (DLG IM) is an Italian global leader in the production of small domestic appliances, with a market-leading position among European coffee makers. The company designs its premium products in-house and its brand appeal is best-in-class, boasting a 35% global market share in the espresso coffee machine segment. It’s fitting that a company like De’Longhi originated in Europe, where per capita coffee consumption is the world’s highest.

Local success to global expansion

De’Longhi’s initial success lent strong credibility to its brands and has helped accelerate its global expansion in the last decade, especially in the US and Far East markets. Historically, the company sold professional coffee makers through its Eversys brand, but in December it announced the acquisition of La Marzocco to accelerate its leadership in the professional segment. The professional coffee-making market alone is a $5 billion industry growing at approximately 5% annually, driven by a long-term shift from making coffee at home to buying it from coffee shops. Starbucks for example plans to expand its current 38,000 stores to over 55,000 by 2030. This acquisition enables De’Longhi to cover virtually the entire coffee machine space, from budget-friendly to luxury household and high-output professional machines.

De’Longhi SWOT analysis

Strengths

  • Brand recognition in espresso machines (De’Longhi) and food preparation (Kenwood/nutribullet).
  • Strong distribution partnerships globally and owned manufacturing capacity.

Weaknesses

  • The household appliance market is highly competitive.
  • Consumer habits and preferences for coffee consumption are continuously evolving.

Opportunities

  • Expansion of the professional coffee segment following the acquisition of La Marzocco.
  • Opportunities for product innovation.

Threats

  • Consolidation of the distribution market.
  • Valuation of potential M&A targets.

Brewing beyond the bean

Most of our weekly readers, much like ourselves, are probably coffee consumers, yet many of us spend little time thinking about this beverage we crave each morning. This “taken-for-granted” product represents exactly the kind of space Global Alpha aims to invest in for the long term.

Source: Pendergrast, M. (2010). Uncommon Grounds: the history of coffee and how it transformed the world.

East indian female pediatrician and mother measuring the weight of baby girl during a routine medical check-up.

When it comes to our wealth, we often think about assets or money that we own. However, when we’re sick, we realize our health represents our real wealth and the importance of investing in it.

Population surge meets healthcare hurdle

With its rapidly growing population, India faces significant challenges in providing adequate healthcare services to its citizens. The World Health Organization (WHO) projects India’s population to reach 1.5 billion by 2030, making it the most populous country globally. This growth puts immense pressure on the healthcare system to meet increasing demand for medical services and facilities.

India’s bold step with the world’s largest insurance plan

In 2018, India’s Prime Minister, Narendra Modi, launched Ayushman Bharat Pradhan Mantri Jan Arogya Yojana (AB-PMJAY), the world’s largest universal health insurance plan often referred to as the National Health Protection Scheme. The program aims to help India’s most vulnerable population by offering Rs. 5 lakh (~CDN$8,000) per family per year. The plan is estimated to support 550 million citizens across the country, allowing cashless benefits at any public or private impaneled hospital nationwide. This significantly increases access to quality healthcare and medication for almost 40% of the population, covering almost all secondary and many tertiary hospitalizations. It also addresses the previously unmet needs of a hidden population that lacks financial resources. The plan helps to control costs by providing treatment at fixed, packaged rates.

A flourishing market, billions in the making

Since 2015, India’s healthcare sector has been growing at a CAGR of 18%, currently valued at ~USD$450 billion. Narayana Health’s CEO, one of India’s largest hospital chains, estimates the market to be worth USD$828 billion by 2027. This growth is mainly driven by increased spending from both public and private sectors.

India’s healthcare market value (USD)

Source: Frost & Sullivan; Aranca Research; Various sources (LSI Financial Services, Deloitte).

Foreign direct investment and pharmaceutical export

It’s not surprising that drugs and pharmaceuticals comprise a large percentage (63.4%) of foreign direct investment, as Western countries outsource generic drug manufacturing to India to benefit from reduced labour costs. This is followed by investment in hospitals/diagnostic centres (26.6%) and medical/surgical appliances (9%).

India remains the world’s largest provider of generic drugs, exporting $25.4 billion worth in 2023. We view this market as attractive as the competitive landscape has forced new players to innovate as patents expire.

Ajanta Pharma – a beacon of innovation in India’s pharmaceutical sector

We continue to own Ajanta Pharma (AJP IN). It has high exposure to branded generic markets and a leading position in niche categories, with a superior margin and return profile. The company operates across India, the US and more than 30 emerging countries in Africa and Asia, focusing on cardiology, ophthalmology, dermatology and pain management.

Despite being a smaller player in the space with a 0.7% market share, Ajanta maintained this position during the lockdown and outperformed industry growth by 200 basis points. Owned by its founder, with the family retaining close to 70% of the business, Ajanta benefits from over four decades of experience and we believe continues to be in capable hands.

This growth story is a testament to how investment can translate into tangible health benefits, weaving a new narrative of prosperity and the true value of wealth in health.