Background
The Gulf region is comprised of six nations that sit on some of the largest and most profitable hydrocarbon resources in the world. Large and successful investments in the extraction and commercialisation of those resources created tremendous wealth for the region in the last 50 years, with average GDP per capita growing from around $1,000 in 1970 to over $30,000 in 2021.
This transformational growth in a relatively short period of time far exceeded the region’s human capital capacity and necessitated that those nations attract foreign workers to fill the gap. Today, over 30% of the region’s ~50 million population is comprised of expatriate labour (ranging from ~90% in the UAE to ~35% in Saudi), the majority of which are employed in the private sector. In the last ten years, governments in the Gulf have embarked on a series of initiatives to promote the localisation of the private sector workforce (Saudisation) through schemes that encourage businesses to hire local citizens. A bloated public sector funded by dwindling oil revenues pushed labour localisation initiatives to the centre of domestic economic and social policy in the Gulf.
In this research, we focus on Saudi Arabia which is home to the largest population in the Gulf region (~35 million in 2021 according to the World Bank), and where Saudisation is a key policy pillar.
Saudisation has been negative for labour-intensive businesses that rely on foreign workers. That, naturally, has been the area that the market has most focused on. In this paper, we move the conversation to the top of the organisational hierarchy by examining the changes in the nationality of the CEOs of publicly listed main market Saudi companies. While Saudisation does not directly determine the nationality of a CEO, the underlying theme of localisation is indeed relevant and consequential for investors in the Saudi equity market.
Academic research measuring the performance of expatriate CEOs has found that executive characteristics have a measurable effect on company performance. One notable study by Sekuguchi et al. demonstrated that expat executives at multinational companies operating in Japan were more effective at increasing subsidiary revenues compared to their native counterparts[1]. Given the limited breadth of data on this subject, our aim -for now- is to use the data available to present a practitioner’s view on the subject.
Investment considerations
At Vergent, we place great emphasis on understanding the culture of the companies we are invested in. This is a difficult task that we reserve for the companies that we believe have compounding potential and we want to own for the long term. It takes years of interactions with business leaders and their teams to begin to appreciate a company’s culture. As such, our process combines quantitative analysis that captures the manager’s capital allocation track record with an understanding of their incentive structures, what drives them, and what irritates them (generally, we don’t invest in irritable CEOs). In Saudi, a country our team has been investing in for over a decade, this is a particularly difficult area to explore and is made more complicated by the fact that CEO tenures are generally short, they rarely own stock, and there is a reasonable likelihood they are expatriates. This does not compromise the quality of CEOs in Saudi, but simply requires a reframing of traditional management evaluation frameworks to reflect the nuances of the market.
The expatriate CEO
- Expatriate CEOs come from neighbouring Arabic-speaking countries or from the West. American CEOs are a rarity, given the tax treatment of U.S. citizens’ incomes abroad which makes tax-free destinations like Saudi less attractive.
- Many of the Arab expat CEOs built their careers in the region, and so naturally have an advantage over their western peers in the form of a more developed local network and a deeper understanding of consumer behaviour and culture.
- Western CEOs are typically appointed directly into a CEO role. Most would have spent time in emerging markets with a multinational company previously. The advantage those CEOs have over their Arab expat and Saudi CEO counterparts is they tend to have a better grasp of global trends and a global multinational managerial experience.
- The proportion of expat CEOs leading main market Saudi companies has decreased since 2016. Breaking that down, we find that IPOs contributed six expatriate CEOs by 2021, but that their net number dropped from 15 to 13 because of de-listings/mergers and a churn of expatriate CEOs that was filled by their Saudi peers.
Figure 1: Expats lead a decreasing proportion of Saudi main market companies (%)
Source: Saudi Exchange Filings, Bloomberg
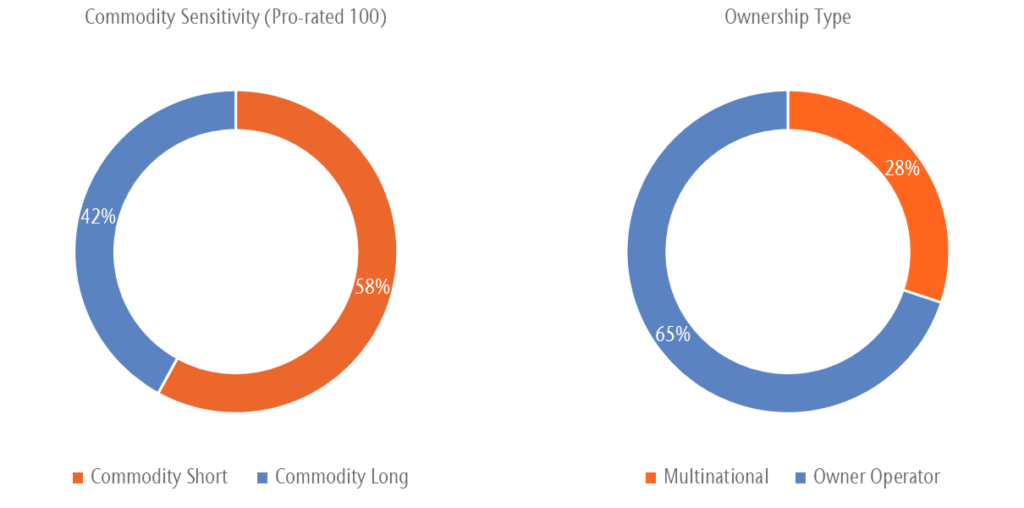
Sector dynamics
- Certain sectors have historically had an above average percentage of expatriate CEOs. For example, in telecoms, two of the three listed companies are majority owned by multi-regional companies (UAE’s Etisalat and Kuwait’s Zain) that have tended to appoint expatriate leadership from within their broader group to run the Saudi units. In addition, the telecom industry requires global experience and technical knowledge that is less likely to be found among Saudi CEOs.
- Banking is another area where expatriate CEOs are over-represented (relative to the average). We attribute this to the presence of global banks in Saudi. Selective appointments made by leading banks to execute on transformational and highly complex growth strategies have also contributed to this over-representation. Al Rajhi Bank, the largest bank in the country by market capitalisation, hired an American CEO in 2015 to help build out and execute their growth strategy before transitioning to a very capable Saudi CEO in 2020.
- Banking as a sector has the highest percentage of Saudisation in the economy. It is therefore expected that we will see more Saudi leadership, even at the traditionally expat-led global banks. Our conversations with those banks suggests that they are increasingly looking to localise at the top. Saudi banks like Al Rajhi have displayed much more agility in the market in the last five years and have materially outperformed global banks who are realising that this competitive environment requires local expertise at the top. A recent example is Saudi British Bank (majority-owned by HSBC) which hired Lama Ghazzaoui, a female Saudi, as CFO in March 2021.
- We find that asset-heavy and cyclical industries have a greater proportion of Saudi leadership. Cement and petrochemicals are traditionally Saudi-led sectors. This is because these are established sectors with a good supply of capable Saudi managers with relevant educational and technical backgrounds. Many of these companies tend to be majority-owned by the state, and so naturally Saudi leadership is desired.
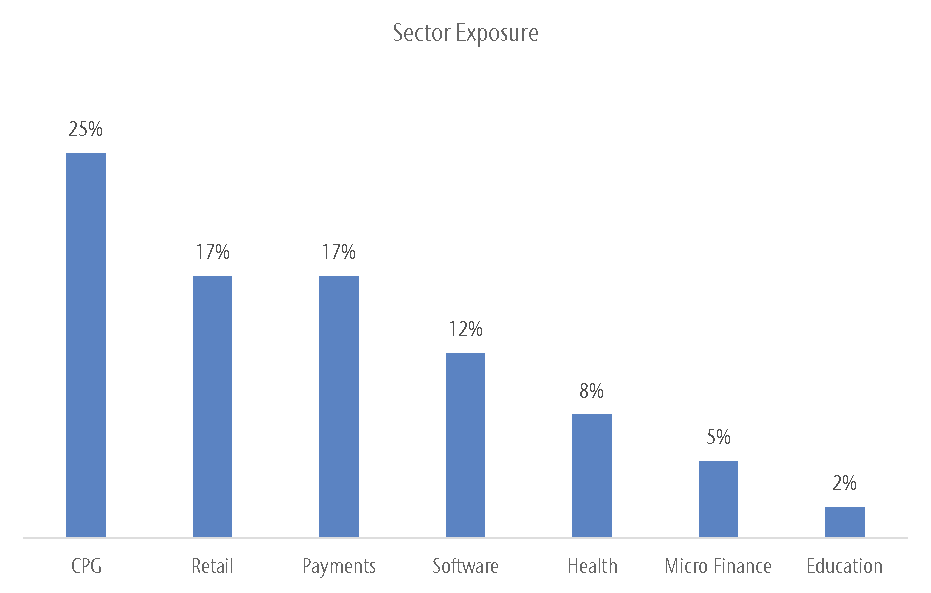
Figure 2: Proportion of Saudi main market companies who have had an expatriate CEO at any time since 2016 by sector
Source: Saudi Exchange Filings, Bloomberg
Family business
- Family-controlled businesses are a notable feature of the Saudi main market. From a list of 169 main market companies with a market cap of over $200 million (excluding REITs), we found that 84 are family-controlled. For clarity of methodology, we define family control as companies where one or more families sit at the top of the shareholder list.
- It is expected that the universe of family-controlled companies will grow as the stock exchange becomes a more desirable growth and exit option for those families. Therefore, an understanding of management dynamics in this area will only grow in importance.
- Family-owned companies are particularly prominent in sectors like building materials, retail, real estate, education, and healthcare.
- Of the 84 family-owned companies, 17 are still run by CEOs from the controlling family (family CEO). We expect the proportion of family CEOs to decline over time as businesses evolve and shareholder structures fragment with the entry of a new generation of family members who are less interested in being involved in the business. In the last two months, family CEOs of two retail companies resigned from their positions on account of operational and institutional underperformance.
- Outsider CEOs (from outside the family) are primarily Saudis rather than expatriates. In fact, 94% of family-controlled companies are run by outsider Saudi CEOs, which is in line with the overall market average.
- Saudi CEOs are better placed to fill professional CEO roles in family-controlled companies as they can manage the different stakeholders and processes involved in a traditionally family-run business.
- We believe there are significant value unlocking opportunities for companies that effectively transition from a family CEO to a professional CEO. Irrespective of nationality, CEOs will need the freedom to operate, and an aligned compensation that preferably includes stock ownership.
Figure 3a: Proportion of CEOs by nationality in family-controlled businesses
Source: Saudi Exchange Filings, Bloomberg
Figure 3b: Proportion of family CEOs leading their family business today
Source: Saudi Exchange Filings, Bloomberg
Tenures
- Intuitively, one would expect the tenure of Saudi CEOs to exceed their expatriate counterparts. Expats often return to their home countries for a variety of reasons and so leave the labour force more frequently. However, the data is inconclusive and suggests nationality is not a determining factor in CEO tenure. It should be noted that we are comparing a small population of expatriate CEOs to a large population of Saudi CEOs and so any observations should be noted in the context of that limitation.
- Family-owned and operated businesses with family executives have less turnover. One example is Jarir Marketing where the founding family has occupied the chairmanship of the Board and role of CEO since it listed the company in 2003.
- A few Saudi business leaders have been called to serve in government. Just this September, SABIC, the largest petrochemical company in the country, announced the resignation of CEO Yousef Al Benyan after he was appointed Minister of Education by royal decree. This impacts the tenure profile of Saudi CEOs.
- We believe that limited stock ownership among professional (non-family) CEOs is a contributing factor to the overall short tenure observed in Saudi.
- We observe that demand for the services of Saudi CEOs is high in the market. In the absence of stock ownership, Saudi CEOs are more likely to entertain and accept competing offers, resulting in tenures continuing to be relatively short.
Figure 4: Tadawul Main Market CEO tenure by sector (Since 2016)
Source: Saudi Exchange Filings, Bloomberg
Summary
- The measurement of management performance in Saudi is an area of research that is nascent and limited by data constraints (i.e., a small number of observations). Any conclusions we make in this paper are therefore largely based on anecdotal evidence, with data used to sense check those conclusions and provide context.
- Localisation and a new generation of Saudi business leaders is likely to see expatriate CEOs become less of a feature in the market. We believe this is positive as it should create more stability in tenures if coupled with aligned compensation structures and less competition for Saudi executives from the public sector.
- Family-controlled businesses run by family CEOs have a great opportunity to unlock shareholder value through effective professionalisation of management.
- We find that analysts and investors in the Saudi market are sanguine about management quality and alignment. There are numerous examples of the market looking through changes in management and not expecting negative future fundamental performance as an outcome.
- We believe management changes carry strong predictive power of future company fundamental performance. Developing an understanding of the people and culture of Saudi companies can contribute to generating significant insights on the quality of a company. This leads to better investment decisions and improves the prospect of generating investment alpha.
[1] Sekiguchi T, Bebenroth R, Li D. (2011). Nationality Background of MNC affiliates’ top management and affiliate performance in Japan: Knowledge-based and upper echelons perspectives. International Journal of Human Resource Management 22 (5), pp. 999—1016.