Outdoor financial stock exchange display screen board.

Summary

  • September was a deeply negative month for stocks globally, with EM declines led in large part by very poor sentiment in China.
  • Cyclical consumer technology stocks in Korea and Taiwan were hit hard as signs emerge that global demand is waning.
  • For the portfolio, high quality and defensive names across healthcare, consumer staples and communications services held up over the period to post positive returns.
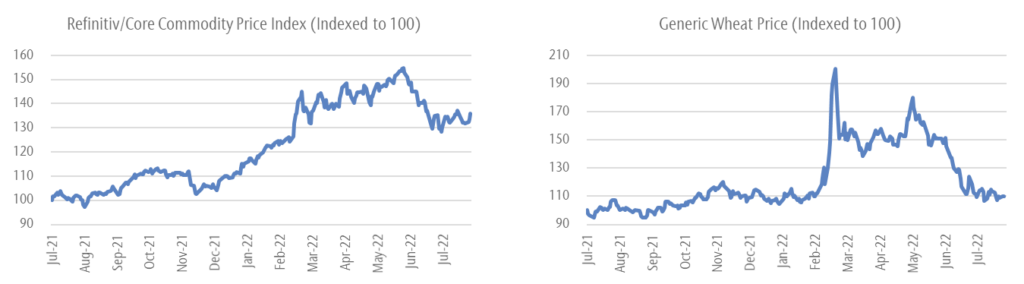
  • Hawkish central banks around the world are determined to kill inflation, even at risk deepening an oncoming recession and as signs emerge that inflation is peaking globally:
    • oil prices have been falling through the quarter;
    • metals prices are easing on soft economic numbers in China;
    • soft commodity prices are falling as grain exports by Ukraine resume; and
    • short term gas European gas prices fall despite war the escalating war in Ukraine and attacks on the Nordstream gas pipelines.
  • Our position for several month has been that inflation is set to collapse, led by rapidly declining liquidity from central banks.
  • Inflation expectations are anchored while global real money weakness suggests a recession through to Q2 2023.
  • Central banks are likely to ignore this and are unlikely to slow tightening unless some structural stresses emerge.
  • China remains attractive as modestly positive real money trends continue to suggest economic resilience relative to other majors.

Portfolio Activity

  • We continue to add to our China overweight.
  • Despite the negative sentiment, liquidity and economic data along with the potential for a gradual reopening could underpin one of the only bull markets for a major economy globally.

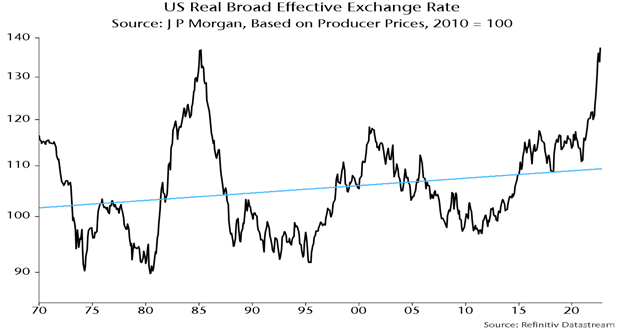
King dollar and the case for EM

  • The dollar is hovering around 40-year highs – this is pressuring economies outside of the US. The Truss-Kwarteng mini-budget market revolt illustrates the fragility brought about by rapidly declining liquidity.

EM secular bears associated with USD overshoots

Chart 1 - US Real Broad Effective Exchange Rate
  • Our view is that sustained dollar weakness will not arrive until the Fed shifts to a neutral or easing policy bias, which we believe is likely to come sometime after Q1 2023.
  • Real narrow money numbers in emerging markets remain stronger than in developed markets, positioning them for relative recovery if USD strength abates.
  • Broadly speaking, EM economies did not (and in many could not) deploy the same level of fiscal and monetary stimulus as developed markets through the pandemic, maintained more orthodox monetary policy and today do not face the same problems with inflation.  
  • Indeed, with the exception of Turkey, monetary policy pursued by EM economies is at its most restrictive level for more than a decade.
  • CLSA noted during the month that emerging markets ex-China maintain a “weighted average real interest rate greater than 4ppt above developed economies” and have enough buffer to put tightening on hold before a Fed pause.
  • Also in favour of EM is the relative improvement in EPS growth which is converging with DM (having lagged over the past cycle), and with further room for DM earnings to correct to the downside as recession bites.
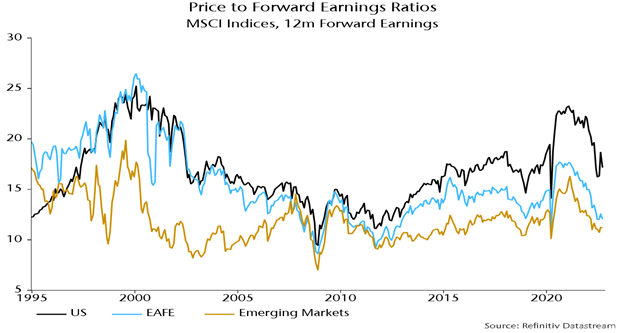
  • EM relative valuations are trading at distressed levels, with stocks looking particularly cheap in China as the Covid-zero gloom and a grinding property slump weighs on investors.

EM valuations below average (but not quite rock bottom)

Chart 2 - Price to Forward Earnings Ratios

Putin under pressure

  • Along with liquidity analysis our process also incorporates qualitative macro factors such as institutional quality and political risk. We believe that the ripple effects of the war in Ukraine reverberate globally and play a part in shaping the shaping the opportunity set of our investment universe.
  • The 22nd annual Shanghai Cooperation Summit in Uzbekistan’s Samarkand was held during the month, which was significant in a number of respects.
  • The Summit marked Xi Jinping’s first trip abroad since the beginning of the pandemic and a potential signal that China is taking the first very tentative steps to reopen.
  • It was particularly notable given the trip coincided with the war in Ukraine taking a surprise turn after a successful Ukrainian counter offensive to retake Kharkiv in the country’s east.
  • Putin now finds himself under extraordinary pressure, not just from hawkish right wing nationalists domestically, but also from other previously more sympathetic national leaders (and major buyers of Russia’s oil) in China’s Xi and India’s Modi.
  • At the outset of the Summit, Putin acknowledged China’s “concerns and questions” over Ukraine, suggesting Chinese discomfort with the trajectory of the Russian leader’s “special operation”. This is a far cry from the “no limits” partnership declared by Xi and Putin in February.
  • Indian Prime Minister Narendra Modi pulled no punches, telling Putin that “today’s era is not an era of war” with the Russian leader responding that “we will do our best to stop this as soon as possible.”
  • Russia’s leader looks more isolated and desperate, and a diminished partner.
  • Particularly so for China which is observing the conflict with interest and drawing lessons with an eye to Taiwan. 
  • In early April we wrote the following in a memo at the outbreak of war in Ukraine:

“The risk of a conflict between the West and China, particularly over Taiwan, was a low probability but rising. We believe that recent events actually slightly lower that risk. There are signs that China did not anticipate the full scope of Russia’s incursion in Ukraine (invasion vs. a “special operation” in the east), signalled by its shifting messaging and failing to evacuate Chinese citizens early in response to Russian moves leading up to the invasion. It is also likely that neither China nor Russia anticipated the strength and unity of the Western response. We believe that given the economic backlash that Russia is weathering, China has a clear picture of the risks associated with further deterioration in Sino-Western relations.”

  • Our view is that events in September support this assessment.
  • Indeed, while Sino-US tensions flared after Nancy Pelosi’s visit to Taiwan in August, Chinese officials over the past few weeks have toned down the public rhetoric and stressed that China will strive for peaceful reunification.
Solar power plant with Shanghai skyline.

“In the land of the blind, the one-eyed man is king.”

Desiderius Erasmus‘s Adagia (1500)


Summary

  • While global liquidity remains poor, EM countries are dealing with a more manageable inflation problem than in DM. Money numbers also point to a better economic outlook for EM.  
  • Interestingly, earnings revisions for EM vs DM are crossing over in favour of the former.
  • These factors combined with a wide valuation gap that has driven poor relative returns over the past decade support a brighter outlook for prospective returns in EM.
  • EM equities were flat over the month, which belies a turbulent period where Sino-US tensions ratcheted up following US House Speaker Pelosi’s trip to Taiwan.
  • Excessive global monetary tightening risks an economic hard landing, with global equity markets pulling back on US Fed Governor Powell’s remarks at the Jackson Hole in late August that the Fed would “keep at it” despite signs of peaking inflation in the US.
  • Pessimism in China remains overdone in our view, real money trends are positive and economic indicators are jumping higher, while valuations remain compelling.  
  • Stronger energy and commodities prices supported stocks in the GCC, Brazil and South Africa, where the portfolio is underweight.
  • Stocks in Europe were broadly flat for the month despite skyrocketing natural gas prices. European leaders face the challenge of boosting ex-Russian gas supplies. There are significant bottlenecks i.e. it will take several years to build regasification plants that will support importation of LNG supplies. Power shortages threaten heavy industries in Eastern Europe, with secondary effects likely to flow through to consumer goods companies in the region.

Portfolio Activity

  • Trading over the period reflects our view that defensive and high quality exposure should be favoured in this environment, while poor sentiment in China presents an opportunity to increase exposure.
  • Trimmed exposure to Thailand on deteriorating money numbers, including taking some profits in oil company PTT Exploration and Production.
  • Trimmed Varun Beverages following a very strong run of performance, allowing us to add to Indian hospital group Max Healthcare through a secondary offering.
  • We have added Qatar National Bank – expected boost from the football World Cup, with another leg of growth via expansion of the gas fields and exports to Europe and Asia.

Sino-US tensions

Speaker Pelosi’s Trip

  • China’s measured response to Nancy Pelosi’s trip reflected a desire to avoid any action that may encourage US retaliation and escalation towards conflict over Taiwan. Presidents Xi and Biden were in direct contact in the days leading up to the trip.
  • Disincentives to a dispute over Taiwan are clear i.e. an amphibious invasion of the heavily armed island by China would come at a great cost and invite US intervention along with a heavy sanctions regime more severe than what we have seen imposed upon Russia.
  • Risks to the semiconductor supply chain as an outcome of the invasion or blockade of Taiwan would be incredibly painful for the global economy.
  • No more so than for China, which would inevitably be cut off from access to essential imports that are at the foundation of its advanced technologies. China had a taste of this when the Trump administration crippled Huawei with sanctions that denied the company access to key technologies.
  • China has thrown over $100 billion at developing semiconductor self-sufficiency but has failed to materially narrow the chipmaking gap between it and the West.
  • While extremely costly (likely many multiples of what the CHIPS Act proposes), the West will be able to establish self-sufficiency and cement a significant tech edge over China.
  • While Taiwan is a leader in semiconductor manufacturing, with c.92% share of advanced semi manufacturing, it is linked into a complex global supply chain. To illustrate: “[e]ach segment of the semiconductor supply chain has, on average, 25 countries involved in the direct supply chain, and 23 countries involved in supporting market functions. In fact, a semiconductor process could cross international borders approximately 70 or more times before finally making it to the end customer.” (Accenture report, 2020)
  • While seizure of Taiwan would give China access to Taiwan’s semiconductor assets, it would not necessarily bring it closer to self-sufficiency given that it would lead to it being cut off from the wider supply chain. Not only this, but the immense technical complexity of chip production (involving hundreds of steps and where a few specs of dust or silicon impurity can derail the entire process) requires a level of know-how and experience developed over decades, and is not something where the reins can simply be passed on to new (and compliant) management.
  •  This is an issue we are monitoring closely and factor into our framework of macroeconomic analysis that produces our country rankings which captures the forecast direction of political risk and also long term governance scores.

Is China approaching a turning point?

  • China’s economy continues to stabilise. Corporate financing conditions continue to ease, reflecting the acceleration in money growth over the past few months.
  • Manufacturing indicators are jumping higher, auto sales are surging, and home sales are no weaker than in the US. While caution over the state of the property market is warranted, the “classical” property bust is one precipitated by a tightening of credit conditions. We currently see the opposite in China today.
  • While we are not expecting China to enter a boom, conditions are better than what market sentiment suggests.

Congress, stimulus and “the mother of all reopenings?”

  • The CCP’s Politburo announced that the 20th Party Congress will take place on October 16. Could this be a catalyst for Chinese stocks?
  • It is likely Covid-zero measures will remain tight in the lead up to Congress, with stability the priority as Xi looks to cement his place alongside Mao and Deng as one of the three towering CCP figures of the party’s century in power, and secure an unprecedented third term.
  • Beijing reiterated its commitment to avoid “excessive stimulus” in the interests of promoting sustainable growth, making the prospect of the government meeting its GDP growth target of 5.5% remote.
  • The government announced a modest 19-point stimulus package including 300 billion yuan ($43.7 billion) for policy and development financial tools. While positive, the real boost will come from a relaxation of Covid policy.
  • There is cause for some optimism, with news suggesting that the approval of a domestically-produced mRNA vaccine candidate is not far off. CLSA has reported that Chinese pharma group CSPC has the candidate most likely to be approved, with preliminary data suggesting a low level of side effects versus international peers, high efficacy, and relatively high storage temperatures. The expectation is for further efficacy data to be released in October before final approval in November.
  • In any case, we think it is unlikely that restrictions will be relaxed in the short term (3-6 months). In Chengdu this month it took just 156 cases for officials to lockdown a city of 21 million people.
  • Our view is that while there are some signs of policy shift – i.e. President Xi’s first foreign trip since the beginning of the pandemic to Kazakhstan will take place in mid-September – zero-Covid is a signature policy for Xi. There are also fears that China’s healthcare system will struggle to cope with a massive influx of patients on any loosening. This makes it more likely that a shift away from this policy will be gradual (likely boosted by a new vaccine rollout).
  • With this in mind, our approach is to continue adding to our China overweight as a whole, but without going overweight cyclicals in this market until we begin to see more of an acceleration in the economy.

China is the “Saudi Arabia of renewable energy”

China Dominance of the Solar Supply Chain

Source: US Department of Energy, 2022.

The weak absolute returns in the period reflect a very challenging investment environment for our strategy. Our focus on African and Asian companies and through-the-cycle underwriting process puts us at a cyclical disadvantage when food and oil prices experience sharp and sustained inflation. The consumer basket in our markets is over-indexed to those basic commodities, and the fiscal and balance of payment dynamics of most developing countries (where we exclusively invest) are inversely correlated to commodity prices.

While we invest in companies rather than countries, our portfolio construction process is primarily top-down driven and aims to produce a healthy mix of factors including country, sector, market capitalisation and valuation. The strategy will always be geared to domestic themes and entrepreneurial businesses which naturally results in the portfolio being under-indexed to straight commodity plays or interest rate sensitive large state-owned banks. Nevertheless, we generally do not try to make oversized single sector bets, as we have the luxury of picking exceptional businesses across a wide geography without heeding to any particular index.

As active and long-term investors, portfolio turnover comes from three sources:

  1. Positive thesis: a new buy or an increase in investment in an existing portfolio company, or an exit or reduce in an investment that reached a level that we deem to be full value
  2. Break in thesis: an exit on a break in thesis on a company due to high forecast error. These forecast errors typically come about when we underestimate competitive intensity, did not anticipate adverse regulations, or don’t agree with capital allocation decisions by management teams. Note that in these situations, the decision is typically to exit the investment, rather than reduce
  3. Change in environment: an exit or a reduce due to a change in the macroeconomic environment that overwhelms the positive attributes of the business we underwrote for a longer period than we think is tolerable  

Year-to-date, the majority of our decisions can be classed under the last point. The macro environment in Egypt and Pakistan has materially worsened after the Russian invasion of Ukraine and as a result we exited two companies in the former and one company in the latter, and right sized our portfolio in both countries. We also selectively reduced exposure in Kenya in response to the same changes in the macroeconomic environment. As a result, cash has experienced the largest percentage increase in the portfolio.

More recently, we started to selectively put cash to work, focusing on companies we previously shunned on valuations and portfolio companies that have de-rated to levels that make them attractive for re-investment. All of those investments are in Asia as we still believe certain countries there will prove more resilient compared to their peers in Africa and other markets we invest in.

As global recessionary fears grow, we see a silver lining emerging in the form of softer commodity prices, which if sustained, will provide much-needed relief to developing market economies. Unless a recession proves deep, we think lower commodity prices will be a net positive to those countries. Moreover, we believe many of our portfolio companies will be resilient through a recession given the nature of the products and services they sell and/or the type of customer they target; supported by very healthy balance sheets and potential margin expansion they can experience if commodity prices continue to come off.

Figure 1: commodity prices

Chart of Refinitiv/Core Commodity Price Index. Chart of Generic Wheat Price.
Source: Bloomberg

Figure 2: country and region exposure

Country Exposure. Indonesia: 20%. Morocco: 14%. Philippines: 14%. Kenya: 10%. Vietnam: 9%. Egypt: 8%. Kazakhstan: 5%. Malaysia: 5%. Other: 4%. Pakistan: 2%.  Regional Exposure chart showing Asia with approximately 50%, Africa with approximately 40%, and Other with approximately 10%.
Source: Vergent Asset Management


Figure 3: portfolio ownership type

Commodity Sensitivity (Pro-rated 100). Commodity Short: 58%. Commodity Long: 42%. Ownership Type. Multinational: 28%. Owner Operator: 65%.
Source: Vergent Asset Management

Figure 4: sector exposure

Sector Exposure. CPG: 25%. Retail: 17%. Payments: 17%. Software: 12%. Health: 8%. Micro Finance: 5%. Education: 2%.
Source: Vergent Asset Management

To support our investment decisions in this difficult environment, our team has visited four countries in the last two months, with a focus on portfolio companies rather than new idea generation.

Our first trip was to Morocco where we visited LabelVie, the leading grocery retailer in Morocco and a core holding in the portfolio. Our bullish view on LabelVie as the long-term winner in Morocco’s grocery market was reinforced after our trip. The company operates in a market dominated by traditional trade (+85% of the market) and a limited set of modern chained competitors. Morocco is a country with supportive demographics, solid balance of payments fundamentals, and a self-sufficient export-oriented agricultural economy which we think is always supportive for the development of the grocery retail industry.

We are most excited by Atacadão, the company’s cash & carry format, which targets traditional retail and professional buyers. The business sells bulk-packaged fast-moving consumer goods at the lowest price in the market (examples are cereals, rice, sugar, edible oils, beverages, laundry detergents, etc.). With Atacadão, LabelVie is enabling traditional trade rather than competing with it, a much less capital-intensive growth strategy. In some respects, Atacadão is disintermediating the antiquated, highly complex, and multi-layered fast-moving consumer goods (FMCG) distribution system that exist in many of the countries where we invest. These systems produces many negative externalities including inflation and wastage, which end up in higher consumer prices and lower retail margins.

After a few years of experimenting with the format, management seems to have cracked the code on Atacadão and is now looking to double store count to 26 within three years. Atacadão’s stores are approximately 30k square feet in size, carry around 4k SKUs, and are designed to maximise natural lighting to lower energy usage and keep operating costs down. The stores are strategically located near large catchment areas with supportive infrastructure to enable easy access to and from store. Each store has two sets of checkout aisles dedicated to professional buyers (cardholders, of which there are +35,000 today) or walk-in customers who are typically community shoppers.

This dual checkout system provides the company with a tremendous data asset, which they use to direct promotions or generate insights to brands (note that brands lose the data in the traditional distribution model). Uniquely, both national and global brands like Coca-Cola and Unilever deliver their products directly to Atacadão stores, reducing logistics investments and freeing existing warehouses and distribution centres for their other fast-growing retail format, Carrefour.

The Carrefour banner is another part of the LabelVie story that is delivering strong growth and gaining share in the modern grocery retail market in Morocco. The store’s focus on fresh produce, bakery, FMCG, and alcoholic beverages to generate footfall and utilise a price matching strategy with discounters to bring in shoppers from all income levels.

LabelVie’s key strength today is the ability to leverage its multi-brand platform to negotiate favourable terms with suppliers which it then transfers to shoppers (by lowering price) and shareholders (by increasing margins or subsidising store capex). We also had the privilege of spending time with the group’s new CEO, Naoual Benamar, a Procter & Gamble veteran whose appointment marks a new era for the company. Naoual spent the past three years at LabelVie before taking over from the founding CEO Zouhair Bennani, who continues to serve as Chairman.

Overall, we think the market is behind the curve on valuing the potential of Atacadão and Carrefour and see LabelVie as a multi-year secular growth story.

Figure 5: inside an Atacadão store (left) and Vergent team with LabelVie management (right)

Source: Vergent Asset Management

Our next trip was to Almaty, Kazakhstan where we spent nearly a week trying to learn everything we can about Kaspi.kz, a portfolio company that we discussed in detail in previous letters. We saw firsthand just how entrenched Kaspi is in the daily lives of Kazakh consumers and businesses. Whether it was a street performer, a small bakery, a Zara store in an upmarket mall or a McDonalds in a residential neighborhood, Kaspi consistently ranked as the most popular payments method for consumers. Kaspi’s operational excellence, hyperlocal strategy, obsessive focus on customer experience through Net Promoter Scores (NPS), and understanding of how incentives drive behaviour allowed them to build an unrivaled two-sided proprietary payments ecosystem so powerful that it even leapfrogged Visa and MasterCard – two of the largest and most well-funded payment networks in the world.

Kaspi is constantly looking at ways to drive value within its ecosystem. One example is in Marketplace, where Kaspi ranks as the leading online marketplace in Kazakhstan and where payments services sit neatly alongside BNPL, logistics and advertising products, all of which drive GMV growth and increase monetization.

Even in an offline environment, Kaspi leverages its merchant acquiring asset and consumer app to generate sales to merchants in-store through targeted promotions and sales activities, creating more opportunities for buyers and sellers to transact. We were fortunate to spend time with members of the senior management team who reiterated how the company is centered on its NPS score, which not only drives new product ideas but also serves as the primary KPI for management compensation. This was most evident during one of our unaccompanied visits to a Kaspi branch, where we were delighted to receive an Apple Store-like customer experience, with staff happily assisting us in navigating the very futuristic (and Kazakh/Russian language only) ATM.

We also had the privilege of spending two hours with Kaspi’s CEO Mikael Lomtadze at his office in Almaty, where we got to hear the Kaspi story from the man credited with turning the company from a failing corporate bank into the super-app of today. It is rare to get audience with Lomtadze and so we took the opportunity to ask him tough questions to which we believe we received candid and thoughtful answers. In this meeting, it became evident that Mikael’s clear vision and operational execution which focuses on customer experience, technology, and big profit pools are very much responsible for Kaspi’s success.

Kazakhstan remains in a political bind due to its proximity and links to Russia, as well as the evolving and fluid domestic political scene which we covered in the last letter. This complicates the bottom up thesis on Kaspi, but by no means breaks it. We believe the market fails to properly appreciate that Kaspi has entered a sweet spot where every product launched will have an unusually high rate of success because it is released into a scaled and highly engaged ecosystem with multiple virtuous cycles running simultaneously. We still firmly believe that the risk-reward on Kaspi sets up the strategy for significant upside down the line.

Figure 6: Kaspi QR code in retail and a photo from our visit to a Kaspi branch

Source: Vergent Asset Management

Figure 7: Kaspi.Kz app interface

Source: Vergent Asset Management, Kaspi.kz

Later in the month, we made our way to Indonesia where we spent four days between Jakarta, Semarang, and Surabaya.

Figure 8: journey from Jakarta to Surabaya via Semarang

Google map showing the driving distance between Jakarta and Surabaya (791 km = about 9 hours & 55 minutes).
Source: Google Maps

We met with several companies including Sido Muncul, a business we have written about extensively in the past. While we had previously visited with the company, this was the first trip to their manufacturing facilities in Semarang, in Central Java.

What stood out as soon we entered the Sido Muncul campus was the tranquil atmosphere. The facility is set among lush greenery and the scent of herbs used in production gave the place more of a yoga retreat vibe than a manufacturing facility. We were surprised to see the extent of technological advancement of the manufacturing process, given that the reins are still held by the founding family and that the primary formulation dates back to a recipe first recorded by the founding grandmother in the 1940s.

The company’s new facilities all run off a single dashboard and the German-made machinery does the rest. Production efficiency is critical to optimising yields, which leads to higher per ton values, more sales, and higher margins. While the Tolak Angin brand remains the biggest moat of the company in our view, the complications of sustainably sourcing over 900 herbs from local farmers, scaled manufacturing process, and wide distribution reach reinforce Sido’s dominance in the market. With margins that exceed Coca-Cola’s, Sido is a cash machine that still manages to grow in the low to mid-teens. Investors have long called Sido a single product company, and to a large extent it is. However, our view is this single product is extremely valuable and has a much longer growth runway than the market gives it credit for.

In addition, management’s focus on innovation and new product development can support growth beyond Tolak Angin; our channel checks in retail showed that Sido is becoming a force to be reckoned with in the supplements and vitamins category. Those new products will take time to contribute given the growth of the core Tolak Angin product but are all positive steps that reinforce brand value and set up premiumisation routes for years to come.

We also came away impressed with Sido’s sustainability initiatives:  herbal waste now produces ~40% of the plant’s energy requirements and investment in solar panels is visible on plant rooftops. For a traditional herbal medicine company, Sido is progressive and modern. As a consumer company, it stands out due to its low input FX requirements, limited global raw material exposure, and strong pricing power.

Figure 9: Vergent team touring parts of the plant with Sido’s Head of Manufacturing

Source: Vergent Asset Management, Sido Muncul

Figure 10: photo op with Mr. Irwan Hidayat, major shareholder and 3rd generation of the founding family of Sido Muncul

Source: Vergent Asset Management, Sido Muncul

Figure 11: Sido supplement and vitamin products in retail

Source: Vergent Asset Management

Our final stop was in Malaysia where we spent time with Mr DIY’s management team in Kuala Lumpur. MR.DIY is a leading multi-price point retailer with 947 stores across Malaysia. Given its name, many market participants describe it and benchmark it as a home improvement retailer. We are puzzled by that confusion as the store format, average ticket size, and pricing strategy all point to MR.DIY being more of a dollar store or fixed low-price retailer (similar to  Dollar General, Family Dollar, and Dollarama). The MR.DIY store is typically about 10k square feet in size, carries 18k SKUs of fast moving non-grocery items with a focus on home, garden, hardware, and electrical. Like LabelVie, MR.DIY seems to have gotten the formula down: low prices, assortment, and locational convenience underpin their customer proposition and their attractive unit economics (payback periods of around 2 years).

The company is data-driven and uses a scientific approach to inventory management, which leads to an iterative and more efficient process over time. The company rewards its staff by distributing the excess of targeted level of margin per store. This incentive program naturally drives efficiencies and allows for more margin to be invested back into low prices. Staff are collectively incentivized to keep the stores in tip top shape. Online risk appears to be low due to the nascence of the e-commerce infrastructure at the price point that Mr.DIY clears at. The experience of Dollarama in Canada suggests that the online threat can be managed and we think Malaysia is years behind Canada in terms e-commerce penetration. Consumers may shop for electronics online, but will buy low value daily items from MR.DIY or competing store that can offer similar value. Furthermore, it is easy to see how one would leave the store buying much more than initially planned. The plethora of ‘things you didn’t know you needed until you saw them’ at very low prices is astounding.

On the ground, we observed how busy the stores are and the wide range of customers they serve, including families, young couples, and tradesmen depending on the time of the day and the location of the store. To our surprise, we saw many copycat stores that use the MR.DIY colour scheme as we drove outside Kuala Lumpur, a positive signal for the brand in our view. Like many of our portfolio companies, MR.DIY is majority founder/operator owned. Unlike all of our companies however, the founder, Mr Tan Yu Ye (YY), rarely meets investors and instead the company’s CEO Adrian Ong is given corporate and finance responsibilities while YY focuses on operations. Adrian owns 0.6% of MR.DIY (~$25 million) and is a former private equity executive who has a very good handle on the numbers and the business. This split of responsibilities is unusual but not necessarily bad for the business as each individual focuses on their areas of strength. Our investment thesis on MR.DIY was reinforced by what we observed on the ground and the strong unit economics of the business, which we will receive a boost from the reopening of Malaysia’s economy and the easing of global supply chain stresses in recent months.

Figure 12:  Front of a busy MR.DIY store in Kuala Lumpur (left) and our team inspecting the aisles (right)

Source: Vergent Asset Management

Figure 13: Vergent team with Mr. Adrian Ong, CEO of MR.DIY

Source: Vergent Asset Management

As markets adjust to the new economic realities, we see a strong opportunity set emerging for the strategy. We believe that choppy and volatile markets offer fertile ground for fundamental stock pickers. A few of our portfolio companies also stand to benefit from this environment as their competition weakens and their bargaining position strengthens. While risks are elevated, valuations in certain areas are starting to more than bake in these risks and we are gradually and selectively rebuilding exposure in our favourite businesses.

Vergent Asset Management LLP

Photo of Michael Mortimore

Michael Mortimore, NSP’s Client Portfolio Manager spoke to WealthBriefing on how analysis of liquidity cycles can help provide discipline in stock selection and asset allocation.

Michael joined NS Partners in February 2022, and previously worked at Somerset Capital and Macquarie Bank.

In the article, he explains how watching the flow of money from central banks can guide decisions on investing in those economies. He illustrates this theme using current emerging market examples, such as southeast Asia. According to Michael, “Our thinking behind exposure to the region was partly the chance that oil prices will stay high for longer, along with strong commodity prices and supportive money numbers. These markets have had a really good run this year and have recently been a source of cash for us.”

The article was published on August 11, 2022 in WealthBriefing, and was syndicated in WealthBriefing Asia.

Read the full article now.

The strategy experienced a perfect storm of negative risk events during the quarter, starting with the unrest in Kazakhstan in January. This was followed closely by the Russian invasion of Ukraine at the end of February.

The unrest in Kazakhstan proved to be short-lived yet significant in terms of the changes it brought to the political landscape. Former President Nazarbayev was removed from the chairmanship of the National Security Council and several of his key allies were detained in what has been described as a targeted purge. Nazarbayev ruled Kazakhstan since its independence in 1991, before handing over the reins to President Tokayev in 2019. Nazarbayev’s “retirement” was largely cosmetic as he continued to rule behind the scenes, cultivating his status as the father of the nation, and enriching his family and friends in the process (even the capital city, Nursultan, was renamed after him in 2019). Galvanised by the protests, President Tokayev and his camp turned on their old boss, swiftly eliminating him from Kazakhstan’s political life and offering up a range of compromises to protesters under a reformed “New Kazakhstan” agenda. Naturally, with these seismic shifts in the political environment, our investment in Kaspi.Kz suffered, losing 57% of its value in the quarter. In fact, Kaspi.Kz accounted for nearly a quarter of the strategy’s returns in the period.

So, what did we do in response to these changes and how do we feel about our investment in Kaspi.Kz today?

As the events unfolded, we took the decision to reduce risk first and sold approximately 30% of the investment at a price of ~$110/share (for context, Kaspi.Kz GDR shares closed March 2022 at $50/share on the London Stock Exchange). It is important to explain why we didn’t sell more of the stock: the Kaspi app is one of the few true “super-apps” globally, whereby each separate business (payments, e-commerce and consumer finance) combine to create a powerful network effect. This has two key benefits. First, that Kaspi are able to earn on multiple parts of the transactions that take place through their ecosystem, thus supporting strong unit economics. Secondly, they are able to attract new customers at very low cost. More services on the platform naturally draws in more customers and drives higher engagement, which makes Kaspi the ideal ecosystem in which to launch new products. Standalone businesses seen in developed markets such as food delivery, ride hailing and travel ticketing can all be incorporated into the Kaspi ecosystem. In fact, after just 18 months of operation, Kaspi have grown their Kaspi Travel business (think Trainline.com) to the largest rail and air ticketing platform in the country, annualizing $330 million in gross bookings as at 1Q22 data.

The combination of these two factors puts Kaspi into the hallowed bucket of companies that offer both a stellar growth and return profile. Kaspi delivered approximately 60% year-on-year earnings growth at an annualized 75% return on equity through 1Q22 – exceptional fundamentals compared to almost any peer globally, and even more so when we remember that they were operating through what was undoubtedly the most challenging period in the company’s history. We were emboldened by the company’s recent announcement of a share buyback of up to $100 million (~1% of market cap) and the reaffirmed guidance. We believe the strategy will be rewarded for being invested in Kaspi.Kz in the long term.

While the strategy has no direct Russian or Ukrainian exposure, a number of countries we are invested in like Egypt, Kenya, Pakistan, and the Philippines are negatively impacted by higher commodity prices. Those countries have a high proportion of energy and food in their Consumer Price Index (CPI) baskets, which results in high inflation and a worsening current account position. Taking that into account, we’ve made some adjustments in the period including exiting from our investment in Edita Food Industries, the leading snacks manufacturer and distributor in Egypt.

Edita is a fantastic business, however we have concluded it will experience lower for longer margins as a result of the pressure on the Egyptian Pound and the rising cost of raw materials. Edita has demonstrated it has pricing power over a few cycles, but we still took the decision to exit, as we think it will take them longer this time to express that pricing power. We are still close to the management team at Edita and believe there will be a time when we are once again investors in the business.

Despite our adjustments, Egypt overall still hurt the strategy and contributed to just over a quarter of the returns in the period. However, we believe that the strategy’s positioning in Egypt is appropriate for this environment and expect significant upside ahead.

We would highlight Fawry as one of the companies we continue to back in Egypt.

Fawry is transforming the payments market in Egypt where over 70% of transactions are still done in cash. In 2021, Fawry served 41 million customers through 269,000 points of sale terminals, and online through their payment gateway, as well as increasingly through the MyFawry app.

Management at Fawry is executing well on its strategy to diversify from traditional payment acceptance (the typical use case is a merchant using a Fawry point of sale terminal to take a cash payment from a customer topping up their SIM card) to higher value financial services including:

  • supplier financing and inventory management (a merchant can pre-order from PepsiCo without using cash or PepsiCo can pay a supplier using Fawry which reduces its cash management costs);
  • agent banking (using an offline network to service third party bank clients);
  • microfinance (disbursing loans to customers using technology and a rich set of proprietary data); and
  • e-commerce (from payment acceptance to buy now pay later).

Fawry’s impressive revenue growth was 34% in 2021. However, one must consider that number in the context of its traditional payments business growing 9% and contributing nearly half the revenue. This is evidence of strong execution from the management team at Fawry and has a positive impact on profit margins. Much like Kaspi, Fawry is a profitable business with EBITDA margins of around 30% that we expect will grow over time as the share of new business grows in the mix.

The strategy experienced strong positive returns from Indonesia and Vietnam in the period. From a top down perspective, both countries are relatively better positioned to weather the current climate; Indonesia is net commodity exporter and has seen improvement in its current account fundamentals, while Vietnam’s foreign direct investment (FDI) based economy means it is generally less susceptible to the ebbs and flows of short- term portfolio flows. Indonesia and Vietnam represent nearly a quarter of the strategy’s capital.

In Indonesia, the strategy is invested in Sido Muncul, an herbal medicine and beverage company that is best known for its flagship brand Tolak Angin. Sido Muncul sources most of its raw materials locally and leverages its superior manufacturing technology to extract market leading yields from those inputs. On top of that natural cost hedge, Sido has significant pricing power in the herbal medicine market given its ~75% market share and unrivalled brand equity (refer to our post on June 4, 2021 to learn more about Sido Muncul).

Sido Muncul is one of the most profitable consumer health companies in the world and is on track for a 15/15 year in 2022: 15% growth in top line and 15% growth in bottom line. Despite the strong share price performance, Sido Muncul’s fundamentals are not adequately reflected in its valuation and as such continues to be the largest investment in the strategy.

Faced with the new variables from the Russian invasion of Ukraine, our team was quick to identify companies that are relatively resilient in this environment. One such company is FPT Software in Vietnam, which we owned in a fairly small size in the past but added to during this period. FPT is part of a broader theme we are expressing in the portfolio around digital transformation and the idea that digital CAPEX spend will continue to grow and become less discretionary as organisations worldwide address the different needs of their customers, employees, suppliers, and regulators. Most of that opportunity today comes from the United States and Western Europe, and that is likely to be the case for some time. As such, the market opportunity for FPT is in fact in those markets, in addition to Japan, where FPT established a strong presence. However, the supply dynamics are very much Vietnamese; FPT counts nearly 16,000 staff, the majority of which are engineers.

Vietnam is an appealing base for IT services exporters due to its large and young population, strong emphasis on STEM in education curriculums and culture. Vietnam’s IT services industry is at a fairly early stage relative to more established Indian, Latin American, and Eastern European competition which translates to a cost advantage that FPT has used to grow and in the process win some major accounts. In fact, nearly half the order book at FPT is from Fortune 500 company clients. FPT’s main competitive advantage on the supply side (i.e.: human capital) comes from the schools and universities it owns and operates in Vietnam, which count for nearly 70,000 students and act as a hiring funnel for aspiring graduates. We see FPT as the ideal play on Vietnam’s human capital development and the global IT CAPEX spend theme. The power of the theme is evident in the numbers: FPT’s global order book was up nearly 20% in 2021, and the quality of the book shows continuous improvement based on contract size (19 contracts above $5 million), scope of work, client profile, and contract duration.

While the performance environment has been challenging in the quarter and the outlook is mired with uncertainties around inflation and interest rates, we think there are a few factors that can help the strategy perform well in 2022:

  • The country mix of the strategy is diverse. While over 80% of the strategy is invested in Asia and Africa, no one country exceeds 20%.
  • As highlighted above, the country mix means factor sensitivities to rates and commodities is somewhat managed. The strategy is, on net, exposed to commodity importers but still benefits from owning businesses in countries with a strong agricultural economy (Kenya and Morocco for example) and countries that have healthy balance of payments (Indonesia on a cyclical basis, Vietnam and Morocco on a more structural basis).
  • Within those countries, the sector mix is deliberately designed to focus on long term themes around the digital economy, financial inclusion, consumer health, and retail. These themes are driven by the formalisation of the economies we invest in and are underpinned by changes in demographics, consumer behaviour, improved regulations, entrepreneurship, and technological advancements.
  • Within those sectors, we own companies that are financially under-levered, have a healthy degree of pricing power and cost variability, and are either owner-operated or multinational-majority owned/operated.
  • The portfolio’s valuation today is attractive. This presents significant return potential for long term investors

The team is committed to our collective goal of delivering differentiated and strong returns to our partners. We have confidence in our investment process and our culture, and believe that will lead to positive long term outcomes for our partners and for us at Vergent.

Vergent Asset Management LLP


DISCLOSURES

  1. Unless otherwise stated, all data is at March 31, 2022 and stated in US dollars (US$). Source: Connor, Clark & Lunn Financial Group, Thomson Reuters Datastream.
  2. Performance history for the Vergent Emerging Opportunities Strategy is that of the Vergent Emerging Opportunities Composite. The Composite has an inception and creation date of August 2018.
  3. Net performance figures are stated after management fees, estimated performance fees, trading expenses and before operating expenses. Operating expenses include items such as custodial fees for pooled vehicles and would also include charges for valuation, audit, tax and legal expenses. Such additional operating expenses would reduce the actual returns experienced by investors. Past performance of the strategy is no guarantee of future performance; Future returns are not guaranteed and a loss of capital may occur. For illustrative purposes, performance fee of 20% on added value over the hurdle rate of 6% plus the management fee of 1.25% have been assumed. Actual management fees charged to a particular account may vary.
  4. There is no benchmark for the Vergent Emerging Opportunities Strategy because it has an absolute return objective
  5. Standard Deviation measures the dispersion of monthly returns since the inception of the strategy.

Benchmarks and financial indices are shown for illustrative purposes only, are not available for direct investment, are unmanaged, assume reinvestment of income, do not reflect the impact of any management or incentive fees and have limitations when used for comparison or other purposes because they may have different volatility or other material characteristics (such as number and types of instruments) than the Strategy. The Strategy’s investments are not restricted to the instruments comprising any one index and do not in all cases correspond to the investments reflected in such indices.

These materials (“Presentation”) are furnished by Vergent Asset Management (“Vergent”) on a confidential basis for informational and illustration purposes only. This Presentation is intended for the use of the recipient only and may not be reproduced or distributed to any other person, in whole or in part, without the prior written consent of Vergent. Certain information contained in this Presentation is based on information obtained from third-party sources that Vergent considers to be reliable. However, Vergent makes no representation as to, and accepts no responsibility for, the accuracy, fairness or completeness of the information contained herein. The information is as of the date indicated and reflects present intention only. This information may be subject to change at any time, and Vergent is under no obligation to provide you with any updates or amendments to this Presentation. This Presentation is not an offer to buy or sell, nor a solicitation of an offer to buy or sell any security or other financial instrument advised by Vergent. This Presentation does not contain certain material information about the strategy, including important risk disclosures. An investment in the strategy is not suitable for all investors, and before making an investment in the strategy, you should consult with your professional advisor(s) to determine whether an investment in the strategy is suitable for you in light of your investment objectives and financial situation. Vergent does not purport to be an advisor as to legal, taxation, accounting, financial or regulatory matters in any jurisdiction, and the recipient should independently evaluate and judge the matters referred to in this Presentation. Vergent Asset Management LLP is registered in England and Wales with its registered office address at 8th Floor, 1 Knightsbridge Green, London SW1X 7QA, United Kingdom (Companies House number OC418829) and is authorized and is an Exempt Reporting Adviser in the USA. It is regulated by the Financial Conduct Authority (FRN: 791909).

THIRD-PARTY DATA PROVIDERS

This report may contain information obtained from third parties including: Merrill Lynch, Pierce, Fenner & Smith Incorporated (BofAML), S&P Global Ratings, and MSCI. Source: Merrill Lynch, Pierce, Fenner & Smith Incorporated (BofAML), used with permission. BofAML permits use of the BofAML indices related data on an “As Is” basis, makes no warranties regarding same, does not guarantee the suitability, quality, accuracy, timeliness, and/or completeness of the BofAML indices or any data included in, related to, or derived therefrom, assumes no liability in connection with the use of the foregoing, and does not sponsor, endorse, or recommend CC&L Canada, or any of its products. This may contain information obtained from third parties, including ratings from credit ratings agencies such as S&P Global Ratings. Reproduction and distribution of third party content in any form is prohibited except with the prior written permission of the related third party. Third party content providers do not guarantee the accuracy, completeness, timeliness or availability of any information, including ratings, and are not responsible for any errors or omissions (negligent or otherwise), regardless of the cause, or for the results obtained from the use of such content. THIRD PARTY CONTENT PROVIDERS GIVE NO EXPRESS OR IMPLIED WARRANTIES, INCLUDING, BUT NOT LIMITED TO, ANY WARRANTIES OF MERCHANTABILITY OR FITNESS FOR A PARTICULAR PURPOSE OR USE. THIRD PARTY CONTENT PROVIDERS SHALL NOT BE LIABLE FOR ANY DIRECT, INDIRECT, INCIDENTAL, EXEMPLARY, COMPENSATORY, PUNITIVE, SPECIAL OR CONSEQUENTIAL DAMAGES, COSTS, EXPENSES, LEGAL FEES, OR LOSSES (INCLUDING LOST INCOME OR PROFITS AND OPPORTUNITY COSTS OR LOSSES CAUSED BY NEGLIGENCE) IN CONNECTION WITH ANY USE OF THEIR CONTENT, INCLUDING RATINGS. Credit ratings are statements of opinions and are not statements of fact or recommendations to purchase, hold or sell securities. They do not address the suitability of securities or the suitability of securities for investment purposes, and should not be relied on as investment advice.

Source: MSCI. The MSCI information may only be used for your internal use, may not be reproduced or re-disseminated in any form and may not be used as a basis for or a component of any financial instruments or products or indices. MSCI makes no express or implied warranties or implied warranties or representations and shall have no liability whatsoever with respect to any MSCI data obtained herein. This report is not approved, reviewed or produced by MSCI.

The strategy’s performance in the year was shaped by a continuation of some of the themes that underpinned returns in 2020 and others which had a less favourable impact on historical returns but now appear to be turning the corner. In the former, portfolio companies that offer digital services (payments and software), healthcare, and consumer staples have been big winners in the pandemic with many likely to experience a step change in their long-term cash flow generation capacity. With digital services companies, we’ve maintained our focus on profitable companies that are delivering valuable solutions to their consumer and business clients through the deployment of technology that is scaleable and adapted to local market dynamics. In health and consumer staples, we gained more confidence in companies we owned prior to the pandemic as management excellence, market leadership, distribution prowess, and brand equity all played nicely into consumer habit changes that were brought about by the pandemic.

In the latter, the late reopening of economies in many Asian and African markets we invest in has meant that earnings have remained below potential for longer (compared to similar companies in more developed countries). As a result, those companies trade at deeply discounted valuations, presenting an opportunity to own them as they recover back to pre-pandemic levels of earnings. Naturally, those are businesses that sell products and services in an offline environment and typically require a high degree of mobility (alcoholic beverages, education, retail, and snacking are good examples). Management teams at these companies did not rest on their laurels and have adapted their businesses to be more agile, more digital and more available to their customers. We expect these initiatives to be generously rewarded as economies begin to reopen.

This mix of businesses complements the geographically diverse nature of our concentrated portfolio and mitigates the impact that a change in the market environment can have on returns. For example, as we enter a higher interest rate environment globally, valuations of our digital services companies might be capped but we expect that to be compensated by higher margins (i.e.: earnings growth) from our financial services companies. The portfolio’s investment in a wide range of market capitalisations and exposure to different ownership structures (owner-operator or multinational) adds to factor diversification and sensitivity to the ebbs and flows of liquidity. Within the portfolio, our job then is to ensure that capital is allocated to probabilistically optimise these factors, with the objective of producing a net positive outcome that is consistent with our and our investors’ return expectations. A less observable benefit of this approach is it allows us to see through periods of volatility which extends our holding period advantage in the market.

Outside the portfolio, our research is focused on identifying companies that can provide a superior risk-reward profile to existing investments or the excess cash position we might be holding at any one time. Our team’s knowledge of the markets and companies we invest in continues to compound and the opportunity set is getting deeper and more interesting for public market investors.

This year’s performance divergence between the strategy and emerging markets (a positive swing of ~13% versus the MSCI EM which was down ~5% in 2021) adds credence to the argument us and others have been making about looking beyond index-driven emerging market classifications when allocating capital outside core developed markets. We’ve put our money behind this thesis with a signification proportion of our Managing Partners’ capital invested in the strategy. We believe that a concentrated, geographically diverse, and benchmark agnostic approach is appropriate for investors looking to capture the growth in the next generation of emerging markets (i.e.: beyond the now “emerged” markets of China, Korea and Taiwan).

As the strategy wraps up its third year, we want to thank our clients, partners, and colleagues for their support and wish all a prosperous 2022.

Vergent Asset Management LLP


DISCLOSURES

  1. Unless otherwise stated, all data is at December 30, 2021 and stated in US dollars (US$). Source: Connor, Clark & Lunn Financial Group, Thomson Reuters Datastream.
  2. Performance history for the Vergent Emerging Opportunities Strategy is that of the Vergent Emerging Opportunities Composite. The Composite has an inception and creation date of August 2018.
  3. Net performance figures are stated after management fees, estimated performance fees, trading expenses and before operating expenses. Operating expenses include items such as custodial fees for pooled vehicles and would also include charges for valuation, audit, tax and legal expenses. Such additional operating expenses would reduce the actual returns experienced by investors. Past performance of the strategy is no guarantee of future performance; Future returns are not guaranteed and a loss of capital may occur. For illustrative purposes, performance fee of 20% on added value over the hurdle rate of 6% plus the management fee of 1.25% have been assumed. Actual management fees charged to a particular account may vary.
  4. There is no benchmark for the Vergent Emerging Opportunities Strategy because it has an absolute return objective
  5. Standard Deviation measures the dispersion of monthly returns since the inception of the strategy.

Benchmarks and financial indices are shown for illustrative purposes only, are not available for direct investment, are unmanaged, assume reinvestment of income, do not reflect the impact of any management or incentive fees and have limitations when used for comparison or other purposes because they may have different volatility or other material characteristics (such as number and types of instruments) than the Strategy. The Strategy’s investments are not restricted to the instruments comprising any one index and do not in all cases correspond to the investments reflected in such indices.

These materials (“Presentation”) are furnished by Vergent Asset Management (“Vergent”) on a confidential basis for informational and illustration purposes only. This Presentation is intended for the use of the recipient only and may not be reproduced or distributed to any other person, in whole or in part, without the prior written consent of Vergent. Certain information contained in this Presentation is based on information obtained from third-party sources that Vergent considers to be reliable. However, Vergent makes no representation as to, and accepts no responsibility for, the accuracy, fairness or completeness of the information contained herein. The information is as of the date indicated and reflects present intention only. This information may be subject to change at any time, and Vergent is under no obligation to provide you with any updates or amendments to this Presentation. This Presentation is not an offer to buy or sell, nor a solicitation of an offer to buy or sell any security or other financial instrument advised by Vergent. This Presentation does not contain certain material information about the strategy, including important risk disclosures. An investment in the strategy is not suitable for all investors, and before making an investment in the strategy, you should consult with your professional advisor(s) to determine whether an investment in the strategy is suitable for you in light of your investment objectives and financial situation. Vergent does not purport to be an advisor as to legal, taxation, accounting, financial or regulatory matters in any jurisdiction, and the recipient should independently evaluate and judge the matters referred to in this Presentation. Vergent Asset Management LLP is registered in England and Wales with its registered office address at 8th Floor, 1 Knightsbridge Green, London SW1X 7QA, United Kingdom (Companies House number OC418829) and is authorized and is an Exempt Reporting Adviser in the USA. It is regulated by the Financial Conduct Authority (FRN: 791909).

THIRD-PARTY DATA PROVIDERS

This report may contain information obtained from third parties including: Merrill Lynch, Pierce, Fenner & Smith Incorporated (BofAML), S&P Global Ratings, and MSCI. Source: Merrill Lynch, Pierce, Fenner & Smith Incorporated (BofAML), used with permission. BofAML permits use of the BofAML indices related data on an “As Is” basis, makes no warranties regarding same, does not guarantee the suitability, quality, accuracy, timeliness, and/or completeness of the BofAML indices or any data included in, related to, or derived therefrom, assumes no liability in connection with the use of the foregoing, and does not sponsor, endorse, or recommend CC&L Canada, or any of its products. This may contain information obtained from third parties, including ratings from credit ratings agencies such as S&P Global Ratings. Reproduction and distribution of third party content in any form is prohibited except with the prior written permission of the related third party. Third party content providers do not guarantee the accuracy, completeness, timeliness or availability of any information, including ratings, and are not responsible for any errors or omissions (negligent or otherwise), regardless of the cause, or for the results obtained from the use of such content. THIRD PARTY CONTENT PROVIDERS GIVE NO EXPRESS OR IMPLIED WARRANTIES, INCLUDING, BUT NOT LIMITED TO, ANY WARRANTIES OF MERCHANTABILITY OR FITNESS FOR A PARTICULAR PURPOSE OR USE. THIRD PARTY CONTENT PROVIDERS SHALL NOT BE LIABLE FOR ANY DIRECT, INDIRECT, INCIDENTAL, EXEMPLARY, COMPENSATORY, PUNITIVE, SPECIAL OR CONSEQUENTIAL DAMAGES, COSTS, EXPENSES, LEGAL FEES, OR LOSSES (INCLUDING LOST INCOME OR PROFITS AND OPPORTUNITY COSTS OR LOSSES CAUSED BY NEGLIGENCE) IN CONNECTION WITH ANY USE OF THEIR CONTENT, INCLUDING RATINGS. Credit ratings are statements of opinions and are not statements of fact or recommendations to purchase, hold or sell securities. They do not address the suitability of securities or the suitability of securities for investment purposes, and should not be relied on as investment advice.

Source: MSCI. The MSCI information may only be used for your internal use, may not be reproduced or re-disseminated in any form and may not be used as a basis for or a component of any financial instruments or products or indices. MSCI makes no express or implied warranties or implied warranties or representations and shall have no liability whatsoever with respect to any MSCI data obtained herein. This report is not approved, reviewed or produced by MSCI.

Since the global COVID-19 pandemic began 17 months ago, we have seen a dizzying parade of investment themes (and memes) that have caught the imagination of investors big and small. From Electric Vehicles (EVs) to the latest canine-inspired crypto currency, and now NFTs (Non-Fungible Tokens) and the metaverse, where one can escape the harsh inflationary realities of post-pandemic life. At Global Alpha, we are not thematic investors, but we do rely on themes to offer tailwinds to companies that have been carefully vetted around our investment process.

Themes themselves can be broad-based and structural, or narrow and niche, fueled by the latest fad or trend. We tend to favour the former, which tends to last longer and influence a broad swath of the economy, cutting across sectors. Within emerging markets (EM) for example, a broad structural theme that is currently playing out is the increasing formalization of their economies. As per the International Monetary Fund (IMF), over 60% of the world’s adult labour force participates in the informal economy and accounts for around 35% of the GDP of emerging economies.

Also, informality is not evenly spread across the EM world; Latin America and Africa have higher levels of informality in comparison to East Asia. Emerging markets with large informal sectors tend to underperform and punch much below their weight. Several countries within our EM universe have been actively trying to remedy the situation in order to increase their overall economic productivity, increase the size of their tax base, and lift the living standards of their populations. One country that has really stood out in its push towards greater formalization of its economy has been India.

In the last five years, India has enacted three key measures to push its economy towards greater formalization. Firstly, demonetization of Rs 1,000 and Rs 500 notes in 2016 forced many informal workers to join the formal work force. Secondly, the implementation of Goods and Sales Tax (GST) forced unregistered firms operating in the cash economy to get registered and enter the formal economy. Finally, the first two measures acted as a tailwind for the rapid adoption of digital payments via the Unified Payments Interface (UPI) platform rolled out by the government. The net result, as per a recent report by the State Bank of India (SBI), is that the informal economy has now shrunk to 15-20% of GDP in 2020-2021, versus 52% of GDP in 2017-2018.

This recent shift towards formalization is a generational change and is impacting every sector of the economy. For the discerning investor, it offers an opportunity to identify winners and losers of this massive shakeout that is leading to consolidation and an increase in market power of a select few companies. A great example of this consolidation is the luggage industry in India, which is estimated to be worth around US$3 billion, of which only 25% is organized. The Indian luggage industry is projected to grow in the high teens, and this growth outlook is propelled by four interesting underlying trends.[3]

  1. Indians are travelling more and are making on average three trips every year as air traffic grew in double digits up to 2018.
  2. There is a rise in brand consciousness and luggage is now seen as a fashion statement rather than a mere utilitarian product.
  3. There is a higher spending on Indian weddings, where luggage is now included as part of the wedding trousseau.
  4. Replacement cycles have been reduced, with Indians replacing their luggage in four to five years (vs 10 years earlier) and their backpacks in two years (vs three to four years earlier).[5]

VIP Industries (VIP IN)

For us, a clear beneficiary of this trend has been VIP Industries (a portfolio holding), which, along with Safari Industries (SII IN; not a portfolio holding) and Samsonite (1910 HK; a portfolio holding), control more than 90% of the organized luggage space. VIP, however, is the clear market leader with a 52% market share, having been the number one brand in India for the last 50 years. VIP started in the 1970s, making briefcases for office goers, and the name VIP was meant to give its customers an aspirational tag. The company now makes hard and soft luggage, backpacks, and handbags.

With the entry of Samsonite in India, VIP was forced to rebrand and reinvent itself to cater to a younger and trendier demographic. The company decided to mimic Samsonite’s own successful international turnaround by focusing on clearly segmenting their brands, expanding distribution, cutting costs, and spending heavily on branding. In addition to this, the company decided to switch from a promoter-led entity to hiring professional management.

The combination of these company-specific changes and macro tailwinds, coming from the shift to the organized sector, has led to remarkable results for VIP. If one were to look at their financial performance from 2016, which marked the acceleration of the shift towards formalization, up to the end of 2019, before the pandemic, we see that the company’s EBITDA and net income has more than doubled. With zero debt, their return on invested capital (ROIC) grew from 19.5% in 2016 to 25% in 2019, as VIP decided to rely less on imports from China, and invest in their own manufacturing units in India and low-cost Bangladesh.

While the pandemic disrupted travel and led to a sharp drop in business at VIP, our discussions with management indicate that demand has rebounded sharply with pent up demand for travel and discretionary spending, such as weddings, leading to higher volumes. VIP intends to take advantage of the dislocations in Chinese manufacturing resulting from power outages by leveraging its new manufacturing capacities while launching new SKUs to capture the market share across segments. As the market and the Indian consumer slowly moves away from the unorganized market, we see VIP further consolidating its position as a market leader.

At Global Alpha, we remain committed to separating themes from memes and identifying winners who can clearly benefit from these once-in-a-lifetime shifts in emerging economies.

Have a nice day.

The Global Alpha team


[3] Ambit Capital Research

[5] Ambit Capital Research

Real Estate in Emerging Markets: Unlocking sustainable growth opportunities.

Emerging markets have had difficult times during COVID-19, however, we have seen that in several cases, the recovery has been faster than expected. Not only is this recovery due to higher vaccination rates, but also because of secular trends, especially in the emerging lower middle class where growth opportunities are just beginning. In our universe, one of the sectors where we see a great growth opportunity is in real estate. The main variables that drive tailwinds for the sector are:

  • Sustainable growth of the country, which implies that the emerging lower middle class can climb the ladder;  
  • Low interest rates, inflation, and unemployment; and
  • A consolidated industry with players who have good balance sheets and are focused on profitably.

In this environment, our largest overweight in the real estate sector is in India and Indonesia. One could argue that interest rates and inflation are currently on the rise in many countries, which is true. However, the rate hike process in Asian countries has been much slower, and structural growth remains intact. For example, in the case of India, current mortgage rates are at record low levels of under 7%, compared to more than 10% a decade ago. Indonesia rates are also likely to maintain low, which continues to favour growth in the real estate sector.

India’s last real estate cycle ended in 2013 and has not been able to recover since, due to several disruptions, such as demonetization in 2016, the roll-out of the Real Estate Regulatory Act in 2017, and the Non-Banking Financial Companies (NBFC) crisis of 2018. Likewise, India hasn’t experienced real price increases since 2013. Prices have increased 3-4% on average, below inflation each year and also below growth in income levels of around 8% per capita. So, what would make this cycle effectively sustainable from 2021 onwards? Some of the reasons were explained above. Moreover, In India, the real estate sector has experienced an industry consolidation that has driven inventory reduction (around 20%). With rising demand (also boosted by additional space required driven by the work-from-home scenario) and shrinking supply, price increases are most likely to occur for the following years; a phenomenon we haven’t seen in India for the last decade. Some factors that have contributed to the real estate sector’s boom include low interest rates, rising salaries, and explosive hiring’s (i.e., Infosys has hired close to 350,000 employees this year and salary hikes have been close to 120%). With government support to housing such as stamp duty cuts by the government of Maharastra, or Gujarat government measures in December 2020 such as the possibility of agricultural land being acquired for affordable housing, this support has changed sentiment and boosted demand.

In relation to housing affordability, mortgage installments in relation to monthly income have also been improving, changing the sentiments with all the other more favourable conditions. For example, in Mumbai, this index has improved from 93% in 2010 to 61% in 2020. In cities such as Ahmedabad, the index has improved to 24% in 2020, from 46% in 2010. This means that in this city, an average household needs to spend 24% of its income to pay monthly installments for the respective loan. Mumbai remains the most expensive market, but levels are improving.[2]

Another relevant variable to monitor are launches and inventory. Companies need to increase launches overall in order to capture increasing demand in a sustainable way. In 2015 and 2016, launches were approximately between 475 and 501 million square feet, decreasing to 135 million square feet in 2021.[3] Launches decreased progressively during these years, essentially due to inventory levels being too high. Inventory months hovered around 40-45 days between fiscal year (FY) 2016 and FY2020, and lowered 40 days in FY2021. In noting this, companies reinforced their efforts to liquidate their inventory first, with prices barely increasing at a 1% compound annual growth rate (CAGR) over 2015-2021, far beyond inflation. Inventory levels have lowered to 916,195 units in FY2021, to the lowest levels in 7 years.[4] Moreover, as FY2021 was a COVID-19 impacted year, the decline in new launches was steeper than normal, as H1FY2021 was virtually a wash-out and H2FY2021 was all about monetizing existing unsold inventory.

Moving forward, we should expect launches to pick up again. We foresee that the most relevant Indian developers are well positioned to capture this window of opportunities, considering good cost of funding, low leverage (as several raised equity during 2019-2020), liquidity access, lower inventory levels, and market share gains are likely to remain consistent due to the consolidation of the industry.

The real estate sector is behaving quite well in terms of volume increases, although sustainable price increases that can also mitigate the hike in raw material prices remain as a key challenge. The real estate market in India is very important for the country’s development as it is worth USD 150-180 billion, or 6-7% of the GDP, and is expected to reach 13% of the economy by 2025. It is the second highest employment generator in the country, after agriculture.[5]

In terms of the non-residential market, in 2019, the Indian office market closed with a record high of transactions, increasing by 27% to levels of 60 million square feet during the year. In 2021, new completions surpassed transactions for the first time since 2013. During FY2021 to FY2022, in the organized market, tech-related companies accounted for around 40% of office transactions in India, with renewed massive hiring and positive business forecasts anticipate their vacancy will remain low.[6]

We still can see some work-from-home effects lowering absorption levels, nevertheless, tech and other related sectors have lowered vacancies, which we expect to maintain at reasonable levels. Their expansion plans are also likely to improve net absorption. In the first nine months of 2021, transactions increased by 13% and completions by just 6% in relation to the same period last year, showing that the levels of activity are increasing to a great extent. Likewise, projects set for completion in 2021 and 2022 are pre-leased by multinational companies. Capitalization (cap) rates in key areas such as Mumbai remain very healthy at 6-8%. Economies, such as India’s, with a young workforce and without adequate infrastructure (possess separate spaces for work from home and also lacks air conditioning) favour a hybrid model, although with less working from home than in developed markets. Considering all the aforementioned, office demands and vacancies are expected to remain at healthy levels in the medium term. Bangalore, Mumbai CBD, and Pune maintain the lower vacancy levels in the main cities, hovering around between 5 and 10%.[7]

Prestige Estates Projects (PEPL IN)

In Indian real estate, Prestige Estates Projects is one of our key holdings. Over the last decade, the Prestige Group has firmly established itself as one of the leading and most successful real estate developers in India across all asset classes. The company currently has its principal presence in South India (Bangalore) and is the main developer to boast such a widely diverse portfolio, covering the residential, commercial, retail, leisure, and hospitality segments. During 2HFY2021, Prestige signed a term sheet with Blackstone to divest its entire stake in six operational office assets (6.6 million square foot), an 85% stake in nine retail malls (3.3msf) and a 50% stake in four under-construction office assets (7.4msf), along with two hotel assets – Oakwood and Aloft. The enterprise value, as per the term sheet, was settled at Rs 92 billion, with a cap rate of 8.5%. Part of the transaction will be used to clear the debt of the company’s annuity portfolio while the remaining inflow is likely to be utilized for expanding a residential pipeline (new joint venture/joint venture development agreements) and also accelerating capex for the annuity portfolio. The yield on cost expected for the new developments is 15-20%, much higher than the cap rate of the sold portfolio. Prestige will have almost 0.2x net gearing after completing the transaction, which is much better than 1.5x before the deal, which can foster re-leveraging in new projects, giving much higher yields as recently explained.

The company is one of the few Indian real estate developers with sound geographical expansion projects, ready to capture many growth opportunities in the rising emerging low-middle class. They are characterized for their good track record in Bangalore in terms of their execution and expansion capabilities. Prestige has almost doubled its sales since 2005 and has done so every 4-6 years following, and we expect the expansion to continue with all the new projects in Mumbai. Such expansion makes the company one of the more geographically diversified developers in India and they are mainly focused in Mumbai, where opportunities are huge.

The company is setting up four office complexes in Mumbai – two in BKC: one at Mahalaxmi and one in Jijamata Nagar. They have not yet started pre-leasing any of them as they have yet to receive all approvals (construction has not yet started). All of these are prime office markets, and HDFC has been the lender in these projects prior to acquisition by Prestige, continuing to remain as the lender. These three projects are with a single local developer, DB Realty. This month, they also launched their inaugural residential project in Mumbai – Jasdan Classic, located in Byculla. Once entering the market, execution risks should be lower. Mumbai has a more “local” culture where a younger population, living in small apartments, favours a work-from-office philosophy.

Management raised FY2022 presales guidance from Rs 65 billion to Rs 70-80 billion, and targets reaching presales of Rs 100 billion in the next three years (from Rs 55 billion in FY2021) and rental income of Rs 28-30 billion per annum in the next 7-8 years (versus Rs 2.6 billion now). To achieve such growth, it is essential that the company invests in new project acquisitions and capex. In a period of five years, Prestige expects Mumbai sales to be around 25% of their consolidated revenues. Such an important figure outside its home region (Bangalore) is relevant for an Indian developer and can be the second most important diversification success case besides Godrej Properties. For the long term, their non-real estate portfolio could be transferred to a REIT.

In Indonesia, we have seen a massive rebound to robust presales and high take-up rates at launches, which implies that demand for property remains very high, whereas prices seem to have bottomed up from previous years. Launches during the year have performed well, being concentrated IDR two billion (with a tapering off of take-up rates, as prices exceed this level) and located within reasonable vicinities of large cities, fulfilling their roles as satellite suburbs serving the working population of a metropolitan area. The Government has also taken measures to boost the real estate sector. The main measure was to provide temporary rebates until December 2021, in value-added tax (VAT) for property purchases (up to 50%) if they are priced below INR 5 billion and 100% rebate if they are priced below INR 2 billion. However, developers are lobbying to extend this program into 2022.[8]

Another important issue was the relaxation on the loan-to-value (LTV) for developers. Similar to India, the last real estate cycle in Indonesia ended in 2013. Before that, leverage was not an issue for developers, as many of the properties were self-funded and banks were willing to issue mortgages for at least 80% of the value of properties. Some mortgages included some buy-back clauses from the developer, effectively protecting the bank in case of any default. After the 2013 boom cycle (which ended in 2015), one of the ways the Bank of Indonesia tightened up was by limiting LTV requirements. As a matter of fact, after 2013, for houses larger than 70 square meters, the loan-to-value was approximately 70% and 60% for first and second homes.[9] The LTV has continuously been relaxed between 2015 and in 2020, driven by a COVID-19 stimulus LTV of 100% (in practice, it is around 90%). Moreover, disbursements of funds to developers was also limited and linked to the construction progress. For example, prior to 2013, the disbursement for developers was 80% linked to the signing of the mortgage deed. In 2013, this percentage was reduced to 0%, in 2018 to 30%, and in 2021 part of the government easing measures was increasing this percentage to 100%.Such relaxations are very important for developers’ balance sheets, as construction costs hover around 50% of the selling price, helping significantly with the deleveraging of the sector.[10] 

Considering the aforementioned, we are assuming growth in presales of 45% this year, 38% of which occurred in the first nine months of 2021, and was positively impacted by the VAT exemption. We also expect 10-15% for 2022-2023, which would be the first multi-year growth after the decline between 2018 and 2020. We don’t expect price increases similar to those in the 2010-2013 cycle; nevertheless, there is a probable scenario next year for prices to start rising after seven years, if the COVID-19 pandemic ends favourably and structural demand stays intact. Despite some tough years, Indonesia’s real estate prices have been extremely resilient, avoiding any declines as developers have usually preferred to sell less volumes, while not making discounts.

In summary, we think the Indonesian real estate market is ready for another positive cycle, driven by a combination of developers’ efforts, such as better presales, capex discipline, providing housing financing through hybrid mortgages and in-house installments, together with favourable policies from regulators, such as declining debt costs, lower inventory costs and lower debt rates. Rates can hike in the medium term, but should remain low in relation to previous cycles. All of the abovementioned has helped the main developers to strengthen their balance sheets.

Another phenomenon we could start to see, especially next year, is a return from investors to the real estate markets. This situation is by far not comparable to the massive boom of the 2010-2013 cycle. In those years, yields where roughly 9-10%, and currently, they are around 5-6%, similar to a government bond yield. Nevertheless, banks’ liquidity remains very high (supported by high CASA growth), with very low LDRs, and together with strong balance sheets, most developers are good enough to continue to provide hybrid mortgages and in-house installments. This in turn will make easier roads for investors who can also expect some revaluation of their properties if the positive cycle continues.

Regarding launches, those done in August and September, post the latest mobility restrictions, were all sold out, which is a good indication of demand status. The amount of launches this year has been around 5,000 units.[11] In Indonesia’s case, we have seen a greater proportion of launches in relation to inventory cleanup in India. The main reason for this is that Indonesia’s property mix is more oriented towards landed house projects. New launches are done after most of the units are sold, and therefore, inventory is not a high concern. In order to continue growing, companies have been much more dependent on new launches, and demand has responded well.

After the cycle of 2013, the Bank of Indonesia’s double-tightening measures made developers look at external ways of financing. Hybrid mortgaging was one of the most common alternatives, being a combination of installment and mortgages, where there was an option to put a 30% down payment by instalments of up to 36 months. At the end of period, the buyer has to pay the remainder of the purchase, which can be done in cash, but this is usually done by mortgage. For the developer, as the house is under construction, these instalments are booked as liabilities as customer advances. Considering down payments are usually the hardest milestone for homebuyers, hybrid mortgages have helped their affordability. Extended down payments can also improve the buyer’s approval rates for loans because they provide more time for buyers to improve their credit profile, and also lower their LTVs. Currently, this mechanism is used in a lower extent, considering required down payments are lower (10-15% as market conditions have improved).

Regarding non-residential real estate, mall and office owners have begun reducing rental discounts, as traffic and occupancies have been recovering, and are likely to continue accelerating. Majority of shopping centres started the year with an average discount to tenants of 50%, and after the reopening in the third quarter, foot traffic recovered much more quickly than expected, so the discount has been lowered to 40%. By the second half of next year, it is most likely that we should see pre-COVID-19 rental income for malls. The office market has continued under oversupply since 2014, thus rents are not expected to rise, while also considering the work-from-home environment.

Ciputra Development (CTRA IJ)

One of the primary beneficiaries of the property market recovery in Indonesia is our holding Ciputra Development. Ciputra Development is one of Indonesia’s leading property developers, and is involved in both residential townships, as well as mixed development. Landed houses account for a major portion of Ciputra’s projects. The company also develops and operates a range of investment properties (i.e., malls, hotels, hospitals, and offices). In 50% of its projects, Ciputra employs an asset light business model, with revenue/profit share agreements with various local developers, providing the company with additional development opportunities in a balance sheet efficient manner. It currently has over 75 projects in 33 cities across the country. The company has one of the most extensive land banks in Indonesia (2,300 hectares), which implies over 15 years of assured developments and high margins in the medium term. This company fits very well in this article thesis about secular trends in emerging markets due to its huge potential in mid- and low-market segments, which are heavily underserved (total addressable market (TAM) of around 120 million people (middle-to-low income bracket), including 65 million millennials). The affordable housing business (average selling price (ASP) under Rs2 billion) has a massive potential, driven by the extensive population.

Ciputra is also tapping into geographical diversification across the major markets of the country, and has established developments in Greater Jakarta and Borneo, expanding to Semarang, Surabaya, Manado, Palembang and Makassar, currently present in 33 cities.

The urbanization trend (which has increased from 49% in 2009 to 56% in 2019) and the availability of mortgage facilities, represents strong tailwinds for the mid-long term. In relation to its residential business, even though the majority of its 55 residential projects are focused on low- to mid-income segments (65% of its 1H21 presales are priced at less than Rp 2 billion), 8 of its projects target upper income segments. In the commercial business, a Possible REIT or other method exit of portfolio of properties at good cap rates and re-allocation of capital at better yields on cost is always an alternative. Ciputra is enjoying a healthy 9M21pre-sales recovery over 33% year over year and 86% of the company’s target for the full year. For 2022 and 2023, we expect low-digit growth, with 2022 being very dependent when the VAT benefit will end.  Overall, Ciputra has superior margins, a good balance sheet, and low debt, and we expect the company to continue operating at strong levels.

In terms of recurring revenue (i.e., shopping centres, offices, and hotels), we expect it to contribute 18-19% 2021E and increase to 25-27% in FY2022-2023E. Recurring revenue brings stability to cash flows, and their normalization and acceleration in the following years is positive for the company and the stock. Ciputra expects normalization of tenant rates (to pre-COVID-19 levels) from FY2022 and its latest development, Surabaya mall, phase two, started reopening in the second quarter of 2021, where occupancy rates are expected to be around 90% by year end.

In emerging markets, it is important to be able to identify secular trends because it’s related to the fact that emerging lower-middle segments can gradually increase their purchasing power, well-being, and quality of life. However, in order to add value to our clients, we are constantly looking for the companies that can capture the best growth opportunities in this favourable environment. In this sense, we pay close attention to the quality of balance sheets, growth prospects, cash flow generation and management quality, among other things. Ciputra Development and Prestige Estates Projects are two good examples of quality companies enjoying favourable tailwinds.

Have a nice day.

The Global Alpha team


[2] Knight Frank Research

[3] ICICI securities and Liases Foras

[4] Jefferies presentation

[5] https://www.businessinsider.in/

[6] Knight Frank Research

[7] ICICI Securities and Cushman Wakerfield

[8] Just to quantify VAT Is 10% so the waiver for projects below INR 2billion is INR 200 MM, enough for buying a mid-high end car

[9] Mandiri

[10] Mandiri

[11] Citibank

Investing in Emerging Markets (EM) equities never gets boring. One of the main reasons why we love our job is that every day presents us with a dynamic set of challenges and opportunities. In our September 16 commentary, we discussed the crux of the ongoing regulatory changes in China from a local perspective, the impact on different sectors of the economy, and the steps we are taking to position our portfolio accordingly. However, China is not the only country in our investable universe where the government decided to step in and attempt to fix some areas where the free market’s invisible hand allegedly failed.

In August, we witnessed a regulatory crackdown on technology companies spread to South Korea. Many investors in that country reacted rapidly and rushed for the exits, likely spurred by their wounds sustained in China, where tech giants lost 30-50% of capitalization from their peak levels. As a result of the low tolerance of undergoing the same experience, they wiped tens of billions of United States dollars (USD) off the local tech titans’ market value.

Unlike the Chinese government ambitiously reshaping nearly every sector of their economy, the Korean regulators appear to be highly focused on addressing issues in the technology business. Leading internet platforms, both foreign and domestic, have been thoroughly scrutinized and repeatedly criticized by politicians from different parties for abusing their dominant market position and hurting competition in the pursuit of profits, aggressive expansionary business practices, personal data usage, and high commission rates, putting pressure on small and medium-sized enterprises (SME). For instance, Kakao is one of the leading Korean big tech companies, and until not so long ago was the third domestic company by market capitalization. Kakao started as a messaging platform and expanded into consumer finance, payments, gaming, and ride-hailing businesses, among others; with nearly 120 affiliates Kakao has been compared to an octopus by critics. While commenting on the topic, the leader of the ruling Democratic Party of Korea said, “Kakao must not follow the steps of the country’s other conglomerates that ignored fairness and coexistence in the sole pursuit of profit.”

Furthermore, some critics and lawmakers have advocated to adopt measures to prevent big tech companies from monopolizing online services, making it more difficult for larger platforms to acquire smaller peers. Senator Chung, from the People Power Party, suggested further enforcing the Telecommunications Business Act to restrict larger platforms’ M&A activities. He also pointed out that Korean internet is a winner-take-all market with quite grim consequences for the vanquished, likely reminiscent of the Netflix show Squid Game, as larger platforms have over 90% market share. Other lawmakers are pushing to allow smaller companies to gain access to user data accumulated by dominant platforms, creating an ecosystem where big tech companies and emerging operators can grow and innovate together and ultimately benefit consumers and the economy as a whole.

Let’s review the chronology of the main regulatory events:

One can argue that the upcoming March 9, 2022 presidential election in South Korea is the main reason why politicians are bringing up issues and bills targeting big tech companies. Coincidentally or not, five years ago, it was the family-run conglomerates (also known as “Chaebol”) that came under attack, and were accused of enriching themselves by abusing their dominance and applying unfair practices. Also, lawmakers traditionally pressured telecom companies on pricing plans as an efficient way to gain publicity.

Amid growing scrutiny and accusations from lawmakers and regulators, several big tech names pre-emptively announced action plans to appease critics by abandoning some business segments, providing support to SMEs and scrapping plans to compete with small mom-and-pop businesses. For example, Kakao announced their plans to withdraw from the hair salon, flower, snack, and salad delivery businesses. The company also created a $255 million fund for suppliers’ support in addition to other steps aimed at strengthening its corporate social responsibility.

Although the new rules announced by the government so far have limited impact on business fundamentals, the concerns of further regulatory tightening affected the market sentiment and put pressure on the technology sector. By and large, small-cap companies are less prone to the current regulatory headwinds as they usually do not exercise overwhelming market dominance, nor do they employ aggressive expansionary business practices similar to Kakao and Naver, and remain out of sight from the politicians and general public. Moreover, we believe some of our holdings are in a relatively safer position or can even come out as net beneficiaries when the dust settles.

NICE Information Service (030190 KS)

NICE Information Service is the leading credit bureau (CB) in Korea, providing consumer and corporate credit information, risk management consulting, and debt collection services. It has the largest number of members in both the financial and non-financial sectors. The company is poised to benefit from structurally higher demand for retail credit checks due to the ongoing expansion of near- and sub-prime markets, increased competition among Korean lenders (leading to higher turnover of existing loans), a greater focus on unsecured lending, deregulation (enabling more product launches), and retail customers (who are becoming increasingly careful about their credit scores).

NICE Information Service is the only CB in Korea with exposure to consumer and corporate fields, with the most robust financial big data capabilities accumulated over 30 years (database of 43 million consumers and 2.2 million corporates). It has also secured non-credit and non-financial data, such as telecommunication, rental, and social info by collaborating with numerous partners. Consumer CB and big data businesses are expected to be the primary growth drivers of the company. We believe NICE Information Service should be one of the primary beneficiaries of the lawmakers’ initiatives to allow smaller companies to gain access to user data from dominant tech platforms.

NKN KCP (060250 KS)

NHN KCP (“Korea Cyber Payment”) is the leading online Payment Gateway (PG) service provider with a 24% market share. PG is a settlement service that authorizes credit card payments for online retailers. It encrypts credit card information and sends transaction data directly to credit card companies, bypassing merchants’ systems, and thus keeping credit card information confidential. PG also withholds payment until the merchant fulfils the transaction, allowing online shoppers to avoid fraudulent sellers. NHN KCP also runs online and offline Value-Added Networks (VAN) and Online-to-Offline (O2O) businesses. Online VAN service, connects online merchants with credit card companies through secure communication networks to approve credit card transactions. Offline VAN service, connects offline merchants with credit card companies through secure communication networks to approve card transactions. The O2O business empowers SMEs and facilitates payment processing in offline channels.

NHN KCP serves over 150,000 domestic and global merchants. The company is one of the key beneficiaries of the ongoing structural growth of e-commerce and digital content consumption, credit cards’ share gains from other payment methods, and growing overseas transactions. NHN KCP provides Korean merchants with frictionless payment processing capabilities by charging highly competitive take rates (e.g., in the range of 0.10-0.12% for domestic PG). In general, the current PG take rates in South Korea are among the lowest globally and do not catch the eyes of lawmakers as being predatory. For instance, in the e-commerce business, Coupang charges its merchants take rates as high as 8-10%, which has been seen as taking advantage of mom-and-pop companies with no alternative. Also, the food delivery platforms charge take rates of 8-12% of total transaction volume. One of the main market concerns in the investment case of NHN KCP is the risk of its largest clients following the suit of eBay Korea and Naver Pay, to build their in-house PG capabilities and bypass third-party PG companies. The government push against big tech’s aggressive expansion in different verticals might cool down these potential intents and lower the risk of clients’ attrition for NHN KCP. Moreover, the company can gain extra business if one of the tech giants decides to outsource PG capabilities.

AfreecaTV (067160 KS)

AfreecaTV (“anybody can freely broadcast”) is the most prominent Korean live streaming platform, where anyone can broadcast gaming, sports, and various entertainment content free of cost. Instead of paying a subscription fee, the viewers show their appreciation by donating virtual gifts (Star Balloons) to broadcasters (Broadcast Jockeys or BJs). AfreecaTV takes 35% commission from these gifts donated to its BJs. In addition, it sells advertising products (branded content, banner ads, video ads and other solutions) to various brands. The platform has over 17,000 active BJs and hosts over 20,000 live streams per day. AfreecaTV is one of the few available options in the EM universe, providing exposure to e-sports. Gaming content drives over 60% of traffic, while around 30% of its gifting revenue and 50% of advertising revenue are derived from e-sports content.

The company enjoys a substantial supply of top BJs while supporting them financially and via collaboration in creating unique content and providing facilities for professional production and e-sports events. A BJ support department is available 24/7 and top BJs are locked in through exclusive agreements with AfreecaTV. A deep bench of highly popular broadcasters and exclusive content keeps its viewer base sticky. We expect the platform monetization to improve on the back of investments in content and BJ support. Rising content quality should drive a steady user base growth, enhance engagement, and lift the proportion of paying users and average revenue per paying user. In addition, AfreecaTV ad revenue is becoming the long-awaited second source of growth. It is poised for solid expansion, from nearly 20% of the mix to 50% in five years, primarily driven by branded content. Democratization of the data accumulated by large platforms can bring new opportunities for AfreecaTV’s ad business.

Have a great day.

The Global Alpha team

The strategy’s performance in the quarter was driven by three key factors:

  1. Reopening sensitivity in the retail and financial services portfolio in Indonesia and the Philippines as those economies emerge from their respective lockdowns as a result of a ramp up in vaccinations in the key economic centers.
  2. A re-rating of our Moroccan portfolio following the results of the parliamentary elections, which saw the long-dominant Islamist party (Justice and Development Party) suffer a major defeat at the hands of pro-business parties led by the Independent National Rally party.
  3. Positive reaction to a strong results season and upgraded guidance from some of the strategy’s largest portfolio companies including Integrated Diagnostics Holdings in Egypt and Jordan and Century Pacific in the Philippines.

In our last letter, we referred to an unnamed investment in the Philippines, which we can now reveal to be Wilcon Depot Inc., the largest home improvement retailer with 70 stores nationwide. Our investment in Wilcon was undeniably triggered by the reopening of the Filipino economy, which should unlock private building and construction activity, the main demand generator for Wilcon’s tiles, building materials, electrical and lighting, and paints lines. However, our thesis is built on a long term view of the company’s ability to leverage its scale, zero debt balance sheet, and management capacity to grow the overall market for home improvement and DIY retail, and consolidate shares from smaller and unorganized competitors who have been weakened by the Philippine’s dismal handling of the COVID-19 pandemic. Wilcon’s private label and exclusive lines are also a key element of its strategy to grow like-for-like sales and increase margins with the latter experiencing a step change (+200 basis points) in the last few quarters. This has been a key driver behind consensus upgrades as management affirmed this is the new level of profitability going forward. Wilcon’s management has done a solid job of managing the business in a very difficult environment through active SKU management, supply chain control, store network expansion, and investment in online channels.

In Morocco, the strategy owns two companies in retail and payments technology, sectors that should see real gains from the positive political picture that is emerging there. Morocco has generally been a very good market for the strategy as it benefits from political stability, low inflation, a stable currency, and a large domestic institutional liquidity pool that supports equity market valuations. The country has also been relatively successful in the handling of the COVID-19 pandemic. As travel resumes, Morocco’s large tourism industry should see a strong recovery (it represented approximately one fifth of the economy in 2019). The newly elected government has the technical and political capacity to execute on reforms that will likely only add to the investment case for Morocco and as such, we continue to be bullish on the strategy’s positioning there.

We are seeing earnings upgrades across a few of the strategy’s portfolio companies, which have also been supportive of the strategy’s recent performance. We highlight Integrated Diagnostics (IDH), the leading laboratory and diagnosis chain in Egypt, Jordan, and Nigeria, which posted exceptionally strong results in the first half of this year with revenue, operating profits and operating cash flows growing 1.4x, 2.9x, and 4.8x respectively versus the same period last year. This strong growth partly reflects a low base last year, but it is also a reflection of increased demand for COVID-19 related testing and the success that management has had in scaling its home testing services (i.e., collection of samples from home and sending test results digitally), which averaged out to 3.6k visits a day in the first half of the year. IDH signed a $45 million facility with the International Finance Corporation (IFC), which it can draw to fund inorganic growth on top of the approximate $80 million of cash on its balance sheet. We also expect IDH’s management to recommend an exceptional dividend once the year concludes given the strong cash generation this year.

We believe that the strategy is entering a strong earnings growth cycle underpinned by the reopening of economies, structural adoption of digital products and services that the portfolio is over-indexed to, innovation from aligned management teams in areas of product development and distribution, and operating leverage that will kick in on the back of sustainable efficiencies that portfolio companies have realised in the last 12-18 months. The strategy remains concentrated but geographically diverse, a reflection of a portfolio construction philosophy that is focused on generating returns from company rather than country/region and that favours long-term value creation over short term returns.

Vergent Asset Management LLP


DISCLOSURES

1. Unless otherwise stated, all data is at September 30, 2021 and stated in US dollars (US$). Source: Connor, Clark & Lunn Financial Group, Thomson Reuters Datastream.
2. Performance history for the Vergent Emerging Opportunities Strategy is that of the Vergent Emerging Opportunities Composite. The Composite has an inception and creation date of August 2018.
3. Net performance figures are stated after management fees, estimated performance fees, trading expenses and before operating expenses. Operating expenses include items such as custodial fees for pooled vehicles and would also include charges for valuation, audit, tax and legal expenses. Such additional operating expenses would reduce the actual returns experienced by investors. Past performance of the strategy is no guarantee of future performance; Future returns are not guaranteed and a loss of capital may occur. For illustrative purposes, performance fee of 20% on added value over the hurdle rate of 6% plus the management fee of 1.25% have been assumed. Actual management fees charged to a particular account may vary.
4. There is no benchmark for the Vergent Emerging Opportunities Strategy because it has an absolute return objective
5. Standard Deviation measures the dispersion of monthly returns since the inception of the strategy.
Benchmarks and financial indices are shown for illustrative purposes only, are not available for direct investment, are unmanaged, assume reinvestment of income, do not reflect the impact of any management or incentive fees and have limitations when used for comparison or other purposes because they may have different volatility or other material characteristics (such as number and types of instruments) than the Strategy. The Strategy’s investments are not restricted to the instruments comprising any one index and do not in all cases correspond to the investments reflected in such indices.
These materials (“Presentation”) are furnished by Vergent Asset Management (“Vergent”) on a confidential basis for informational and illustration purposes only. This Presentation is intended for the use of the recipient only and may not be reproduced or distributed to any other person, in whole or in part, without the prior written consent of Vergent. Certain information contained in this Presentation is based on information obtained from third-party sources that Vergent considers to be reliable. However, Vergent makes no representation as to, and accepts no responsibility for, the accuracy, fairness or completeness of the information contained herein. The information is as of the date indicated and reflects present intention only. This information may be subject to change at any time, and Vergent is under no obligation to provide you with any updates or amendments to this Presentation. This Presentation is not an offer to buy or sell, nor a solicitation of an offer to buy or sell any security or other financial instrument advised by Vergent. This Presentation does not contain certain material information about the strategy, including important risk disclosures. An investment in the strategy is not suitable for all investors, and before making an investment in the strategy, you should consult with your professional advisor(s) to determine whether an investment in the strategy is suitable for you in light of your investment objectives and financial situation. Vergent does not purport to be an advisor as to legal, taxation, accounting, financial or regulatory matters in any jurisdiction, and the recipient should independently evaluate and judge the matters referred to in this Presentation. Vergent Asset Management LLP is registered in England and Wales with its registered office address at 8th Floor, 1 Knightsbridge Green, London SW1X 7QA, United Kingdom (Companies House number OC418829) and is authorized and is an Exempt Reporting Adviser in the USA. It is regulated by the Financial Conduct Authority (FRN: 791909).
THIRD-PARTY DATA PROVIDERS
This report may contain information obtained from third parties including: Merrill Lynch, Pierce, Fenner & Smith Incorporated (BofAML), S&P Global Ratings, and MSCI. Source: Merrill Lynch, Pierce, Fenner & Smith Incorporated (BofAML), used with permission. BofAML permits use of the BofAML indices related data on an “As Is” basis, makes no warranties regarding same, does not guarantee the suitability, quality, accuracy, timeliness, and/or completeness of the BofAML indices or any data included in, related to, or derived therefrom, assumes no liability in connection with the use of the foregoing, and does not sponsor, endorse, or recommend CC&L Canada, or any of its products. This may contain information obtained from third parties, including ratings from credit ratings agencies such as S&P Global Ratings. Reproduction and distribution of third party content in any form is prohibited except with the prior written permission of the related third party. Third party content providers do not guarantee the accuracy, completeness, timeliness or availability of any information, including ratings, and are not responsible for any errors or omissions (negligent or otherwise), regardless of the cause, or for the results obtained from the use of such content. THIRD PARTY CONTENT PROVIDERS GIVE NO EXPRESS OR IMPLIED WARRANTIES, INCLUDING, BUT NOT LIMITED TO, ANY WARRANTIES OF MERCHANTABILITY OR FITNESS FOR A PARTICULAR PURPOSE OR USE. THIRD PARTY CONTENT PROVIDERS SHALL NOT BE LIABLE FOR ANY DIRECT, INDIRECT, INCIDENTAL, EXEMPLARY, COMPENSATORY, PUNITIVE, SPECIAL OR CONSEQUENTIAL DAMAGES, COSTS, EXPENSES, LEGAL FEES, OR LOSSES (INCLUDING LOST INCOME OR PROFITS AND OPPORTUNITY COSTS OR LOSSES CAUSED BY NEGLIGENCE) IN CONNECTION WITH ANY USE OF THEIR CONTENT, INCLUDING RATINGS. Credit ratings are statements of opinions and are not statements of fact or recommendations to purchase, hold or sell securities. They do not address the suitability of securities or the suitability of securities for investment purposes, and should not be relied on as investment advice.
Source: MSCI. The MSCI information may only be used for your internal use, may not be reproduced or re-disseminated in any form and may not be used as a basis for or a component of any financial instruments or products or indices. MSCI makes no express or implied warranties or implied warranties or representations and shall have no liability whatsoever with respect to any MSCI data obtained herein. This report is not approved, reviewed or produced by MSCI.