
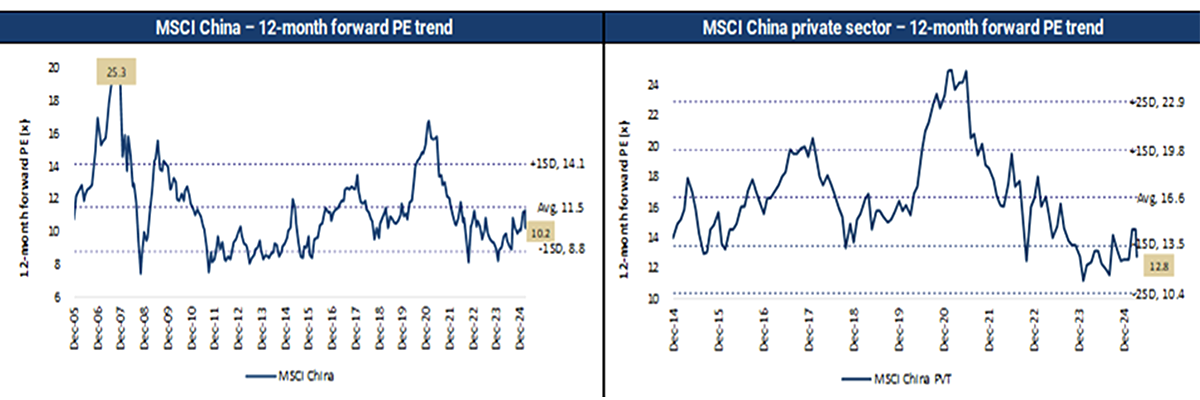
The broad market in China now trades in line with the long-term average valuations. Which begs the question, is there any fuel left in this rally?
Chinese state-owned enterprises have driven market valuations to their long-term average
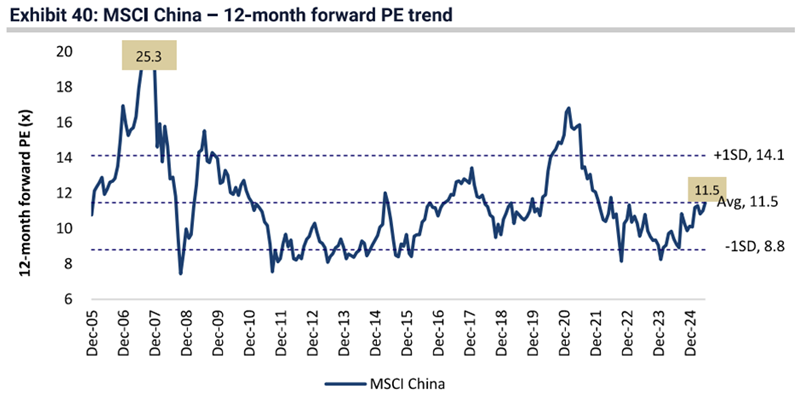
Note: MSCI weighted. Source: Jeffries, FactSet
Our kind of businesses remain cheap
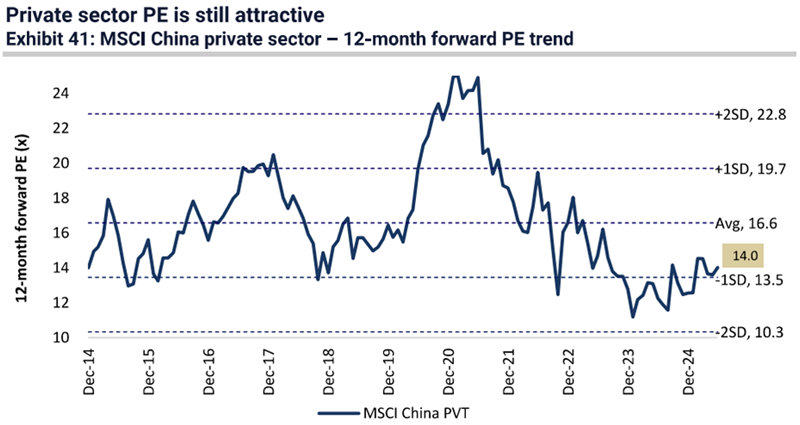
Note: MSCI weighted. Source: Jeffries, FactSet
MSCI China private sector is trading at just 14x, close to the -1 standard deviation level and c.15% below the long-term average.
Prior to the recent rally, investors had abandoned quality names despite improving profitability, cheap valuations, increasing buybacks and dividends. We are now seeing start to reverse.
China quality now ahead year to date following years of underperformance

Source: NS Partners and LSEG
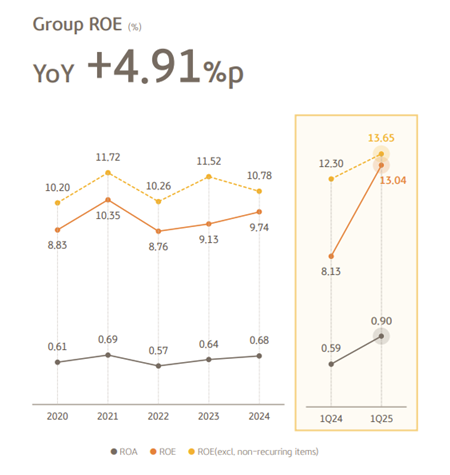
Improving returns are fuelling the rally
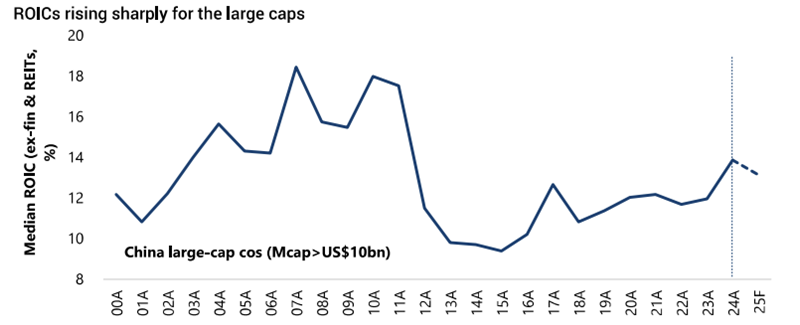
Source: Jeffries, FactSet. Note: Based on current MSCI ex-fin & REITs universe.
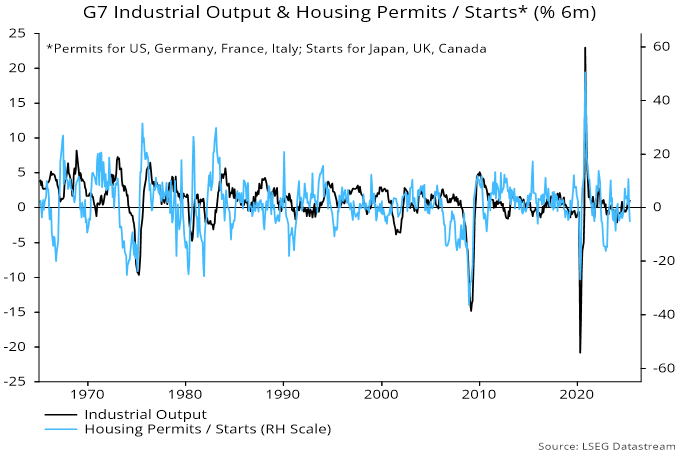
China’s electricity demand is scaling up rapidly, driven by AI, EVs, air conditioning and industrial upgrading. Renewables – especially solar and wind – are central to meeting this demand, with China uniquely positioned to scale capacity.
The rise of renewables necessitates a massive build-out of energy storage (30× increase by 2050) and grid infrastructure.
AI is a particularly powerful driver, with data centre electricity demand set to multiply several times over the next few decades. These trends are supported by robust investment and policy momentum, positioning China as the world’s largest “electrostate” by 2050.
Annual power capacity in major countries – China is on track to add over 500 GW of solar and wind capacity this year.
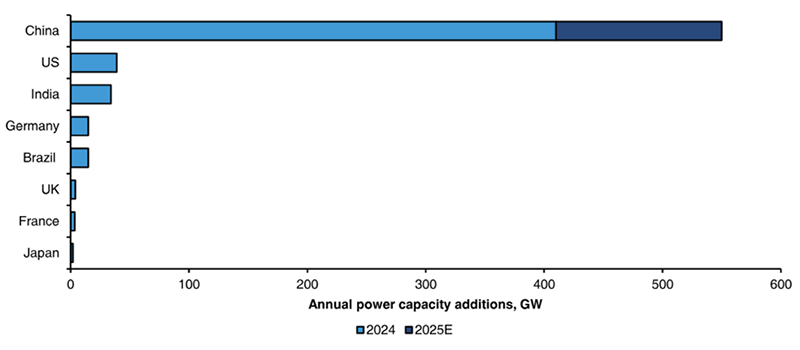
Source: Berstein and government data (2025)
With rising capacity and increasing penetration of renewables, a massive scale-up in energy storage capacity through batteries will be crucial to ensuring grid stability.
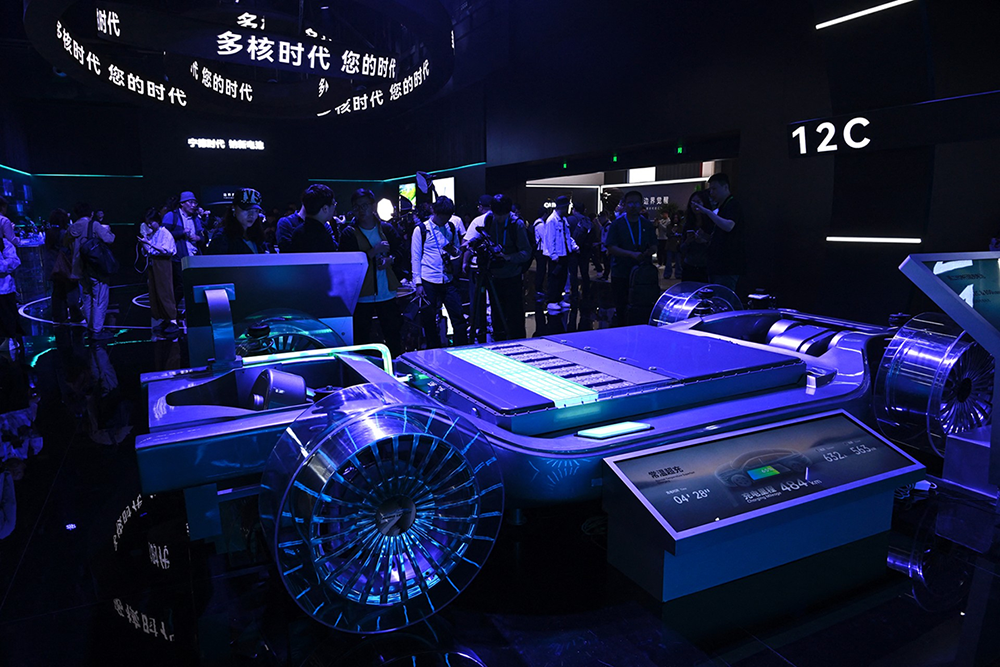
Company spotlight: Contemporary Amperex Technology (CATL) – the world’s largest battery maker
Contemporary Amperex Technology (CATL) is a vital player in providing energy storage to address power intermittency issues as China ramps up zero-carbon renewables. The company boasts a number of competitive strengths supporting sustainable earnings growth:
- CATL’s efficient production lines and scale enable it to be a cost leader with the highest GPM (20%) vs. peers.
- This advantage should be sustained as it continues to expand capacity and grow with its customers (Tesla, Chinese OEMs).
- The company is technologically ahead of the market, and its scale allows it to invest much higher absolute dollar into R&D.
You can see this dynamic in the charts below, with increasing scale unlocking a sustainable R&D edge over the competition, while capex intensity falls and free cash flows improve.
Cash generation
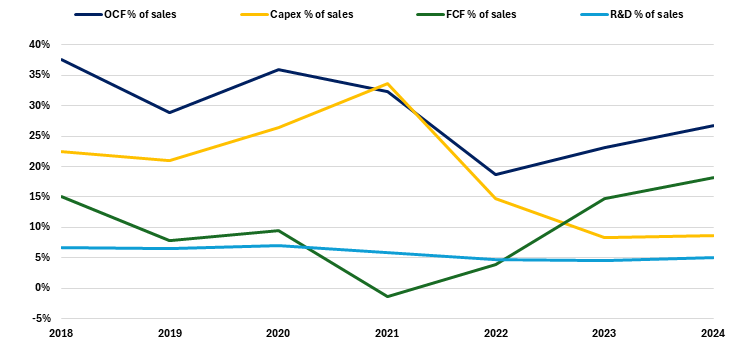
Source: NS Partners and Bloomberg
Working capital
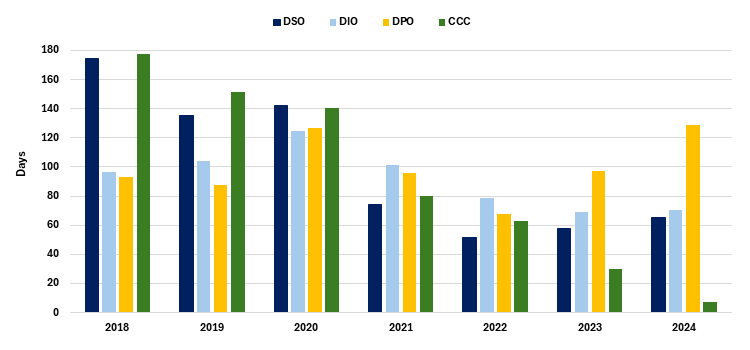
Source: NS Partners and Bloomberg
Pricing power and constant technological innovation through scale is becoming a moat that looks increasingly insurmountable for competitors around the world.
In April this year, CATL announced that it was developing fast-charge technology which can deliver 520km range in five minutes.
Source: Financial Times April 2025
This was followed in May by the unveiling of its Freevoy battery which boasts a 1500km range.
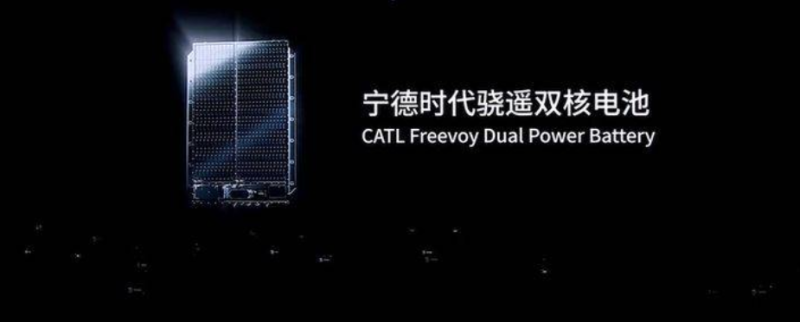
Source: Contemporary Amperex Technology Presentation May 2025.
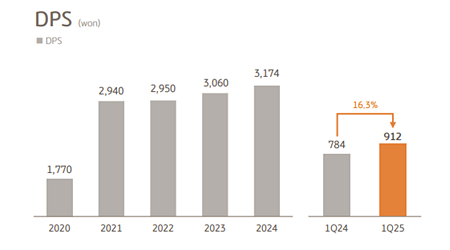
Fears over weak demand for EVs dragging on battery pricing and trade war concerns have hit the stock in recent years. This is a high-quality company trading at a very reasonable valuation, trading at trough 14.6x fwd P/E multiple.
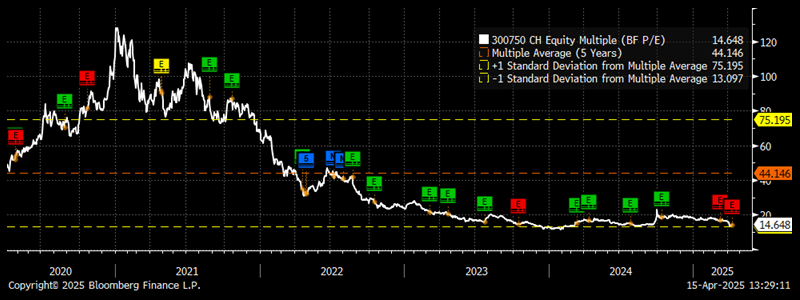
Source: NS Partners and Bloomberg
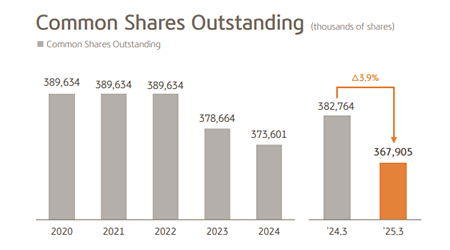
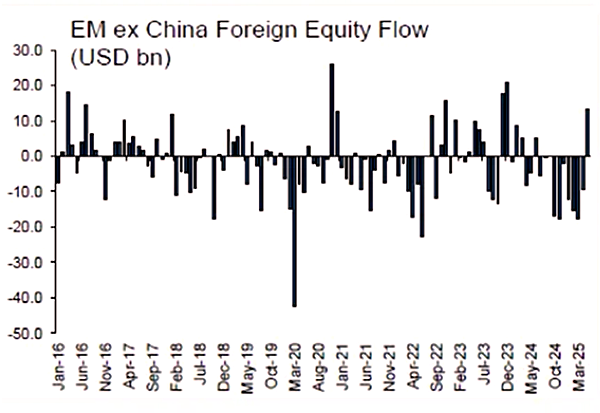
CATL is just one example of the kinds of opportunities on offer in China. The exodus of foreign investors from the market has left bargains everywhere among well-run, growing companies with lots of cash, next to no debt, with many buying back shares or announcing aggressive dividend plans.
Our portfolio is full of high-quality compounders across sectors trading at very attractive valuations. While it has been the value names, SOEs, small caps and high dividend stocks that have led the first phase of the China bull market, we think that the real gems in this phase on offer for investors remain cheap and look poised to outperform.


 Source: NS Partners and LSEG (May 2025)
 Source: LSEG Datastream