The ECB under former President Jean-Claude Trichet twice raised interest rates into oncoming recessions (in 2008 and 2011). The current ECB hasn’t raised rates yet but is scaling back QE much faster than was expected late last year.

The six-month rate of change of Eurozone real narrow money had turned negative before the 2008 / 2011 rate rises and subsequent recessions. It is about to do so again now.

In an eerie replay, M. Trichet yesterday gave an interview in which he opined that the Eurozone was “far from recession territory”.

The current ECB seems equally complacent. The staff forecast for GDP growth in 2022 was yesterday lowered from 4.2% to 3.7% but still incorporates quarterly increases of 1.0% in Q2 and Q3, i.e. a combined 2.0% or 4% annualised.

The “best” monetary leading indicator of Eurozone GDP, according to the ECB’s own research, is real non-financial M1, i.e. holdings of currency and overnight deposits by households and non-financial corporations deflated by consumer prices.

The six-month change in real non-financial M1 fell to zero in January and is likely to have been negative in February, based on a further increase in six-month consumer price momentum – see chart 1.

Chart 1

Chart showing Eurozone Narrow Money & Consumer Prices.

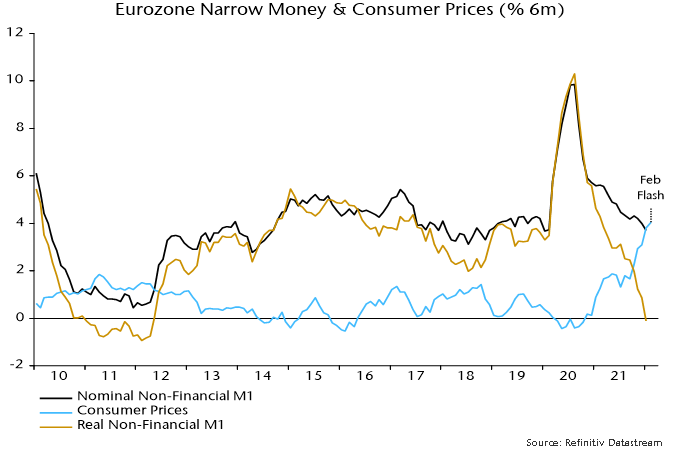
The six-month real narrow money change was negative in 18% of months between 1970 and 2019. The average change in GDP in the subsequent two quarters combined was zero. The average since the inception of the euro in 1999 was -0.8%.

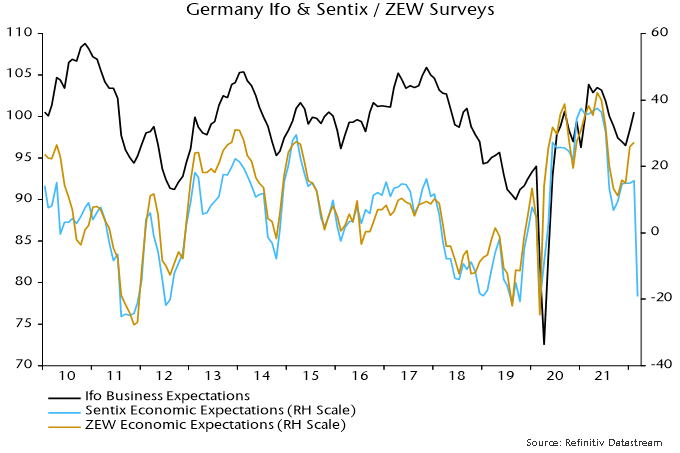
Business surveys could be about to crater: the March Sentix survey of financial analysts is ominous – chart 2. The ECB and consensus may portray weakness as a temporary response to Russia’s invasion of Ukraine, drawing a parallel with past geopolitical events that had little lasting economic impact. Monetary trends suggest that a slowdown to stall speed was already in prospect and the Ukraine shock may tip the economy over into recession.

Chart 2

Chart showing Germany Ifo & Sentix / ZEW Surveys.

The ECB is in a policy bind of its own making. The view here is that it is too late to tighten and the only option is to ride out the current inflation storm. The worry for policy-makers is that inflation expectations will become “unanchored”. Fake hawkish rhetoric backed by fantasy GDP forecasts may be their attempted escape route.

Recent US dollar weakness against the euro, like the rally earlier in 2021 and a May-December 2020 slide, may reflect differential growth in net lending to government by the Fed and ECB. Fed net lending has been rising faster recently, possibly contributing to an excess supply of dollars, but the ECB may move back into the lead in H2, suggesting support for the US currency.

Eurozone balance of payments figures, available through March, show a record net outflow of direct and portfolio capital in late 2020 / early 2021. The outflow swamped the current account surplus, resulting in a record “basic balance” deficit, which may have driven a Q1 decline in EUR / USD – see chart 1.

Chart 1

Basic balance positions of currency areas, according to monetary theory, are influenced by the relative pace of domestic credit expansion (DCE), defined as bank lending to government net of government deposits plus lending to the private sector. Central banks have been a key driver of DCE in recent quarters via their QE operations and changes in their government deposit liabilities.

Chart 2 shows stocks of net government lending by the Fed and ECB, together with their ratio. A rise in the ratio implies faster “liquidity creation” by the Fed than the ECB, which – other things being equal – would be expected to imply upward pressure on EUR / USD.

Chart 2

There have been three distinct phases since covid struck:

  • The Fed launched additional QE earlier and on a much larger scale than the ECB, resulting in a surge in the ratio in spring 2020. The dollar moved into excess supply, reflected in a sharp rise in EUR / USD into August, with a further move higher into year-end.
  • The Fed’s stock of net government lending went into reverse in mid-2020 as a slowdown in QE coincided with a Treasury build-up of cash in its general account at the central bank. PEPP buying, meanwhile, boosted growth of ECB net lending. The rise in relative euro supply resulted in an outflow of Eurozone capital in late 2020 / early 2021, with associated EUR / USD weakness in Q1.
  • The Fed / ECB net lending ratio rose again from January as the Treasury ran down its general account balance from more than $1.6 trn to below $800 bn currently, partly to finance $380 bn of stimulus payments over March-May. This has been reflected in a Q2 rebound in EUR / USD towards a December high of 1.23.

What next?

ECB purchases of government securities are currently running at about €110 bn per month versus Fed buying of Treasuries of $80 bn. The Treasury’s latest financing estimates assume a further fall in its balance at the Fed to $450 bn by end-July but a recovery to $750 bn by end-September. The suggestion, therefore, is that the ECB’s stock of net government lending will grow faster than the Fed’s between now and end-September.

Eurozone governments, moreover, could choose, like the Treasury, to reduce their current large cash balance with the ECB, giving an additional boost to net lending and euro supply – chart 3.

Chart 3

The Fed / ECB net lending ratio could rise further in June / July before turning down and the last three EUR / USD moves began only after a new trend had been established. H2 is looking more promising for the dollar but confirmation of a shift in relative liquidity creation is required.