While market commentary in late 2025 focused on the question of the sustainability of high valuations of mega-cap US technology stocks, Canadian equities quietly delivered material outperformance, as illustrated below. This phenomenon was not restricted to large cap stocks as the TSX Small Cap Index was up a remarkable 50.2%, outpacing the Russell 2000 at 7.5%, in CAD.
Exceptional Year for Canadian Equities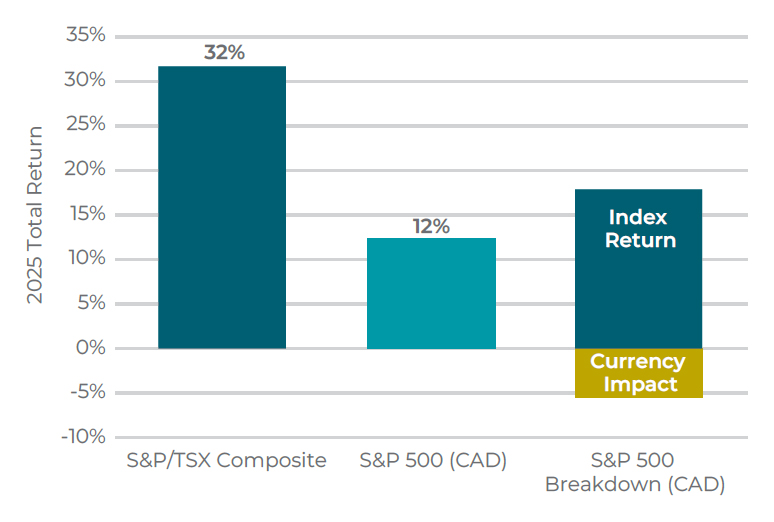
Source: S&P Global Intelligence
We may look back at 2025 as a positive inflection point for the Canadian economy with multiple drivers now in place to enhance future growth prospects.
Market Leadership Rotates — Often for Long Periods
History demonstrates that Canadian and U.S. equity markets experience long cycles of relative outperformance and underperformance. US equities have outperformed for 10+ years following the Global Financial Crisis until more recently, while Canadian equities outperformed in the 10+ years following the bursting of the technology bubble in the late 90s:
Market Leadership Rotates Over Extended Periods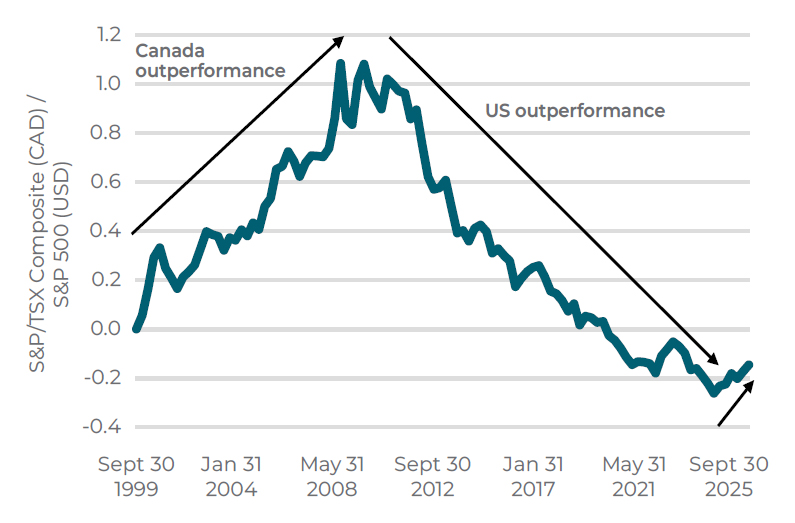
Source: Bloomberg
The Case for Continued Canadian Equity Outperformance
While relative performance cycles are difficult to predict, there are several tailwinds that should support Canadian outperformance going forward.
1. Canadian Economy at an Inflection Point
Canada’s productivity decline during the ‘Lost Decade’ from 2015 to 2025 is well documented, as are the challenges facing the domestic economy as a result of changing US nationalism and trade policy. However, we may look back at 2025 as a positive inflection point for the Canadian economy with multiple drivers now in place to enhance future growth prospects:
- Structural exposure to secular growth industries: Canada has outsized exposure to energy and materials critical to rising global power demand. Electrification, AI infrastructure and grid investment are driving sustained demand for copper, natural gas and uranium, while years of underinvestment limit new supply. In addition, de-globalization and protectionist trade policies increase the risk of persistently higher inflation, supporting elevated precious metals prices.
- Fiscal policy turning from drag to tailwind: Recent U.S. trade actions have accelerated a shift in Canada’s fiscal approach. The new federal government under Prime Minister Carney is pursuing a more pro-growth, pro-business agenda focused on investment, targeted spending and tax relief. We estimate these measures could add ~40bps to GDP growth each year over the medium term, marking a clear economic inflection point.
- Monetary policy now firmly supportive: The Bank of Canada has cut rates by nearly 300bps over the past 18 months, moving policy decisively into accommodative territory. Easier financial conditions should support growth, investment and earnings across the Canadian equity market.
2. Attractive Equity Market Dynamics
Improved economic growth does not always translate into equity market outperformance. There are several unique attributes of the S&P TSX Composite Index though, that bode well for future performance:
Compelling Valuations and Attractive Sector Composition
The lower P/E multiple for the TSX relative to the S&P 500 is often attributed to its lower exposure to high-growth, mega-cap technology-related stocks. While the technology-related exposure weight is much larger in the S&P 500, investors may be surprised to learn that virtually all sectors are more attractively valued in the TSX, despite very similar estimates for earnings growth in 2026, as illustrated below:
Expect Strong Earnings Growth in 2026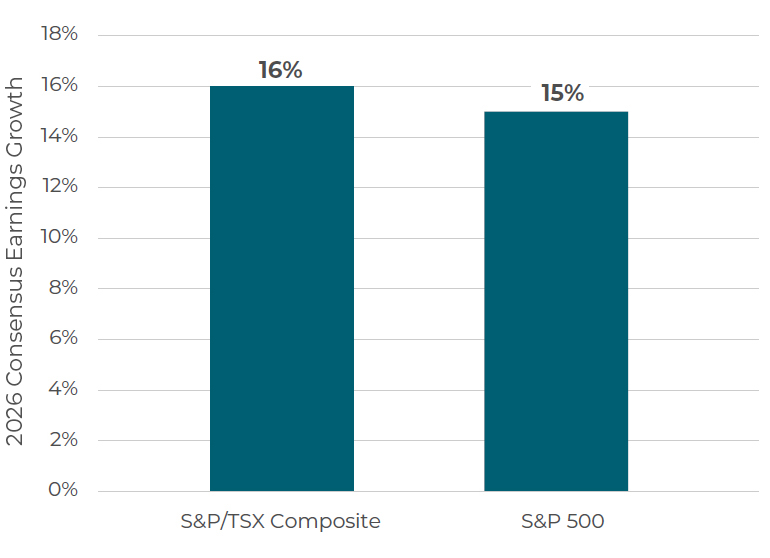
Source: Bloomberg, as of December 31, 2025
 |
“Our team is as excited about the prospects for Canadian equities as we’ve been in at least a decade. We’re finding large, mid and small-cap opportunities that should continue to benefit from the emergence of multiple secular tailwinds. It’s a good time to be a Canadian investor.”Michael McPhillips, Portfolio Manager, Co-Chief Investment Officer & Research Director, Fundamental Equity |
Canadian Valuations More Attractive at Index and Sector Level
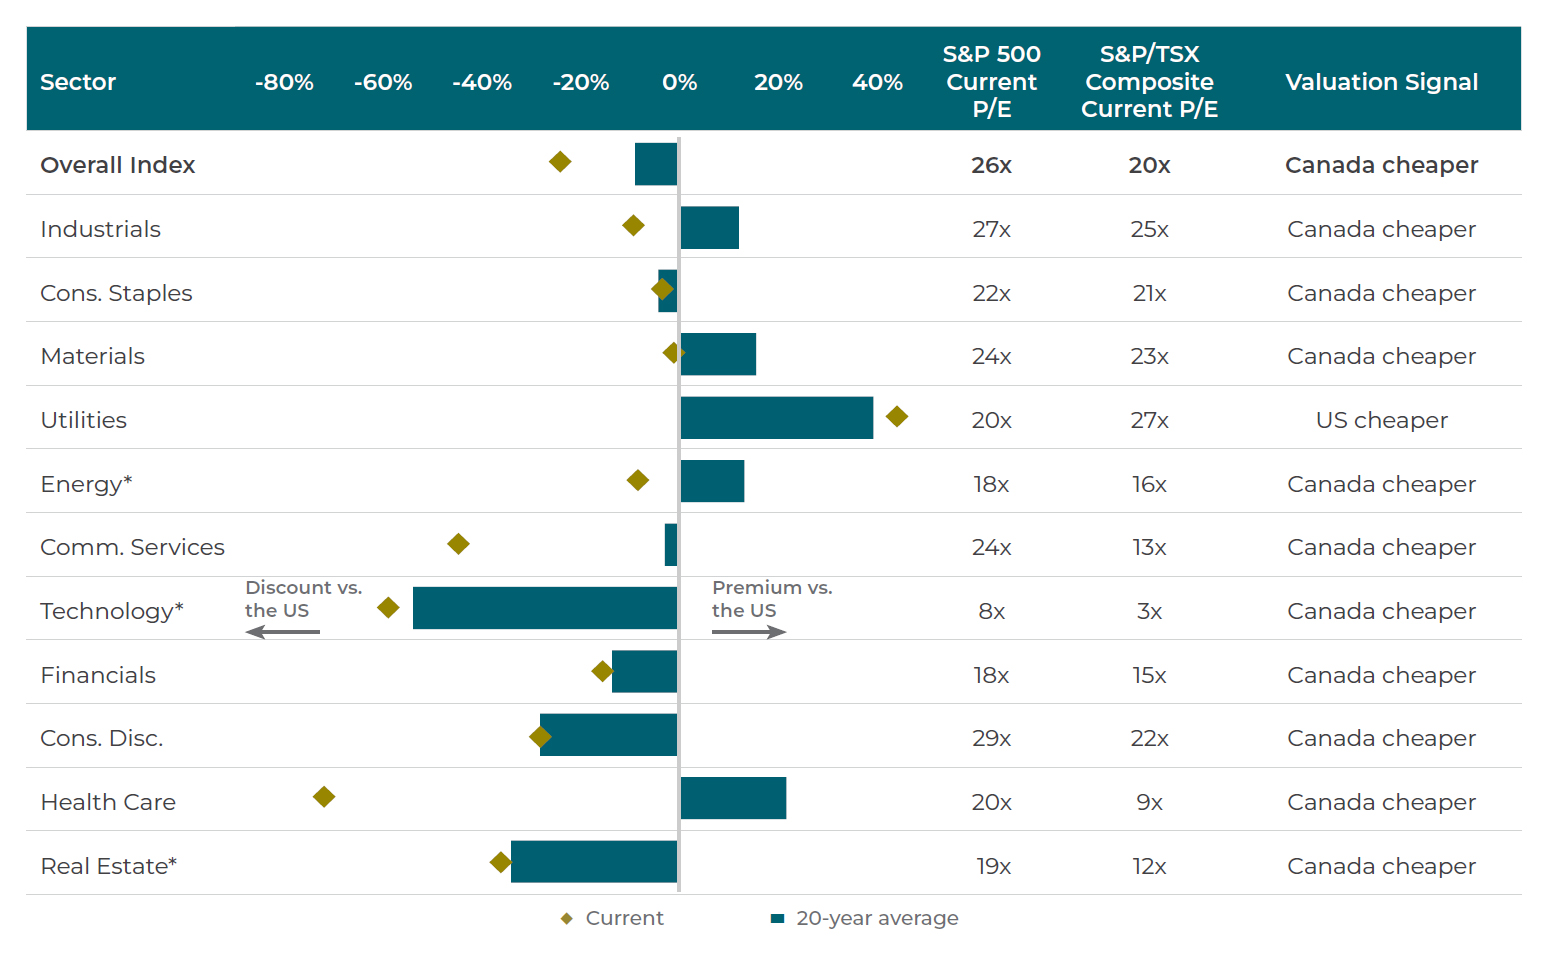
Source: Bloomberg, *for Real Estate using fwd P/AFFO, for Technology using fwd EV/Sales, Utilities using fwd EV/EBITDA and Energy using fwd P/CF. Data as of Dec 31, 2025.
Outsized Exposure to Power Generation and Gold Producers
US Leadership in Technology Complements Canada’s Strength in Commodities and Banks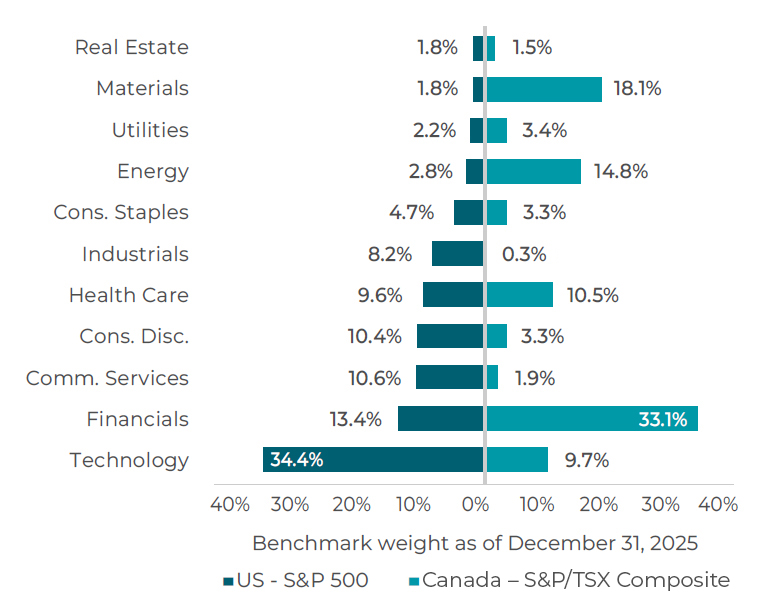
Source: S&P Global Intelligence
The table above illustrates the diversification benefits that Canadian equities provide investors who are allocated to US equities, given the very different and complementary sector exposures. Over the past decade, outsized Technology exposure has been a driver of US equity market outperformance.
However looking forward, we expect that the strong representation of companies linked to power generation and gold production in Canadian equity markets will be a strong contributor to performance:
Canadian Companies as % of MSCI ACWI Sector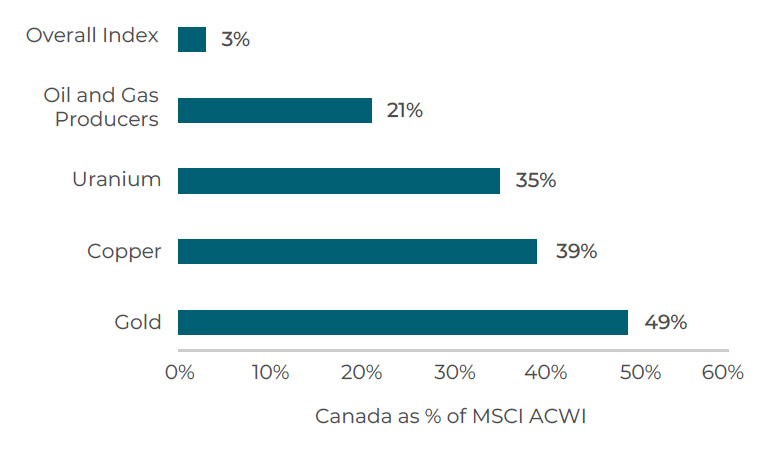
Source: S&P Global Intelligence as of December 31, 2025
With global investors seeking to access these types of assets and to diversify their US equity exposure, the return of foreign investors could produce a further tailwind.
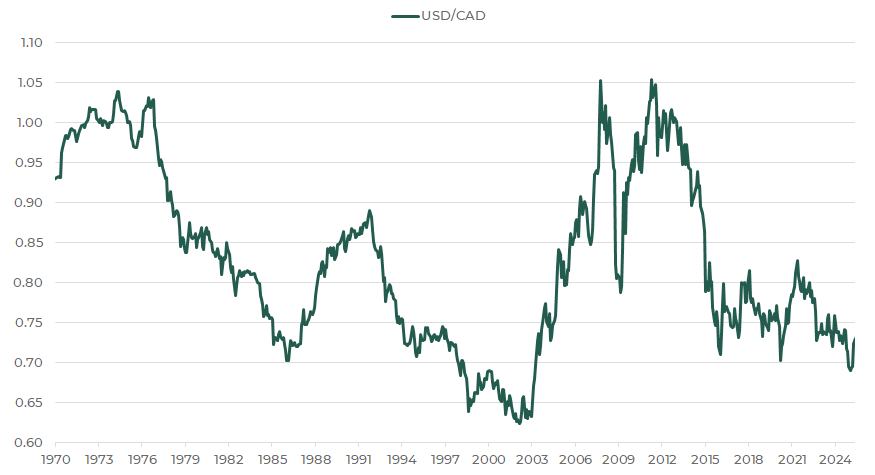
3. Currency Stability Matters for CAD-Based Investors
Currency risk is often underappreciated until it becomes material. Over the past 12 months alone, the Canadian dollar has experienced approximately a +10% move versus the U.S. dollar. For investors with Canadian-dollar liabilities — pensions, endowments, insurance pools, or domestic spending needs — this represents a meaningful source of portfolio volatility.
CAD/USD Spot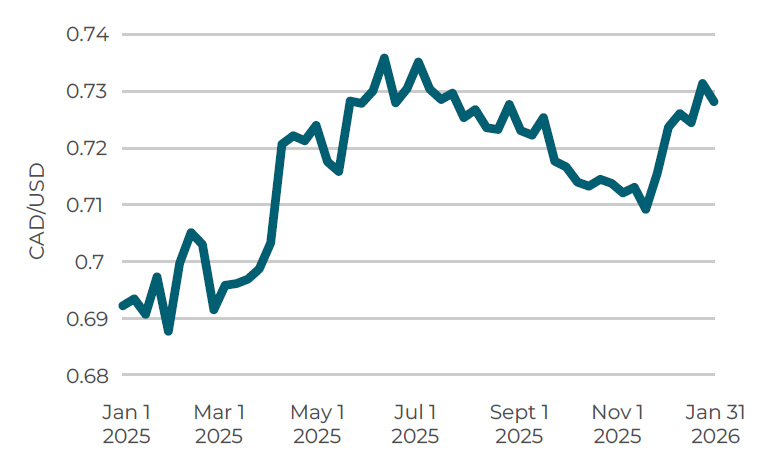
Source: Bloomberg
The main driver of this currency move has been twofold. First, a diminished view of the USD as a safe haven asset by global investors has led to diversification into gold and other assets. The strong representation of gold and other commodity producers in the Canadian equity market have compounded this strength in the Canadian dollar. With each of these trends expected to persist, currency could remain a headwind for CAD-based investors owning US equities.
4. An Attractive Market for Active Management
As with virtually all liquid markets, Canadian equity investors can choose between active and passive exposure.
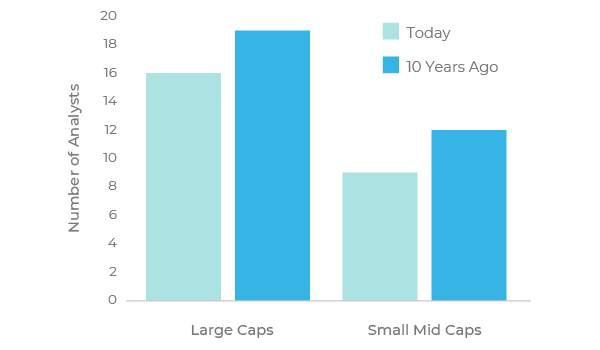
We believe that Canadian equities offer a far more compelling opportunity for active managers relative to US equities. Using analyst coverage as an indication of how efficiently stocks are priced, certainly supports that assertion, as illustrated below. Consider an example relating to pure-play beneficiaries of AI: US listed NVIDIA is covered by more than 90 sell-side analysts, versus only ~18 for Celestica, Canada’s AI analogue. As dispersion within and across sectors increases amid an uneven economic recovery, we expect stock selection to be an increasingly important driver of returns, positioning active management in Canada particularly well.
Canadian Market is Less Efficient
Fewer Analysts Cover the Canadian Market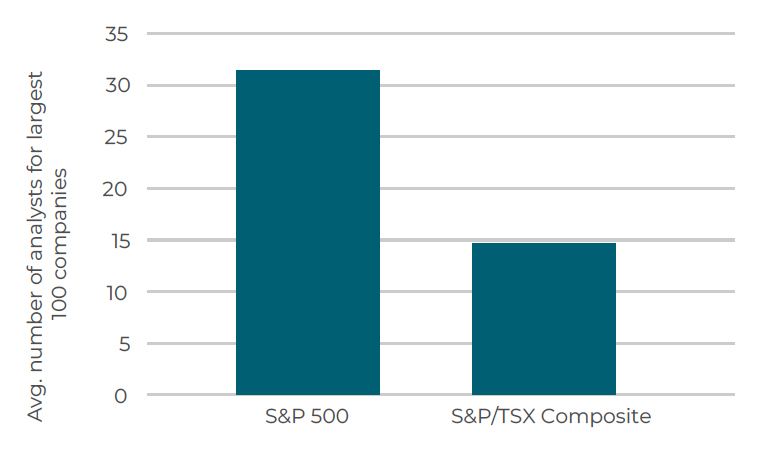
Source: Bloomberg. Data as of Dec 31, 2025.
Risks to Our Outlook
The primary risk we are monitoring is heightened geopolitical uncertainty, particularly around the renegotiation of CUSMA. While U.S. trade rhetoric has intensified and created pockets of volatility, the macro impact on Canada to date has been limited. Notably, Canada has added more jobs on a per-capita basis than it has lost since the start of the Trump presidency. While upcoming CUSMA negotiations are likely to generate headline risk and renewed tariff threats, the political sensitivity of inflation and cost-of-living pressures in a U.S. mid-term election year should constrain the scope for materially adverse outcomes. We continue to monitor developments closely.
Canada Blows Away Trump Era on Jobs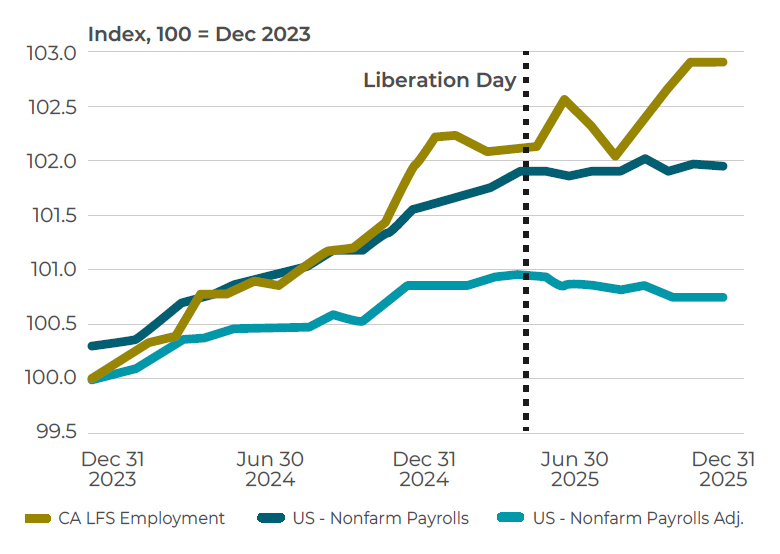
Source: Scotiabank Economics, Statistics Canada, Bureau of Labor Statistics
Conclusion
After a decade dominated by U.S. technology leadership, a regime shift is underway as the investment backdrop broadens. Canada’s equity market is uniquely aligned with the next wave of global investment, offering attractive valuations, currency stability, differentiated sector exposure, and meaningful leverage to rising demand for commodities. With a structurally favourable environment for active management, Canadian equities deserve renewed and potentially increased allocation within global portfolios.
About Connor, Clark & Lunn Investment Management Ltd.
Founded in 1982, Connor, Clark & Lunn is a privately owned investment management organization dedicated to delivering outstanding client service and a wide range of attractive investment solutions to our diverse client base. We understand the investment challenges faced by individuals, pension plans, corporations, foundations, mutual funds, First Nations and other organizations, and focus our efforts on meeting their investment needs by offering a comprehensive array of investment strategies, spanning traditional and alternative asset classes in a variety of quantitative and fundamental styles.
Material presented in this article should be considered for background information only and should not be construed as investment or financial advice. Further, information on this article should not be construed as an offer or solicitation by the Connor, Clark & Lunn group of companies to provide investment management services or to buy or sell any products.
Certain securities regulations prohibit the publication of specific registration information about the registered entities in the Connor, Clark & Lunn group of companies. For more information, please contact the Connor, Clark & Lunn Compliance Department at [email protected] or 604-685-2020.