The strategy continues to be focused on identifying transformational growth companies in the Frontier and smaller Emerging markets. Africa and Asia today represent ~90% of invested capital and the strategy owns or has previously owned companies in CEE, CIS, and the Middle East. Thematically, we’re primarily invested in the three following areas:

  1. Financial inclusion and the development of the digital payments eco-system (i.e.: disruption of cash) via companies operating across a variety of sectors including in banks/microfinance, communications/media/mobile money, and software
  2. Rising health and wellness awareness which we express through consumer health companies selling niche FMCG and healthcare providers offering medical services to their customers
  3. The formalization of offline retail with a focus on the grocery and DIY category where our retailers have a large Omni-channel advantage over pure online competition as well as a scale and cost advantage over unorganized/traditional competition

Underpinning our confidence in these themes are the large addressable markets wherein our companies operate, the fragmented and weaker level of competition, and the quality of the management teams which run them (many of whom are also owners).

We highlight two such companies in this quarter’s letter.

MTN Ghana (MTNG) – the $1.8bn market cap company embodies the frontier equity story as well as any in our portfolio. MTNG is the leading telecom service provider in the West African nation of Ghana with over 24 million subscribers and a leading market share in voice (55%) and data (72%). However, what gets us excited about MTNG is “Momo”, the company’s mobile money business which is at the forefront of the digitalization of cash in the country. Similar to Mpesa in Kenya, Momo is already the winner in its market with a 98% share of all mobile money transactions and an active base of 10.2 million wallets in the country. Momo’s contribution to MTNG’s revenue has increased by ~350bps in the last two years to reach 21% in 2020. We see Momo’s growth coming from several areas including structural adoption of mobile money for peer-to-peer transfers as well as growth in value added use cases in the areas of remittances, loans and savings, and merchant services. Despite it being a $1bn+ revenue business with returns on invested capital of ~25% and an exciting fast growing fintech business, MTNG is not covered by the sell side community. This is perhaps because Ghana as a market is unclassified by MSCI and so is neither a frontier nor an emerging market by the index provider’s standards. On the buy side, many institutional investors will access MTNG via its parent company MTN Group out of South Africa, a sub-optimal way considering the multi-country operation of the parent co. This has presented us with a unique opportunity to directly own MTNG at ~5x price to earnings over the last two years. Even after a strong re-rating year-to-date, the stock is still trading below 7.5x trail 12m earnings with a dividend yield of +8%.

Unicharm Indonesia (UCID) – the $480m market cap company is the leading baby diaper and female sanitary brand in the country of ~250m people. Indonesia has one of the lowest penetration rates of baby diaper products in the world yet is expected to generate the second biggest growth in value terms in Asia Pacific after China. This is driven by demographics (over 4 million babies are born every year in Indonesia) and higher penetration rates driven by investments in innovation and distribution (UCID sells single diapers in certain retail channels to make the product affordable). UCID has nearly 47% of the baby diapers market in Indonesia which makes it almost 2x larger than its nearest competitor which puts it in a strong position to capture the growth in the market over the long term. UCID is also the market leader in sanitary female products and adult diapers which are high margin categories given competitive intensity is lower and premiumization opportunities larger (relative to baby diapers). While the top down opportunity is attractive, UCID has low operating margins compared to global peers. We attribute this mainly to the baby diaper category where consumers prioritize price over quality; consumers in Indonesia are predominantly price driven in their choices across most FMCG products and a high percentage of the target market (parents) still view baby diapers as a discretionary product. We do not foresee a change in consumer preferences in the near term in light of the impact that Covid-19 has inflicted on purchasing power. That being said, we are still expecting margins to trend upwards as the recent entry of Kimberly Clark via the acquisition of UCID’s main competitor Sofitex is likely to bring more pricing discipline to the market by way of lower promotional activity (note: the acquisition of Sofitex was done at 3x EV/Sales compared to 0.5x EV/Sales for UCID which on its own is an indication of the undervaluation present in the shares of UCID today). As the Indonesian economy reopens, we expect UCID’s general trade channel to also open up and offer another tailwind to margins over the next two years as the company earns a higher net price compared to the modern channel which is dominated by established mini market chains. We also see the development of the e-commerce channel as potentially positive for UCID’s margins as that targets a more affluent consumer base that buys more (volume) and better (quality). We’ve increased exposure to UCID over the last month having been encouraged by latest commentary from management on the competitive dynamics in the market following the entry of Kimberly Clark which we believe is a key catalyst for the thesis.

In conclusion:

The opportunity set for the strategy continues to be attractive despite the visible underperformance relative to emerging markets. A recent FT column by Simon Edelsten brought to light a phenomenon we’ve been talking about for some time: almost 2/3rd of the MSCI EM is in three countries (China, South Korea, and Taiwan) that have “emerged” if one judges by income levels, demographics, and market efficiency to paraphrase the article. In that light, we continue to see the frontier and emerging markets in which we specialize as a truer reflection of the classic emerging market story. Translating that opportunity to returns is still about selecting the right stocks for the long term and we believe our portfolio reflects that in its current composition.

Vergent Asset Management LLP


DISCLOSURES
1. Unless otherwise stated, all data is at March 31, 2021 and stated in US dollars (US$). Source: Connor, Clark & Lunn Financial Group, Thomson Reuters Datastream.
2. Performance history for the Vergent Emerging Opportunities Strategy is that of the Vergent Emerging Opportunities Composite. The Composite has an inception and creation date of August 2018.
3. Net performance figures are stated after management fees, estimated performance fees, trading expenses and before operating expenses. Operating expenses include items such as custodial fees for pooled vehicles and would also include charges for valuation, audit, tax and legal expenses. Such additional operating expenses would reduce the actual returns experienced by investors. Past performance of the strategy is no guarantee of future performance; Future returns are not guaranteed and a loss of capital may occur. For illustrative purposes, performance fee of 20% on added value over the hurdle rate of 6% plus the management fee of 1.25% have been assumed. Actual management fees charged to a particular account may vary.
4. There is no benchmark for the Vergent Emerging Opportunities Strategy because it has an absolute return objective
5. Standard Deviation measures the dispersion of monthly returns since the inception of the strategy.
Benchmarks and financial indices are shown for illustrative purposes only, are not available for direct investment, are unmanaged, assume reinvestment of income, do not reflect the impact of any management or incentive fees and have limitations when used for comparison or other purposes because they may have different volatility or other material characteristics (such as number and types of instruments) than the Strategy. The Strategy’s investments are not restricted to the instruments comprising any one index and do not in all cases correspond to the investments reflected in such indices.
These materials (“Presentation”) are furnished by Vergent Asset Management (“Vergent”) on a confidential basis for informational and illustration purposes only. This Presentation is intended for the use of the recipient only and may not be reproduced or distributed to any other person, in whole or in part, without the prior written consent of Vergent. Certain information contained in this Presentation is based on information obtained from third-party sources that Vergent considers to be reliable. However, Vergent makes no representation as to, and accepts no responsibility for, the accuracy, fairness or completeness of the information contained herein. The information is as of the date indicated and reflects present intention only. This information may be subject to change at any time, and Vergent is under no obligation to provide you with any updates or amendments to this Presentation. This Presentation is not an offer to buy or sell, nor a solicitation of an offer to buy or sell any security or other financial instrument advised by Vergent. This Presentation does not contain certain material information about the strategy, including important risk disclosures. An investment in the strategy is not suitable for all investors, and before making an investment in the strategy, you should consult with your professional advisor(s) to determine whether an investment in the strategy is suitable for you in light of your investment objectives and financial situation. Vergent does not purport to be an advisor as to legal, taxation, accounting, financial or regulatory matters in any jurisdiction, and the recipient should independently evaluate and judge the matters referred to in this Presentation. Vergent Asset Management LLP is registered in England and Wales with its registered office address at 8th Floor, 1 Knightsbridge Green, London SW1X 7QA, United Kingdom (Companies House number OC418829) and is authorized and is an Exempt Reporting Adviser in the USA. It is regulated by the Financial Conduct Authority (FRN: 791909).
Third-party data providers
This report may contain information obtained from third parties including: Merrill Lynch, Pierce, Fenner & Smith Incorporated (BofAML), S&P Global Ratings, and MSCI. Source: Merrill Lynch, Pierce, Fenner & Smith Incorporated (BofAML), used with permission. BofAML permits use of the BofAML indices related data on an « As Is » basis, makes no warranties regarding same, does not guarantee the suitability, quality, accuracy, timeliness, and/or completeness of the BofAML indices or any data included in, related to, or derived therefrom, assumes no liability in connection with the use of the foregoing, and does not sponsor, endorse, or recommend CC&L Canada, or any of its products. This may contain information obtained from third parties, including ratings from credit ratings agencies such as S&P Global Ratings. Reproduction and distribution of third party content in any form is prohibited except with the prior written permission of the related third party. Third party content providers do not guarantee the accuracy, completeness, timeliness or availability of any information, including ratings, and are not responsible for any errors or omissions (negligent or otherwise), regardless of the cause, or for the results obtained from the use of such content. THIRD PARTY CONTENT PROVIDERS GIVE NO EXPRESS OR IMPLIED WARRANTIES, INCLUDING, BUT NOT LIMITED TO, ANY WARRANTIES OF MERCHANTABILITY OR FITNESS FOR A PARTICULAR PURPOSE OR USE. THIRD PARTY CONTENT PROVIDERS SHALL NOT BE LIABLE FOR ANY DIRECT, INDIRECT, INCIDENTAL, EXEMPLARY, COMPENSATORY, PUNITIVE, SPECIAL OR CONSEQUENTIAL DAMAGES, COSTS, EXPENSES, LEGAL FEES, OR LOSSES (INCLUDING LOST INCOME OR PROFITS AND OPPORTUNITY COSTS OR LOSSES CAUSED BY NEGLIGENCE) IN CONNECTION WITH ANY USE OF THEIR CONTENT, INCLUDING RATINGS. Credit ratings are statements of opinions and are not statements of fact or recommendations to purchase, hold or sell securities. They do not address the suitability of securities or the suitability of securities for investment purposes, and should not be relied on as investment advice.
Source: MSCI. The MSCI information may only be used for your internal use, may not be reproduced or re-disseminated in any form and may not be used as a basis for or a component of any financial instruments or products or indices. MSCI makes no express or implied warranties or implied warranties or representations and shall have no liability whatsoever with respect to any MSCI data obtained herein. This report is not approved, reviewed or produced by MSCI.

Global automobile sales decreased by 15% in 2020, amid the ongoing COVID-19 pandemic. Meanwhile, sales of battery electric vehicles (BEVs) and plug-in hybrid electric vehicles (PHEVs) were more resilient to the crisis, growing by 43% to more than 3 million. The global market share of BEVs and PHEVs increased from 2.5% in 2019 to 4.2% in 2020, and is expected to reach 38% by 2030. The growth is attributed to tightening emission regulations, favourable government incentives, improved technology, and better affordability. Europe and China have been leading the way in EV adoption, each accounting for over 40% of global EV shipments in 2020. Germany is now the second largest market after China, with 394,943 units sold in 2020.

Tesla was the best-selling brand in 2020, delivering half a million units, up roughly a third from its 2019 results. German carmaker Volkswagen Group (VW) is still trailing Tesla for EV sales, but the gap is closing fast. VW delivered 231,600 BEVs in 2020, tripling its deliveries in 2019, and is expected to surpass Tesla to be the biggest EV maker by 2025, if not sooner. In fact, VW has already become the number one EV maker in Europe in 2020. On its first Power Day held in mid-March 2021, VW laid out its plan to expand its e-mobility business by 2030, including building six gigafactories in Europe, using unified cell technology to lower battery costs by 30-50%, and expanding its global fast-charging network. The company targets 70% of all the cars sold by VW Group to be pure electric by 2030. Many other traditional carmakers have similar targets. BMW, for example, projects that fully electric models will account for at least 50% of their global deliveries by 2030; Renault-Nissan-Mitsubishi expects half of its EU launches will be pure-electric by 2025; Honda aims for 100% of its EU auto sales to be electric by 2025. It is estimated that the number of EVs sold will rise to 30 million in 2028, and EVs will represent nearly half of all passenger cars sold globally by 2030.

Increasing adoption of EVs also means growing demand for metals. The demand for copper, for example, is expected to increase tenfold between 2019 and 2030. Copper is used throughout electric vehicles and in charging stations and supporting infrastructure, due to the metal’s durability, high conductivity and efficiency. On average, an internal combustion engine (ICE) car contains 23kg of copper. Conversely, a BEV takes around 83kg of copper, about three times more. On top of this, several other secular trends are also driving demand for copper, including the increased consumer use of electronics and clean energy transition. In fact, copper is used in nearly all green technologies, particularly solar PV, wind, and energy storage. Fitch Solutions forecasts a shortfall of 489,000 tons of copper in 2024, and a shortfall of 510,000 tons in 2027. Recycling is an important part of the solution to meet future copper demand, as copper can be recycled as often as desired without a loss of quality. Currently, around 35% of global copper use comes from recycled copper, and this rate is expected to go higher.

Aurubis AG, one of the companies we own in our portfolios, is the largest copper producer in Europe, the second largest in the world, and one of the largest copper recyclers worldwide. The company produces over 1 million tons of copper cathodes annually, and they produce copper cathodes with a roughly 40% smaller CO₂ footprint than the global average for copper smelters. This is due to their high level of recycling and more efficient production methods.

Price, range, charge time, and charging infrastructure are among the main challenges to mainstream EV adoption. Enhancements to battery technology is the key to reducing the cost and improving EV’s performance. Gentherm Inc., a global leader of thermal management technologies and a holding of Global Alpha, provides a battery thermal management system. The system improves the performance of the battery packs in hybrid electric vehicles by heating the battery during cold conditions and cooling it during warm conditions, which increases the life of a battery pack. They also have a cell connecting system to provide a reliable and continuous flow of temperature and cell voltage information during the charging and discharging process, ensuring performance and safety. Horiba Ltd., another company we own in the portfolios, provides analytics and measurement equipment. While Horiba’s mainstay business is its automotive emission testing system, they also provide test and diagnostic systems for fuel cells and batteries through its subsidiary — Horiba FuelCon. The demand for fuel cells and battery testing was very strong and Horiba FuelCon tripled its production capacity in 2020. On the other hand, the demand for emission testing will not disappear any time soon, given tightening emission regulations, and the fact that emission testing is still needed for hybrid electric vehicles.  

The increasing charging demand will put significant pressure on the aging grid, especially during peak charging hours. The smart grid is the key to support this demand. With a smart grid, utilities can predict and manage EV charging. It also enables utilities to provide consumers with greater insights into their EV experience, including better understanding the cost of charging, and helping users set optimal charging preferences. Landis+Gyr Group, a holding we talked about in the weekly commentary on May 22, 2020, is a leading global provider of smart meters and smart grid solutions. Although there are delays with regulatory project approvals and installations of smart meters due to COVID-19, the mid- to long-term growth prospect remains intact. In addition to providing smart meters, Landis is making active investment in software development to add more higher-margin and less volatile revenue streams. In December 2020, Landis signed a partnership with Google Cloud to innovate the next generation cloud-based energy management solutions, which is the first partnership of this kind for the energy management industry. With a solid balance sheet, Landis is in a good position to make investments and benefit from the global megatrend.

UK money numbers continued to show absolute and relative strength in February, suggesting a coming domestic demand boom with unfavourable balance of payments and inflation consequences.

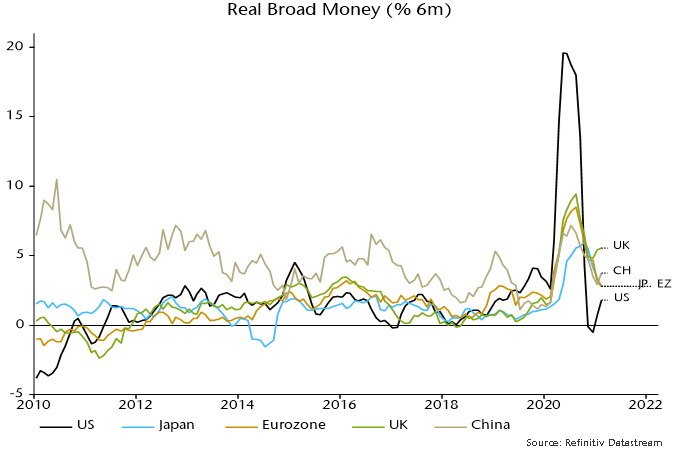
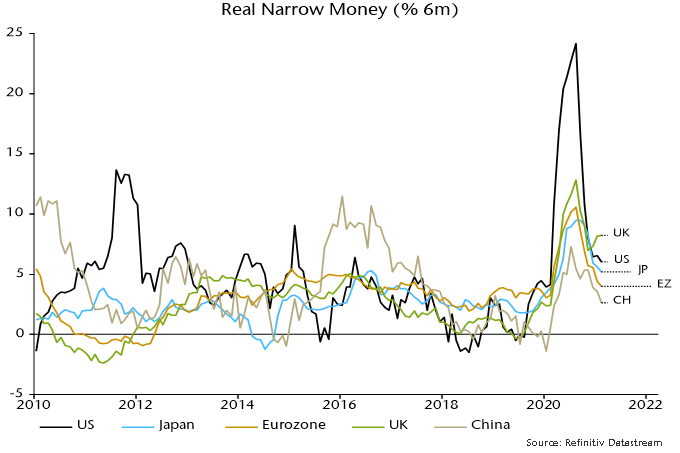
Charts 1 and 2 compare six-month growth rates of real narrow and broad money across economies. The UK tops both rankings, with recent monetary reacceleration contrasting with ongoing slowdowns elsewhere (although US growth is turning up again as stimulus payments enter bank accounts).

Chart 1

Chart 2

The preferred UK broad money measure here – non-financial M4, comprising money holdings of households and private non-financial corporations (PNFCs) – grew by 16.0% in nominal terms in the year to February. The comparable Eurozone measure – non-financial M3 – rose by 12.5%. Annualised growth rates in the latest three months were 14.4% and 9.5% respectively.

The Bank of England’s M4ex broad money measure grew by a slightly lower 15.2% in the year to February, with its annualised rate of increase slowing to 9.7% in the latest three months. M4ex also includes money holdings of financial institutions, which have fallen over the last three months* but are of limited significance for near-term demand prospects.

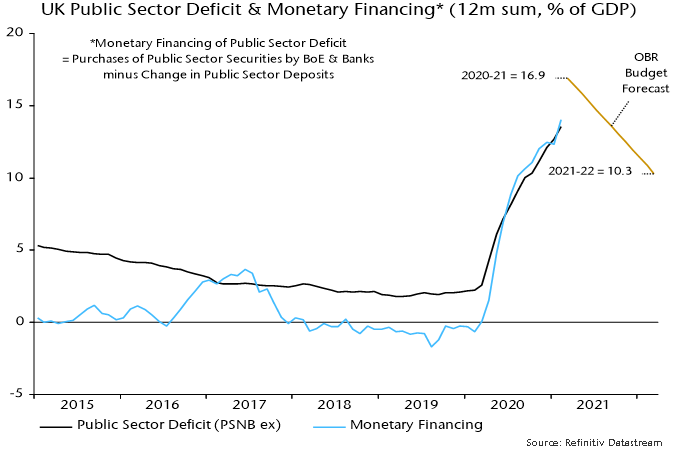
UK broad money strength reflects the large fiscal deficit and its entire financing by money creation, i.e. net sterling lending to the government by the banking system, including the Bank of England – chart 3**.

Chart 3

In 1985 then Chancellor Nigel Lawson introduced the “full funding” rule, which required deficits (and any increase in foreign exchange reserves) to be financed by net debt sales to the UK non-bank private and overseas sectors, implying no public sector contribution to broad money growth. According to this concept there has been zero funding over the last 12 months – domestic and overseas “savers” made no contribution to financing the deficit, which has been mirrored pound-for-pound by an increase in the broad money stock.

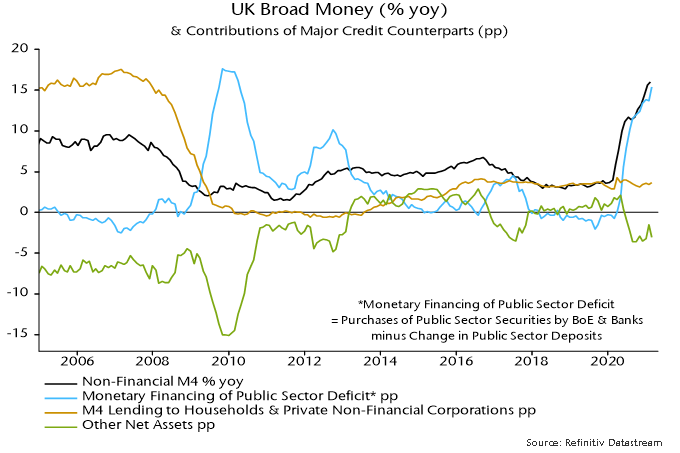
In terms of the “credit counterparts” arithmetic, monetary financing accounted for 15.4 percentage points (pp) of the 16.0% growth of non-financial M4 in the year to February. A positive contribution of 3.6 pp from sterling lending to households and PNFCs was offset by a 3.1 pp drag from other counterparts*** – chart 4.

Chart 4

The chart shows that official money creation made an even larger contribution in 2009-10, reflecting the Bank of England’s post-GFC QE programme. This was, however, needed to offset private money destruction as banks attempted to meet regulatory demands to boost their capital ratios rapidly by contracting their lending and shedding other assets. The net result was low broad money growth and inflation. There is no actual or potential monetary shortage to counteract now, and hence no monetary justification for QE on the current scale.

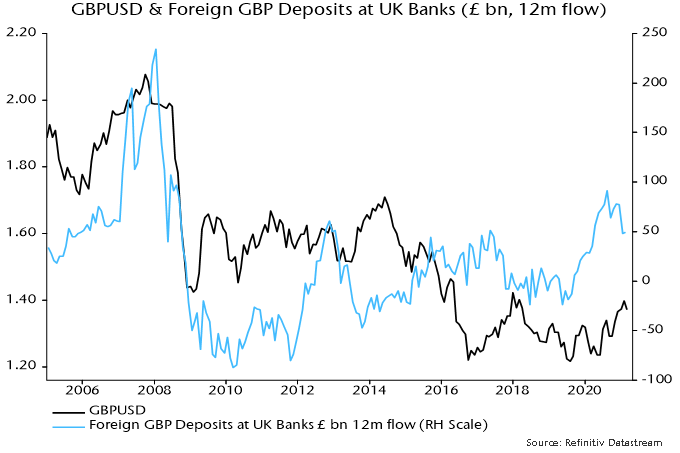
Broad money growth would have been even faster but for a diversion of liquidity into sterling bank deposits of overseas residents – monetary aggregates include deposits of domestic residents only. Overseas deposits grew by £49 bn in the year to February, equivalent to 2.6% of non-financial M4. The recent rise is the largest since before the GFC, when liquidation of the overhang of foreign balances triggered a sharp fall in sterling – chart 5.

Chart 5

Strong domestic demand prospects typically imply upward pressure on the exchange rate as expectations for monetary policy adjust. With central banks now committed to prolonged interest rate suppression, this linkage has been broken. Instead, the prospect of unchecked demand strength suggests a bigger current account deterioration and falling real rates as inflation accelerates. Central banks may be rehabilitating the monetary theory of exchange rate determination, according to which a rise in the relative supply of a currency (in this case sterling) results in depreciation.

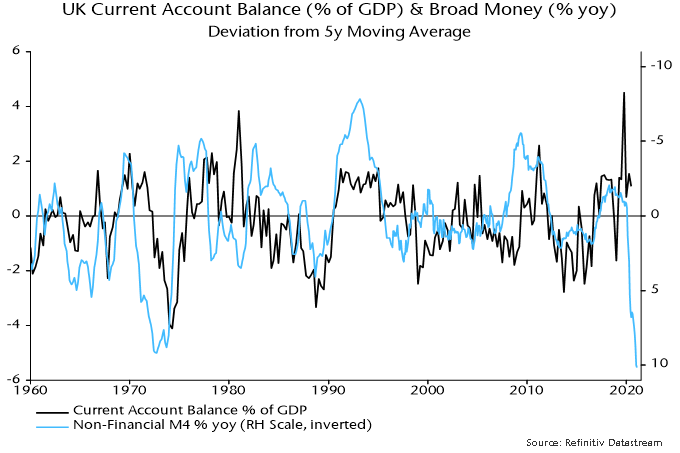
The consensus appears complacent about balance of payments risks: the average current account deficit forecast in the Treasury’s monthly survey is £80 bn in 2021 and £84 bn in 2022, essentially unchanged from £74 bn in 2020 (£79 bn excluding trade in precious metals). The view here remains that a major blow-out is possible, based on the historical relationship with broad money growth – chart 6 – and a Brexit hit to the UK’s global export share.

Chart 6

*Due to reductions in sterling bank deposits of fund managers, insurance companies and securities dealers.
**The deficit definition referred to here is public sector net borrowing excluding public sector banks (PSNB ex). The public sector net cash requirement (PSNCR) includes financial transactions and was larger than PSNB ex in the 12 months to February (£330 bn vs £286 bn), mainly reflecting Bank of England lending schemes and the student loan programme. Monetary financing accounted for 90% of the PSNCR over this period.
**Net sterling lending to UK financial institutions plus net overseas and foreign currency lending minus capital and other net non-deposit liabilities.

From the onset of the COVID-19 pandemic in 2020, questions were raised about the feasibility of hosting events, such as the Tokyo Summer Olympics, which were expected to be one of the more notable economic casualties. In what marked a year of many firsts, the International Olympic Committee (IOC) made the unprecedented decision to postpone the event to 2021, instead of cancelling it. Why is that? An easy answer would be that the only other times this decision had to be made, during World Wars I and II, decision-makers did not know how long the Olympics would have to be postponed, making it an easier choice to cancel the games altogether.

A more thorough look at the economics of Olympic events provides a more complex answer. It is well known that hosting the Olympics is a costly endeavor, and has become more so over the years as the number of participating countries and number of sports have increased significantly. Since 2000, the average cost of hosting the summer Olympics has been upward of US$5 billion in infrastructure investments and operational costs. Further, the benefits of hosting the event are heavily debated, with many arguing that there is no net benefit, even when accounting for indirect gains from tourism and other variables. As such, following the US$45 billion Beijing games in 2008 and the US$20 billion Rio de Janeiro games, many cities voiced their skepticism and withdrew their candidacy for the 2022, 2024 and 2028 games. The wave of withdrawals forced the IOC to assign the 2024 and 2028 Olympics to Paris and Los Angeles as early as 2017, as they were the only remaining viable options.

With that in mind, it is not hard to imagine why the IOC would be wary of not giving Tokyo the opportunity to recoup some of its costs after almost a decade of preparation and a well-known failed bid for the 2016 Summer Olympics and Paralympics that cost the city US$150 million. Indeed, the Olympic Committee has strict infrastructure requirements for hosting the summer games, which is usually much bigger in scope than the winter games. For example, the committee requires the host city to have a minimum of 40,000 available hotel rooms, in addition to other transportation requirements, such as airport capacity and train lines.

One of the more direct ways for host cities and the IOC to recoup their costs is through sponsorship programs. The highest level of partnership is through the Olympic Partner Programme, which grants category-exclusive marketing rights to the Summer, Winter and Youth Olympic Games to a select group of global companies and is used to fund IOC activities and costs. Created in 1985, the Olympic Partner Programme provides the IOC with a range of support, such as technology, staff deployment, marketing, essential services to athletes, and broadcasting experience.

Under the Olympic Partner Programme there are three categories of local sponsorships to support the staging of a specific Olympic event. The local sponsorship programme for the Tokyo Olympics is comprised primarily of Japanese companies that stand to enhance the image of the events. Unlike other sporting events, no commercial advertising is allowed at the venue under the Committee’s clean venue policy. Instead, the sponsors obtain various levels of rights to use Olympic and Paralympic designations and imagery, such as the logo, as well as to the right to supply their products and services to athletes and spectators.

Global Alpha owns shares in a company that is directly involved in the local sponsorship programme for the Tokyo Olympics: ASICS. ASICS is a renowned manufacturer of sports shoes, sportswear and sports equipment that sponsors many Olympic athletes around the world involved in activities such as tennis, running, wrestling and more. Headquartered in Japan, the company was created in 1949 under the name of Onitsuka Tiger. The modern name ASICS is derived from the Latin proverb “Anima Sana In Corpore Sano,” which means a “sound mind in a sound body,” and the company has remained committed to this philosophy to this day.

In 2015, the 2020 Tokyo Olympic Committee announced that ASICS was selected as a gold partner of the Tokyo 2020 Olympics, the highest local sponsorship level, and that it would be supplying the uniforms for the Japanese teams and volunteers. Under the IOC product-category exclusivity policy, ASICS is the only company allowed to advertise under the sporting goods section, often thought to be one of the more lucrative sections. We expect the company to hold up well to the scrutiny stemming from the exposure.

Strength

  • Solid brand recognition
  • Strong expertise in biomechanics and material science, reflected in their shoes’ quality
  • Outstanding ESG profile

Weakness

  • Lagging in fashionable sports shoes and sportswear

Opportunities

  • Growing worldwide interest in healthy activities, especially performance running
  • China embracing performance running, as reflected in the number of marathon events rising rapidly

Threats

  • Competition within the industry
  • Rising costs of raw material and labor

While the company is not allowed to disclose the cost of the sponsorship, it expects to spend a total of $US128.5 million on event-related expenses. Unlike some of the experiences of past host cities, there is good reason to believe that Asics will be able to make a profit from its investment, and that the event will provide a good tailwind for the company over the next few years.

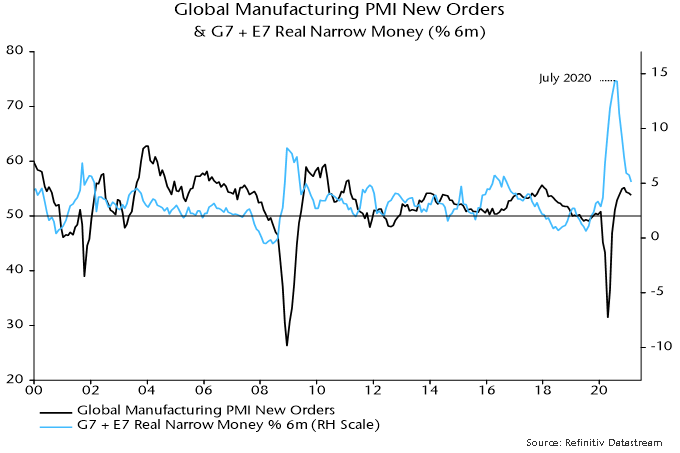
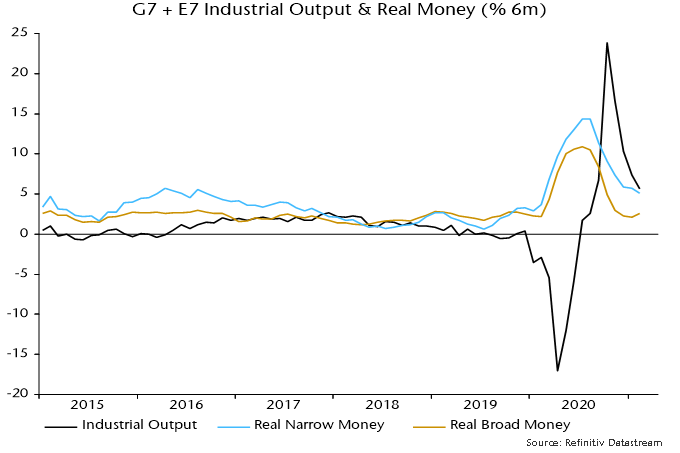
Global six-month real narrow money growth is estimated to have fallen further in February, based on monetary data covering 70% of the G7 plus E7 aggregate calculated here. The decline from a July 2020 peak suggests a slowdown in industrial momentum extending through Q3 2021.

Turning points in six-month real narrow money growth have led turning points in the global manufacturing PMI new orders index by 6-7 months on average historically. The July money growth peak, therefore, suggested a new orders peak in January-February. The current high point of the orders index is November 2020 but this may have been surpassed in March. These are details: the key point is that the index appears to be reaching a peak on schedule, with money trends suggesting a significant relapse by end-Q3.

Chart 1

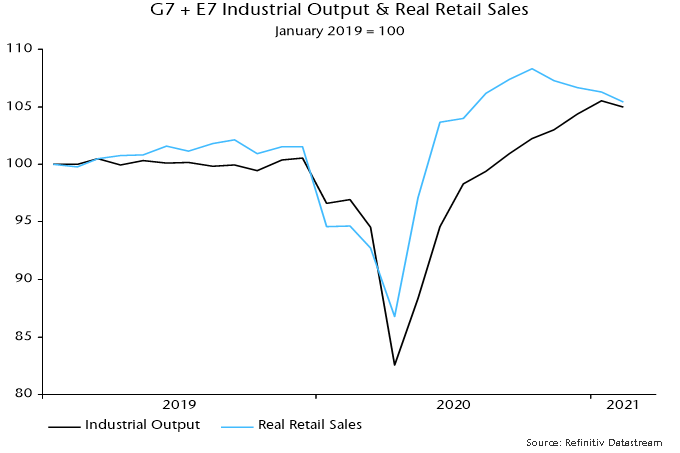
Cooler consumer goods demand is consistent with a coming industrial slowdown. Global retail sales fell between October and January, with early data suggesting another decline in February – chart 2.

Chart 2

Industrial output growth appears to have been sustained by a continued recovery in investment goods demand and – probably more importantly – a rebuilding of depleted inventories. Restocking, however, will have been accelerated by softer consumer goods demand and the associated output boost may be peaking.

A key point, often neglected, is that the level of industrial output is related to the rate of change of inventories. These are probably still lower than desired and restocking should continue. A slowdown in the rate of increase, however, is sufficient to exert a negative impact on the level of output.

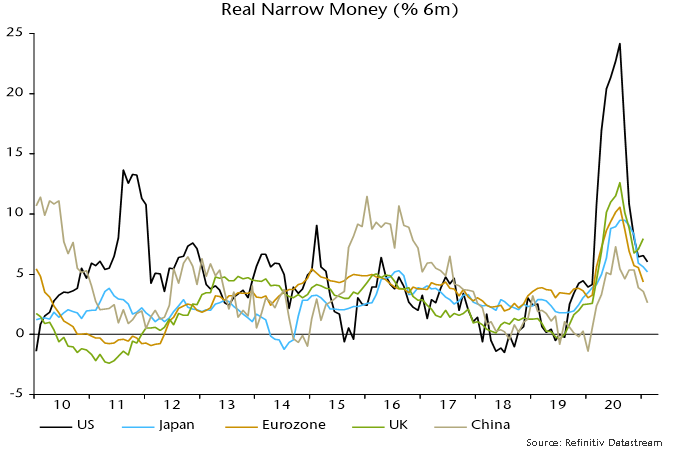
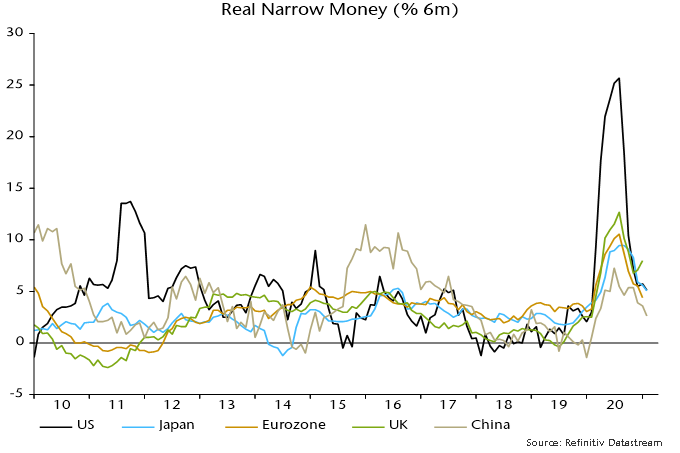
A normalisation of US six-month real narrow money growth has been a key driver of the slowdown in the global measure, although smaller declines have occurred elsewhere – chart 3. US money growth should rebound strongly in March / April as the Treasury transfers cash to households from its account at the Fed (i.e. helicopter money).

Chart 3

A US rebound could drive a pick-up in global six-month real narrow money growth, signalling industrial reacceleration in late 2021 / H1 2022. This isn’t guaranteed, however: a further inflation rise will drag on real money growth near term, while nominal money trends elsewhere may continue to cool.

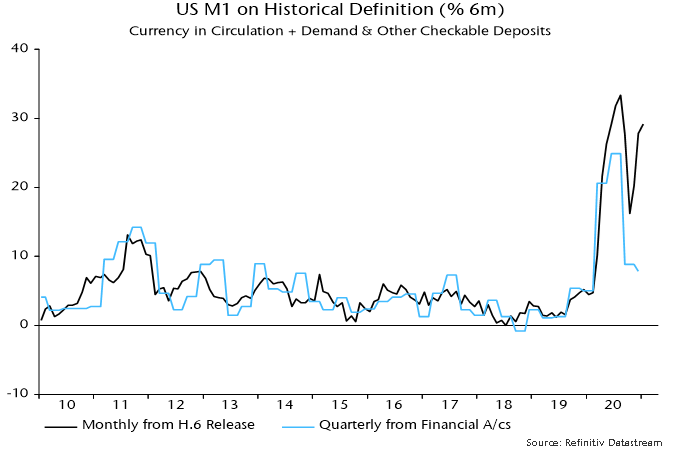
Analysis of US narrow money trends has been complicated by banks reclassifying some savings accounts as transactions accounts following a Fed decision to lift restrictions on the former. This artificially boosted the old M1 measure in 2020, particularly later in the year, when its six-month growth rate rebounded strongly – chart 4. The numbers used here attempt to correct for this distortion but the suggestion of a significant slowdown was disputed by some readers.

The debate has now been resolved by the recently released Q4 financial accounts – these contain M1 flow data adjusted for reclassifications and other discontinuities. The fall in six-month growth of the break-adjusted M1 series during H2 2020 was similar to that of the corrected measure calculated here.

Chart 4

A global industrial slowdown in Q2 / Q3 may not be reflected in GDP data because of services reopening. The latter, indeed, could contribute to industrial softening as consumer demand switches back from goods to services. The judgement here is that industrial trends are a better guide to underlying economic momentum and a more important driver of markets, partly reflecting a stronger correlation with equity market earnings.

A simple rule for switching between global equities and US dollar cash discussed in previous posts holds cash when six-month growth of global real narrow money is below that of industrial output. A negative cross-over occurred in October 2020 and – allowing for data publication lags – resulted in the switching rule recommending a move to cash at end-2020.

Real money growth was below industrial output growth in January and early indications are that this remained the case in February – chart 5. The rule, therefore, will continue to recommend cash in April and, probably, May. The rule is currently about 4% offside since the end-December switch. Such a drawdown is not unusual and compares with a 32% gain when the rule was in equities between end-April and end-December 2020.

Chart 5

COVID-19 has led to a turbulent economy characterized by faster adoption of technology, increased environmental urgency and inflation from unprecedented stimulus. The widespread government support is resulting in inflation across many goods as economy rebounds quickly. Fortunately, the debt service ratio of consumers in the United States (US) is at a 40-year low, meaning they can probably handle rising prices for some time.

While certainly not linear, inflation is exacerbated by the unprecedented stop-and-start occurring across economic sectors, especially when comparing goods versus services. Demand is high for some products such as those related to home improvement, yet low for others like restaurant equipment. Demand for goods are presently outweighing demand for services in a major way. The imbalance is inflating prices notably through a supply chain shock that has significantly increased transport prices. The US Consumer Price Index is higher by 11% y/y at the goods level, while its service counterpart is down 5% y/y.

The rush for certain goods, such as personal electronics has created a global semiconductor chip shortage. As a result of increased demand, the personal computer sector grew by 10% in 2020, and surging demand in the fourth quarter reached 25.4%. The impact of this high demand was felt across the entire technology supply chain.

Why are automakers shutting down production?

Automakers spent $43 billion on microchips in 2019, representing 10% of global semiconductor sales. Chips are more critical to automakers than automakers are to chip manufacturers. In 2020, car manufacturers planned for a 35% drop in sales, but ended up with a drop of 8%, thus they quickly needed more chips to fill inventories. These emergency chip orders went to the back of the line behind larger electronics clients, which had better estimated their future needs during the crisis. The impact on 2021 production could mean 1.5% of new cars not being available, a material number that will certainly affect availability and pricing.

The average electric car features roughly 3,000 chips. Cars have become a laboratory for human machine interface, where manufacturers continue to innovate at a frantic pace. This will certainly continue to provide us with interesting investment opportunities. There are a number of emerging human interface trends that will change the way we use our cars, including:

  • Screens: A full-screen interior, with infotainment screens up to 48 inches wide on the dashboard.
  • Voice commands: As voice recognition technology evolves, so does its complexity, with functions from adjusting following distance in adaptive cruise control, to fully self-driving cars that don’t require physical steering, braking, or acceleration input.
  • Touch to movement: BMW is already using gesture control technology, where cameras “see” hand movements to perform in-vehicle functions. Taking it further, under development is technology to give the sensation of virtual touch response in the air using ultrasound.
  • Driver assistance: Rather than the constant go, stop, and steer motions a driver must perform, driver assistance commands are alleviating the need for attentiveness and active participation.
  • Virtual assistants: Based on emotional and physical demeanor, machine learning can predetermine the best outcomes for driving routes, temperature control, communication and musical preferences.

Global Alpha is exposed to the noted trends and futuristic electronics in the automotive sector. Gentherm (THRM:US) is the uncontested leader in thermal management with heated and cooling seat systems. Among new smart products, Gentherm is launching its ClimateSense system, featuring sensors that detect heat from each passenger and optimize the climate with exterior conditions throughout the car. The company expects to save up to 50 miles driven in electrical capacity.

Cerence (CRNC:US), a leader in speech integration and digital content delivery for the automotive industry, is launching Cerence Look, a new product enabling drivers and passengers to interact with points of interests outside the car, like a machine co-pilot. Mercedes-Benz is the first carmaker to launch this technology in its Travel Knowledge feature.

These trends confirm that carmakers will continue to increase their dependence on technology and semiconductor chips.

The chip shortage will subside but could signal an onshoring trend in semiconductor production. Taiwan-centric TSMC, the world’s largest semiconductor manufacturer, controls over 70% of the world’s chip production.

Industry players sensed the importance of strategic semiconductor assets, and 2020 was one of the highest years on record in terms of M&A activity. Global Alpha is participating in this phenomenon, as three different companies have publically disclosed their offer to acquire one of Global Alpha’s holdings, Coherent (COHR:US), a leading provider of laser-based technologies to the semiconductor industry.

The chip shortage crisis provided additional insights, including a supply quasi-monopoly by TSMC with its mega factory, heightened international trade tensions, and the erratic effects of an intense stimulus or expansive monetary policy. Historically, the situation is very similar to the 1970s oil crisis, without the geopolitical catastrophe. Interestingly, the semiconductor has become the new oil; the most critical component to every machine we use. Now, we just need to hope that lessons learned from the 1970s can help us handle higher levels of inflation.

Chinese money trends have been signalling an economic slowdown in H1 2020. This appears to be playing out but the PBoC has kept policy tight and narrow money growth has fallen further in early 2020. A Chinese slowdown could derail current global reflation optimism.

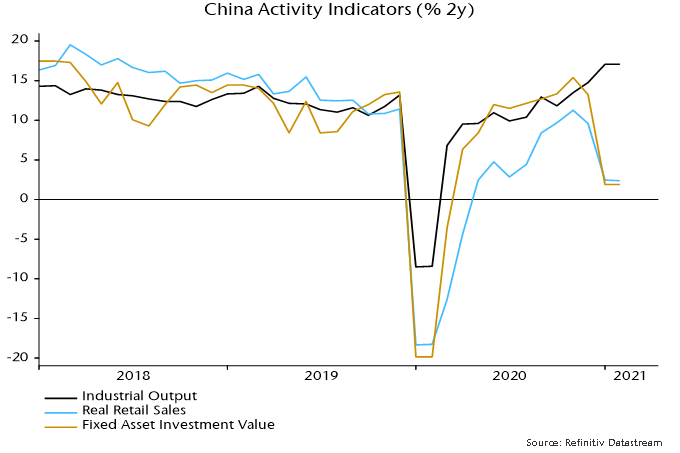
Covid base effects are distorting year-on-year growth rates of coincident economic indicators so a two-year comparison is more informative. Retail sales and fixed asset investment slowed sharply in January / February but industrial output gained further momentum – see chart 1.

Chart 1

Output strength is probably explained by additional working days due to covid travel restrictions that shortened workers’ holidays and reduced factory idling – this suggests payback in March / April. The NBS PMI manufacturing new orders index peaked in November and fell to its lowest since June last month.

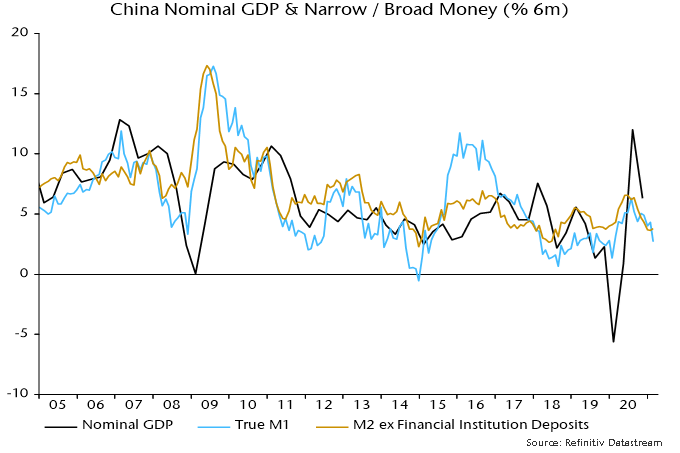
An economic slowdown had been signalled by money trends: six-month growth rates of narrow and broad money peaked over May-July 2020 at modest historical levels, moving lower during H2 – chart 2.

Chart 2

Six-month broad money growth stabilised in early 2021 but is below the post-GFC average, while narrow money growth has fallen further. Sectoral detail shows weaker expansion of both household and enterprise narrow money holdings, consistent with the joint slowdown in retail sales and private investment.

China has retained its bottom place in a ranking of six-month real narrow money growth across major economies despite falls elsewhere – chart 3.

Chart 3

The expectation here had been that the PBoC would respond to early economic slowdown signs by partially reversing its H2 2020 policy tightening. Instead, it withdrew liquidity before the holiday to protest an easing of money market rates in December / January. Three-month SHIBOR has backed up to 2.7%, almost double its low in April / May 2020.

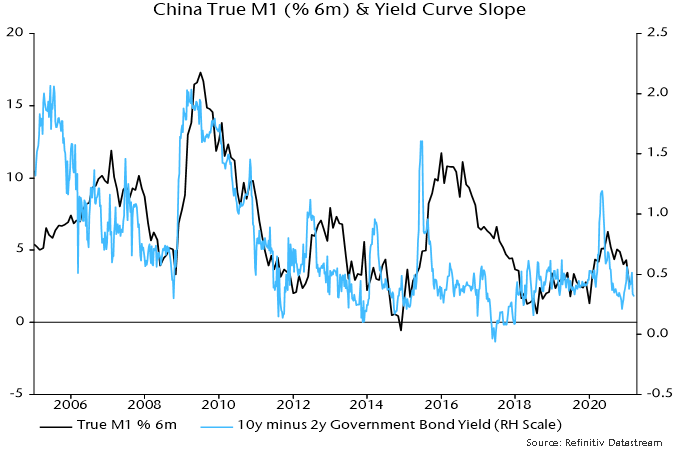
The suggestion that monetary policy is restrictive is supported by a flat yield curve – chart 4 – and weak core inflation: consumer prices ex. food and energy were unchanged in February from a year before.

Chart 4

China led last year’s economic recovery and the expectation here has been that a Chinese slowdown would presage a loss of global industrial momentum into Q3 2020. Assuming that this scenario plays out, a key question is whether new US fiscal stimulus will drive a growth rebound during H2. This will hinge on the extent to which another deficit blowout in Q2 / Q3 is reflected in US money trends. Growth of the weekly broad money series calculated here has firmed slightly – chart 5 – and a significant pick-up is likely in late March / April as households receive stimulus payments.

Chart 5

Every day we deal with vast and rapidly growing amounts of data. Some of us might even feel like we are drowning in this deep ocean of messages, emails, spreadsheets, images, sounds, and videos. To make sense of it, various organizations employ diverse data analytics tools that help them gain insights and identify new opportunities. If acted upon appropriately, they can lead to improved decisions, better outcomes, and happier stakeholders. However, we should not neglect the risks associated with data and sophisticated technology. Hackers, criminals, and terrorists also leverage technology for their benefit, often at the expense of companies, citizens, and governments. To mitigate these risks, organizations worldwide need to stay ahead of them by processing their data and identifying actionable insights.

This is exactly what Cognyte Software, one of our portfolio companies, has been enabling its clients to do. Its security analytics tools help to fuse and analyze the data siloed across organizations, connecting the dots and providing critical information at the right time to prevent multiple threats before the damage is done. The environment is highly fluid, as well-funded and organized perpetrators relentlessly evolve their skills and methods to achieve their goals and avoid detection. Security organizations, in turn, cannot afford even a moment of complacency.

This brings to mind the Red Queen effect, in that organizations must adapt and evolve to survive. Cognyte turned that challenge into a big opportunity, recognizing the need for a scalable, open-analytics platform that provides real-time, actionable intelligence that can help find a needle in a haystack. Its cutting-edge solutions are driven by artificial intelligence, and are used by the most sophisticated security organizations across the globe. In one reported case, a European client’s investigative team leveraged Cognyte’s platform to prevent a radical group from driving a large vehicle into a crowd. More than 1,000 corporate and government clients in over 100 countries see Cognyte as their reliable partner to manage their security challenges and empower them to protect lives and assets and make the world safer.

Cognyte operated as a division of Verint Systems for more than two decades until a spin-off was completed in early February 2021. As a global leader in security analytics software, Cognyte empowers governments and enterprises with actionable intelligence to address a broad range of security challenges, including threats to national security, business continuity, and cybersecurity. The company has a strong track record of solving complex security challenges and unmatched domain experience. Over 400 government customers account for 80% of total revenue, while around 600 enterprise customers make up the other 20%.

Revenue mix

  • Software revenue (42%), including primarily term-based and perpetual licenses.
  • Software service revenue (45%), including support and cloud-based SaaS subscriptions.
  • Professional service and other revenue (13%), including installation and integration services, customer-specific development work, and others.

Target market

  • Cognyte estimates its total addressable market at $30 billion, evenly divided between government and enterprise sectors, with a steady growth rate of 10% per year1. Security challenges are becoming more complex, with rapidly growing data and the increasing adoption of open analytics tools by security organizations among the key industry tailwinds.
  • The market is highly fragmented. Despite being one of the leading players, Cognyte has a market share of 1.5%.
  • Some public peers include a point solutions vendor, FireEye, and big data analytics vendors, Palantir and IBM. Cognyte differentiates itself from competitors through a focused security analytics approach, deep domain expertise, and by creating a holistic view of data in delivering actionable insights. However, Cognyte primarily competes with organizations’ in-house capabilities. Governments and enterprises have traditionally approached their security challenges with homegrown solutions. In our view, these tools cannot keep up with the evolving threats, are costly to build, and complex to maintain. For this reason, we see a secular shift towards open-analytics platforms.

Growth strategy

  • Increase penetration of existing customers.
  • New client wins.
  • Developing partners to expand in enterprise vertical.
  • Bolt-on acquisitions.

Strengths

  • Cutting-edge security analytics and artificial intelligence (AI) technology. Broad portfolio addressing a wide range of security challenges.
  • Unparalleled security domain expertise and focus.
  • High revenue visibility. Large portion of recurring revenue (~50%), significant contribution from repeat customers (~90%) and a healthy backlog1.
  • Well-diversified client portfolio (across segments and regions).
  • High customer stickiness.
  • Strong balance sheet.
  • Seasoned management team with strong track record.

Opportunities

  • Margin expansion.
  • Fast and wide adoption of open analytics software.
  • Industry roll-up opportunities.

From 2018-2020, as a division of Verint Systems, Cognyte recorded strong financial results, with revenue and EBITDA compounded annual growth rate of 8% and 26%, respectively1. EBITDA margin saw a very impressive expansion of 500 basis points to 18% over the same period. As a standalone public company, Cognyte announced three-year financial targets of double-digit revenue growth and EBITDA margin expansion, driven by faster adoption of open analytics software and ongoing revenue mix improvement. Given the strength of the underlying business and vast opportunities ahead, we believe this trajectory could prove to be conservative.

Last year’s US (and global) broad money surge is expected, on the “monetarist” view, to be reflected in a significant inflation rise over 2021-22. US broad money* growth, however, has normalised recently: six-month expansion has retreated from 41% at an annualised rate in July to 4.3% in January. Stabilisation at the current pace would suggest an eventual return of low inflation.

A key driver of the broad money slowdown has been a narrowing of the federal budget deficit after its H1 2020 blowout. The six-month rolling shortfall declined from $2.42 trn to $1.06 trn between July and January. Monetary deficit financing – net lending to the federal government by the Fed, commercial banks and money funds – has fallen accordingly.

President Biden’s stimulus package will drive another deficit surge and a reasonable base case scenario is that this will be associated with a rebound in monetary financing and broad money growth, with unfavourable implications for medium-term inflation prospects.

This monetary scenario, however, is not guaranteed.

Monetary financing by the Fed will rise substantially as the recent pace of Treasury purchases is maintained and the Treasury runs down its deposit balance at the Fed to finance the stimulus package and comply with the 2019 Bipartisan Budget Act. This could, however, be offset by reduced purchases, or even sales, by commercial banks and money funds, reflecting Treasury plans to reduce bill supply and a constraint on banks’ balance sheet expansion from the supplementary leverage ratio (SLR), assuming that this is not relaxed. The recent rise in Treasury yields could attract buying from “real money” domestic investors and foreigners, implying an increase in non-monetary financing of the deficit.

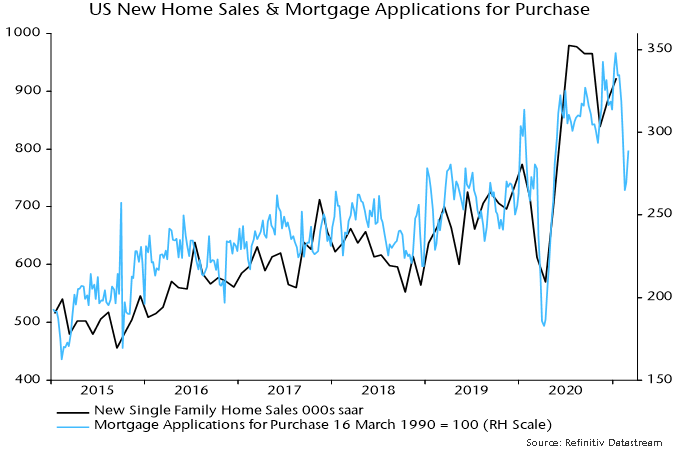
Higher yields could also dampen money growth via their impact on private sector credit demand. The jump in mortgage rates has already been reflected in a fall in mortgage applications for house purchase – chart 1. Growth of commercial banks’ lending book will continue to be dragged down by forgiveness of Payment Protection Program (PPP) loans: of the $521 bn of advances in 2020, only $169 bn had been forgiven as of 4 March.

Chart 1

The upshot is that broad money reacceleration is likely but not certain and there is no alternative to monitoring the incoming monetary data to judge whether another inflationary boost is in the pipeline.

It is, therefore, unfortunate that the Fed recently ended publication of weekly monetary data while pushing back the release of monthly figures to the fourth Tuesday of each month.

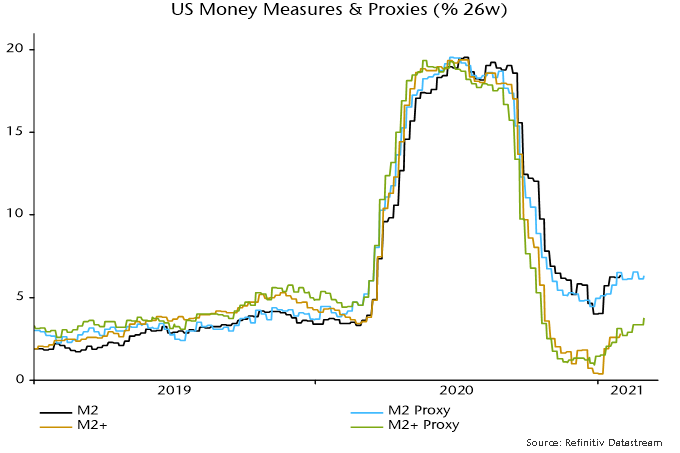
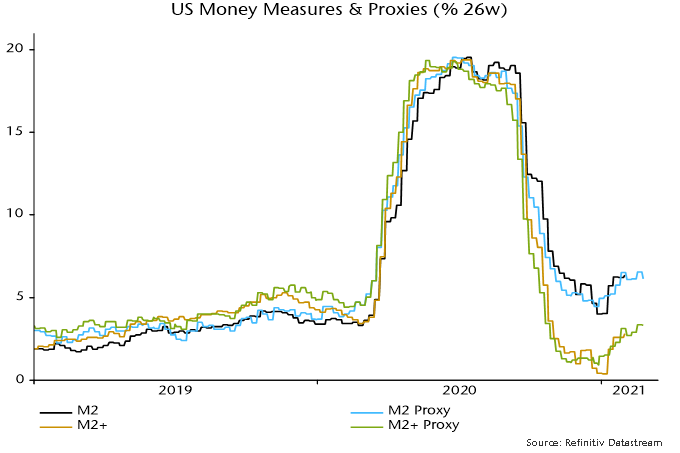
Timely monitoring of monetary trends, however, is still possible using alternative sources of weekly data for currency in circulation, commercial bank deposits and money funds. Chart 2 shows 26-week growth rates (not annualised) of broad money* and M2 up to the final week of Fed data (ending 1 February) along with growth of proxy measures calculated from the alternative sources. Broad money growth remains modest but has firmed since year-end ahead of the expected fiscal package boost. The extent of any further pick-up will be key for assessing medium-term inflation danger.

Chart 2

*”Broad money” refers to “M2+”, calculated as M2 plus large time deposits at commercial banks and institutional money funds.

In typical fashion, markets have reflected opposing sentiments – uncertainty and optimism. On the one hand, the worry associated with the pandemic and on the other, optimism fueled by a resurgence in activity and strong government support. Our portfolio management and asset allocation teams have been busy, first and foremost, protecting capital during the market decline and then shifting positioning to benefit from the recovery. As we look forward here are some areas of opportunity we see as we manage client capital through a challenging time. 

Revisiting equity exposure for a changing environment

Some investors might conclude that mega-cap stocks in Canada and US are the only place to be. Companies like Shopify, Facebook, Amazon, Microsoft, Apple and Google had very strong returns and our portfolios benefited from owning them. However, the recovery in stocks has broadened beyond these names. For example, in late 2020 we saw a resurgence in companies that were hurt most from lockdowns. With new vaccines these companies got a new lease on life. Throughout the year our teams took profits by selling some of the mega-cap stocks and buying companies likely to benefit from a post-vaccine world. This includes buying leaders in the travel and leisure industry. This may be hard to imagine at this point of COVID fatigue, but remember markets are always looking forward.

Late last year investors also began to favour areas that are more cyclical like value stocks, small-cap and emerging markets. These areas of the market were laggards earlier last year and have now risen above the pack. We were positioned for this shift in leadership by having a strategic allocation to value stocks and tactically buying small-cap and emerging earlier in the year. Today we are overweight equities in client portfolios with a bias to global small-cap companies. We believe we will benefit from a strong earnings recovery as more businesses reopen and stimulus remains a strong tailwind. We have also continued to increase our weight in emerging markets companies and recently launched a frontier equities strategy. As we look longer-term we believe these asset classes will be important sources of return in portfolios. 

Bond investing in the wake of a pandemic

Our positioning in bond portfolios also reflects that the worst appears to be over. Yet we are not in the clear and safety is important in a bond portfolio. The challenge, however, is that the tradeoff for safety is low yields. Current yields remain lower than they were before the pandemic and central banks are inclined to keep them low. Our bond portfolios are positioned to improve yield by investing in high quality corporate and provincial bonds. We also believe that government stimulus will result in rising inflation expectations. This has led us to own real return bonds which will benefit from this trend. Finally, we have positioned the portfolio to benefit if the recovery stalls and bond yields fall. This is a prudent offset to other positioning and helps protect capital should the economic recovery falter. 

As we look to strike a balance between safety and income, we have also been adding to high yield bonds that carry a much higher yield. The focus here is on strong credit research to avoid companies that may not be resilient if economic recovery stalls. 

Fertile ground for alternatives

Private market alternatives have been an attractive addition to portfolios for some time. These assets can be generally characterized as having strong returns, coming mostly from income and relatively low volatility. This combined with added diversification makes private market alternatives appealing on a long-term basis. The tradeoff for accessing these characteristics is reduced liquidity and the time it takes to deploy capital into new assets. Recently, however, we have been able to put more client assets to work in these strategies. Within our infrastructure portfolio we completed the purchase of four operating wind assets and one construction-stage solar project in the US. These assets have strong expected returns and benefit from fixed price contracts for the energy produced. Not to mention this now brings our renewable power generation to 1.4 gigawatts, enough energy to power more than 320,000 homes.  

Within our direct real estate portfolio we have completed our first purchase in the residential apartment sector. Historically residential has generated more stable returns and income compared to other property types like retail and office. We expect our allocation to this property type will increase.

Our positioning

The bumpy road to long-term performance

Building wealth for the future requires discipline, thorough research and a process for managing risk. The opportunities that are most attractive today are assets that can benefit the most from the economic recovery. Yet we also need to recognize that the road to recovery from here will be bumpier than what we’ve experienced so far. To manage this risk we continue to be broadly diversified while tactically tilting the portfolio to the areas of the market with the greatest opportunity. 

This post is for information only and is not intended as investment advice. The views expressed are those of the author at the time of publication and are subject to change at any time.