Every now and then, we remind ourselves why we enjoy our work. To us, global small cap is a wonderful asset class that offers the widest array of companies in terms of style, valuations, and growth profiles. This helps us develop a philosophy and process that fits our investment background, without having to take unnecessary market-related risks and having too much of a narrowed spectrum of investment candidates. Moreover, this investment universe is comprised of many companies that are strongly impacted by secular themes, especially the technology-driven ones.

Technologically driven secular themes usually appear in our universe following a start-up phase where venture capital, serial entrepreneurs, and bankers play god with other people’s money, through conceptual and research-driven business plans. Following that phase, we start seeing the themes when more established companies decide the technology is mature enough to turn into real products.

Artificial Intelligence (AI) is a prime example. The market is already big and getting bigger. If we were to list all of the companies in our portfolio impacted by utilizing AI, the list would be long. In healthcare alone, the AI market is expected to reach USD 58.6 billion by 2028.[1]

Let’s dig deeper and look at a field that will greatly benefit – radiology. Radiology features a high degree of specialty mixed with high throughput that fits AI’s problem-solving capabilities. As a key part of medical practice and research, radiology interprets most human biological ailments. Its complexity has skyrocketed due to biomarkers that are now available to radiologists, especially in the field of oncology.

Radiology and machine learning will prosper in many markets, such as prostate cancer diagnostics, thanks to greater precision in comparison to the conventional PSA test. New AI-assisted markers are set to help radiologists read CT scans for colon cancer. In addition, AI is expected to increase radiology productivity (volume of readouts performed per hour) and the amount of new products (volumes from new diagnostic initiatives).

Speaking of new products, radiology and AI will be a key part of the new Alzheimer treatment paradigm, representing an estimated USD 10 billion market in 2026. The recently approved Alzheimer’s drug Aduhelm, from biotech company Biogen, requires a specialized CT confirmation scan, as well as monthly scans during treatment. As a market, radiology has an above-average growth rate of 5.2%, with a substantial market size of USD 20 billion.[2]

Raffles Medical (RFMD: SP)

Raffles Medical (RMG) is a private healthcare provider operating in 14 cities across Asia, including Singapore, China, Japan, Vietnam, and Cambodia. In China, RMG is present in eight cities.

Hospitals are core users of radiology in the majority of departments. Radiology productivity is linked to efficiency with most procedures, especially in the private sector where RMG operates. With EBITDA margins already at 21% versus mid-teens for its hospital peers, RMG remains a first-mover when it comes to technology driven productivity. Radiology AI will have an important impact on the sustained growth in profitability going forward. RMG operates two hospitals, the 380-bed Raffles Hospital Singapore, which opened in 2003, and the 700-bed Raffles Hospital Chongqing, which opened in 2020. RMG also just opened its third hospital, the 400-bed Raffles Hospital Shanghai. According to management, the new hospitals in Shanghai and Chongqing are starting with 100-150 operational beds.

In Singapore, RMG operates the Raffles Specialist Centre, adjoined to Raffles Hospital, and it has a total bed capacity of 380. Centers of excellence in the Chongqing hospital include gastrointestinal surgery, obstetrics & gynecology, pediatrics, cardiovascular surgery, neuroscience, and oncology, which all feature significant radiology practices.

Our next holding corroborates the kind of AI productivity gains that Raffles could be able to obtain in the near future.

Radnet (RDNT: US)

RadNet is the largest provider of outpatient imaging services in the United States, with 346 centers nationwide.

The company has an AI subsidiary called DeepHealth, which focuses on developing machine-learning applications for the radiology industry. RadNet recently announced the FDA’s approval of its AI mammography triage software. This software acts as a screening tool, enabling radiologists to more effectively manage their mammography cases using AI. DeepHealth’s powerful new AI technology automatically identifies suspicious screening exam results that may need priority attention, allowing radiologists to optimize their workflow for efficiency and effectiveness.

According to the company, RadNet’s first AI approval should translate to a 25% gain in productivity covering its two million annual mammography scans. This should therefore enable the company to expand its capacity and grow without having to hire additional staff.


[1] Market Insight Reports, July 28, 2021

[2] Grandview Research, December 2020

Wind turbines in Navarre (Spain) Renewable energy concept.

Investing in private market infrastructure assets is an effective means of generating stable cash flow and long-term capital growth. Historically, this asset class has only been available to institutional investors with deep pockets. However, in recent years investment managers have started to provide their high-net-worth clients with opportunities to invest in this asset class.

In this article, we provide an overview of infrastructure investing, how we approach it, and the opportunity for investors. For information on other alternative asset classes, please read our Portfolio Guide – Beyond Stocks and Bonds.

What is infrastructure investing?

Infrastructure investing refers to making investments in physical, or “real”, assets that provide an essential product or service that is critical to society. Infrastructure assets are varied – from roads, rail, schools, and hospitals to power generation, energy transmission and distribution, and digital infrastructure. 

Typically, attractive assets share a number of key characteristics including long lives, low competition and high barriers to entry. When combined with predictable revenue streams – often from contracts with government counterparties or counterparties with high credit ratings – this makes infrastructure investing a source of portfolio stability and return.  

Understanding the opportunity for investors

While institutional investors have long embraced infrastructure investing, it is a less familiar option for high-net-worth investors, given the complexity and high cost associated with access to the asset class. Three key benefits include:

  • Uncorrelated: Infrastructure cash flow returns have a low correlation to other asset classes. It means they do not typically rise or fall in lockstep with liquid asset classes like stocks or bonds or private asset classes like real estate, private debt or private equity.
  • Resilient: Infrastructure returns are relatively resilient to economic turbulence. Even in recessionary economic environments, infrastructure returns have been relatively stable, given their essential, and often contracted or regulated, nature.
  • Long term: Infrastructure assets typically provide steady returns over a long time. Assets usually benefit from long contract lengths of more than 20 years and the assets themselves often have even longer useful lifespans – some hydroelectric assets have reached upwards of 100 years. 

These benefits make infrastructure an attractive asset class. Incorporating infrastructure into a broader portfolio can provide important diversification benefits and may also deliver increased average returns while reducing risk. 

Another characteristic of investing in infrastructure and other private asset classes is restricted liquidity. This is because the holding period of infrastructure assets reflects the long-term nature of the investments. For investors that do not require their capital in the short term, infrastructure can be a relatively safe and low-risk way to generate income and long-term growth.  

Our approach to infrastructure investments

At CC&L Private Capital, our infrastructure investments are primarily in Canada, the US, and Chile. We expect to add infrastructure assets in other geographies over time in a measured and disciplined way. 

Our portfolio is focused mainly on small- and medium-sized traditional infrastructure projects (e.g., roads, rail, hospitals) and energy infrastructure projects (i.e., hydro, wind, and solar).

Choosing the right investment manager

We strongly believe in the benefits of infrastructure investing. That is why we invest a significant amount of our own capital in our portfolio, as with all our private market investments. It shows that we are committed to our portfolio’s performance, as we benefit alongside our clients. 

When evaluating potential investment managers, whether they have  »skin in the game » is important, particularly for alternative asset classes. Other criteria investors should consider include the stability of the investment manager’s team, the manager’s proven ability to generate returns, the direct nature of the investments and the quality and diversity of the infrastructure portfolios.

To learn more about how to choose the right investment manager for your goals, please read our Portfolio Guide – How to future-proof your investment portfolio.

Find out more

If you would like to find out more about our approach to infrastructure investing or learn how we can help you grow your investment returns, please contact us.

This post is for information only and is not intended as investment advice. The views expressed are those of the author at the time of publication and are subject to change at any time.

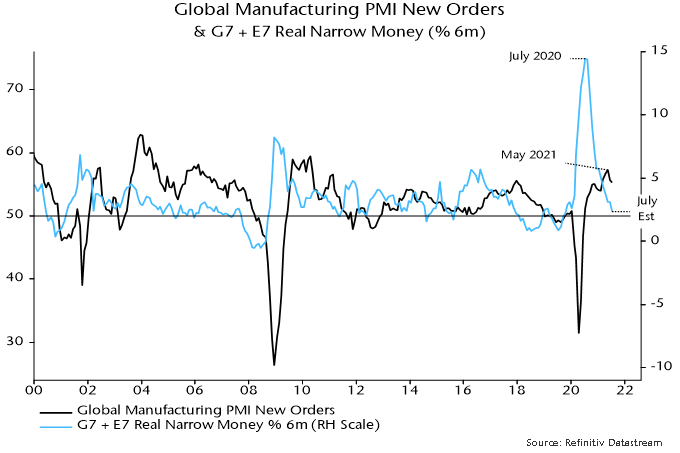
The assessment here remains that the global manufacturing PMI new orders index peaked in May and will fall through H2 2021, reflecting a decline in global six-month real narrow money growth from July 2020 through May. Real money growth, however, stabilised between May and June, raising the possibility that a turning point was at hand. A recovery in real money trends during Q3 would be a positive signal for economic prospects for H1 2022 and could support a second leg of the reflation trade.

Incoming monetary news for July is unfavourable for this scenario. Global six-month real narrow money growth is estimated to have fallen further last month to its lowest since October 2019, based on monetary data covering 70% of the G7 plus E7 aggregate monitored here – see chart 1.

Chart 1

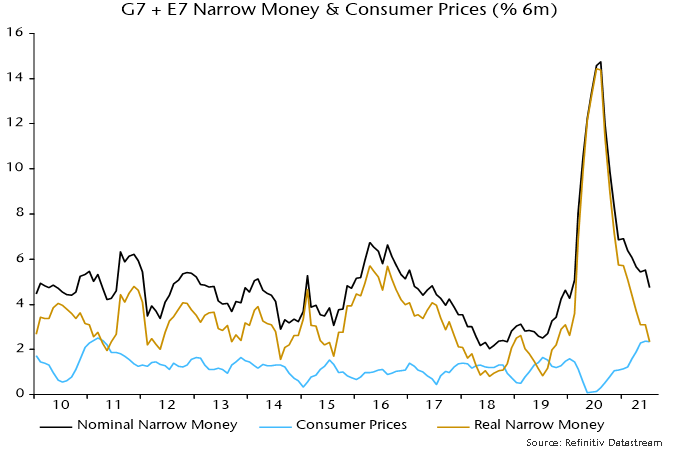
A pick-up in six-month consumer price inflation contributed to the fall in real narrow money growth into May / June. Price momentum stabilised in July but there was a further decline in nominal money expansion – chart 2.

Chart 2

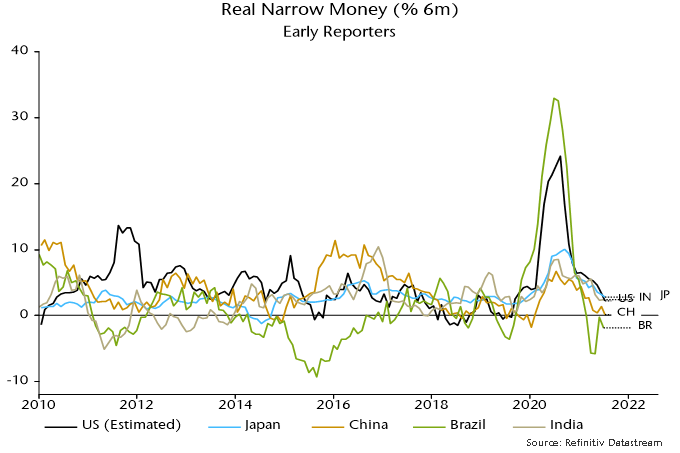
Six-month real narrow money growth is estimated to have fallen in the US, China, Japan and Brazil, with India stable – chart 3. (The US July money number is estimated from weekly data on currency in circulation and commercial bank deposits.)

Chart 3

A recovery in the global measure remains plausible in August / September. Recent commodity price stabilisation suggests a decline in six-month inflation, while Chinese money growth may pick up in lagged response to policy easing.

Global six-month real narrow money growth has led turning points in manufacturing PMI new orders by 6-7 months on average historically. The further fall in real money growth in July, therefore, suggests that PMI weakness will extend into early 2022.

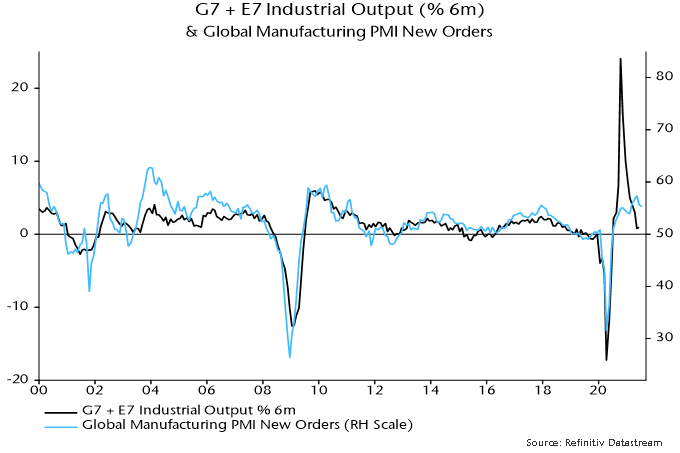
The PMI new orders index is a good indicator of underlying industrial momentum but output was held back by supply issues during H1, disrupting  the normal relationship – chart 4. Output momentum could rebound temporarily in Q3 as supply constraints ease even as the PMI moderates.

Chart 4

This possibility complicates market analysis. The performance of “traditional” cyclical equity market sectors (i.e. excluding IT and communication services) relative to defensive sectors has correlated better with PMI new orders than industrial output, suggesting that they will lag if the PMI slides – chart 5.

Chart 5

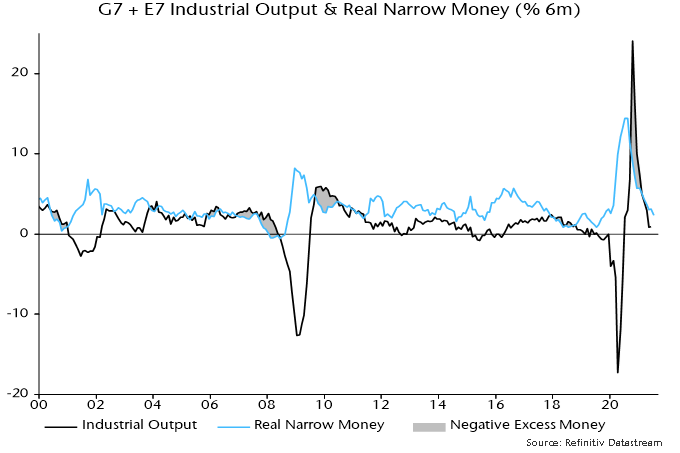
A near-term rebound in output momentum, however, could be relevant for assessing the monetary backdrop for markets. Global six-month industrial output growth fell back below real money growth in April – chart 6. The return to a positive real money / output growth gap may explain continued strength in equity market indices despite signs of economic cooling.

Chart 6

A negative cross-over, however, is possible if there is a large output catch-up effect and real money growth remains weak.

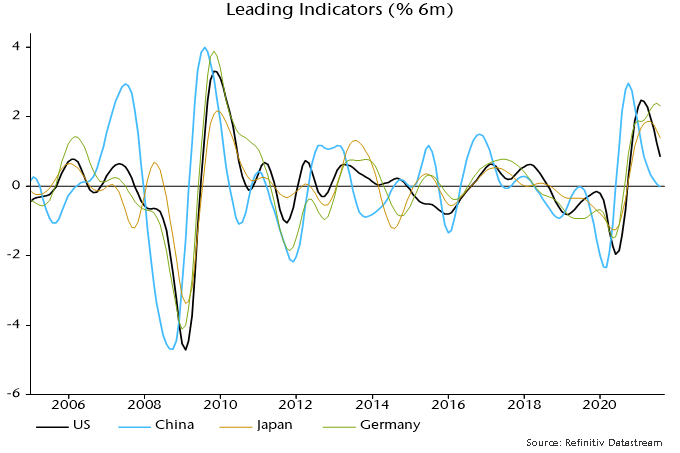
The monetary signal of an economic slowdown is starting to be confirmed by non-monetary leading indicators. Chart 7 shows six-month rates of change of composite indices based on the OECD’s methodology but calculated independently. The suggestion is that the loss of economic momentum now clearly visible in China will be mirrored in the US and the rest of the G7 in H2 2021.

Chart 7

The economic / market view here remains cautious based on 1) an expected slowdown in global industrial momentum through H2 (already apparent in Chinese data) and 2) recent less favourable “excess” money conditions.

Global six-month real narrow money growth, however, may have bottomed in May / June. A Q3 rebound would signal a stronger economy in H1 2022. An associated improvement in excess money could reenergise the reflation trade in late 2021.

The issue can be framed in cycle terms: does the recent top in the global manufacturing PMI new orders index mark the peak of the stockbuilding cycle (implying a shortened cycle) or will the peak be delayed until H1 2022?

Possible drivers of a real money growth rebound include Chinese policy easing, a slowdown in global consumer price momentum and a pick-up in US / Eurozone bank loan expansion.

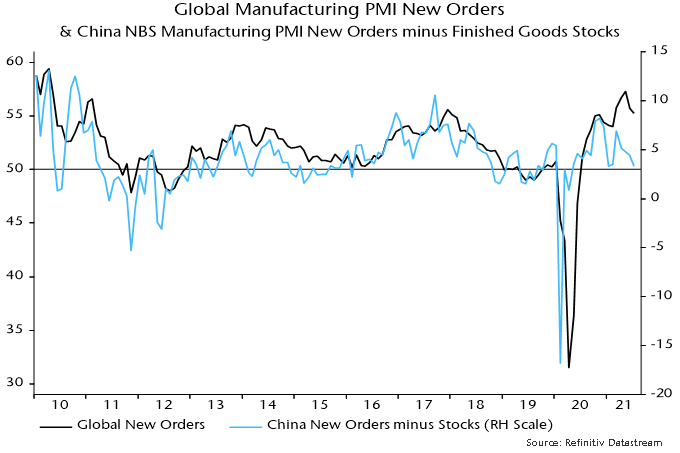
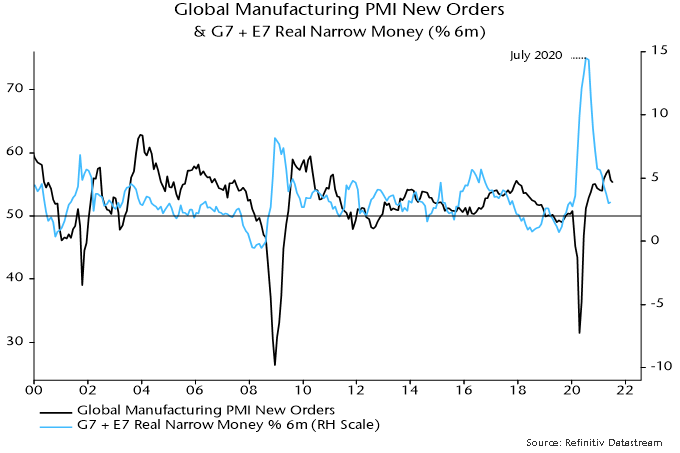
The H2 industrial slowdown view remains on track. The global manufacturing PMI new orders index fell further in July, confirming May as a top. Chinese orders were notably weak and have led the global index since the GFC – see chart 1.

Chart 1

Global six-month real narrow money growth fell steadily between July 2020 and May but a stabilisation in June has been confirmed by additional monetary data released over the last week – chart 2.

Chart 2

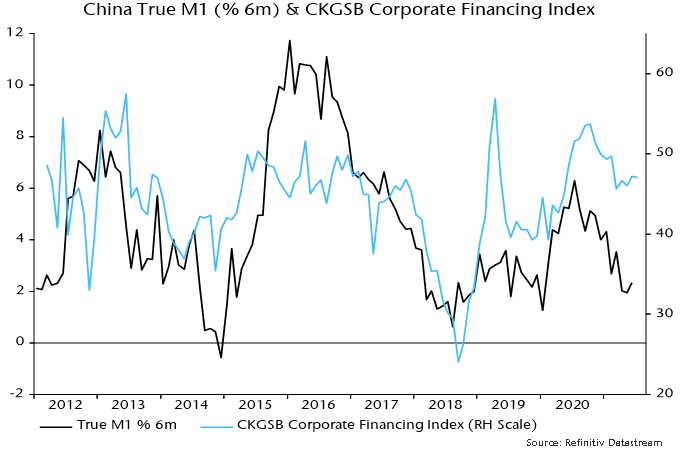
Will PBoC policy easing drive a recovery in Chinese / global money growth? The hope here was that the 15 July cut in reserve requirements would be reflected in an early further fall in money market interest rates and easier credit conditions. Three-month SHIBOR, however, has moved sideways while corporate credit availability is little changed, judging from the July Cheung Kong Graduate School of Business survey – chart 3. July money data, therefore, could show limited improvement.

Chart 3

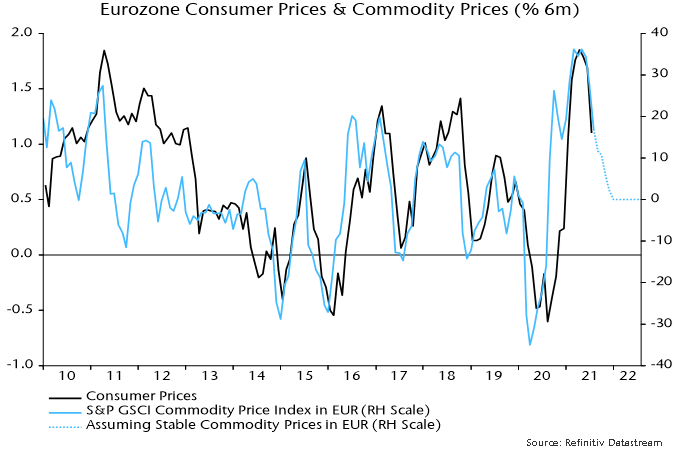
Global six-month real money growth should receive support from a slowdown in consumer price momentum as commodity price and bottleneck effects fade. Eurozone six-month CPI inflation eased on schedule in July, with further moderation suggested and the move lower likely to be mirrored in other countries (Tokyo July numbers also showed a slowdown) – chart 4.

Chart 4

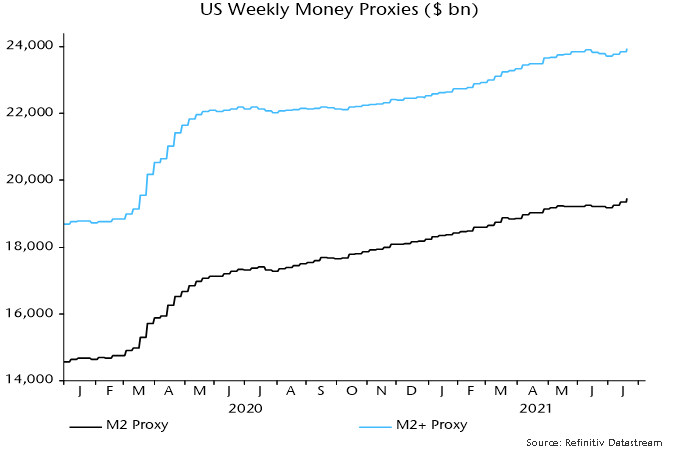
US monetary prospects are foggy. Disbursement of stimulus payments boosted nominal money growth over March-May but there was a sharp slowdown in June. Weekly data indicate a reacceleration in July as the Treasury ran down its cash balance at the Fed to comply with debt ceiling legislation – chart 5. This effect, however, will be temporary and an improving fiscal position suggests a reduced contribution from monetary financing during H2 and into 2022.

Chart 5

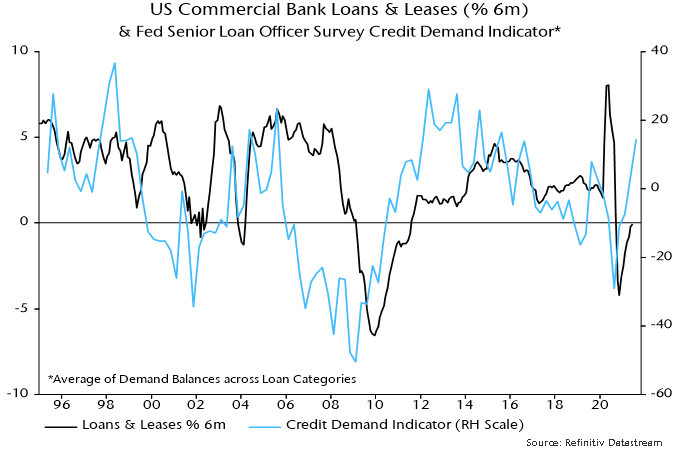
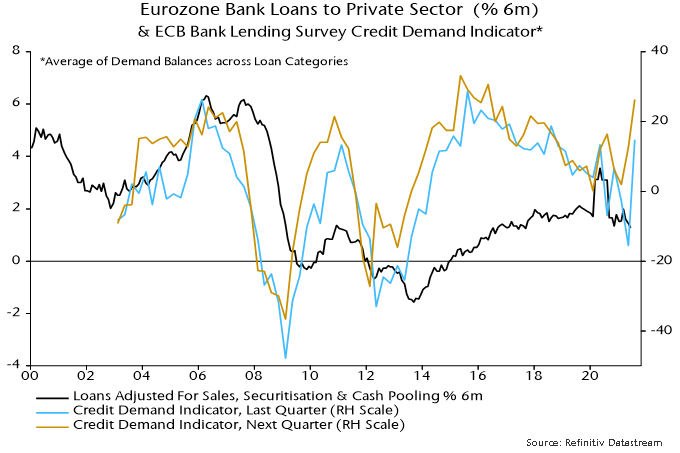
Stable or higher US money growth, therefore, may require a pick-up in bank loan expansion. The Fed’s July senior loan officer survey, released yesterday, is hopeful, showing a further improvement in demand balances across most loan categories (not residential mortgages) – chart 6. The ECB’s July lending survey gave a similar message – chart 7. The survey indicators, however, are directional and the magnitude of a likely loan growth pick-up is uncertain. Actual lending data remained soft through June.

Chart 6

Chart 7

Failure of global real money growth to recover in Q3 – and especially a further slowdown – would suggest that the stockbuilding cycle is already at or close to a peak. The cycle bottomed in Q2 2020 and – based on its average historical length of 3.33 years – might be expected to reach another low in H2 2023, in turn implying a peak no earlier than H1 2022. As previously discussed, however, the current upswing could be short to compensate for a long (4.25 years) prior cycle.

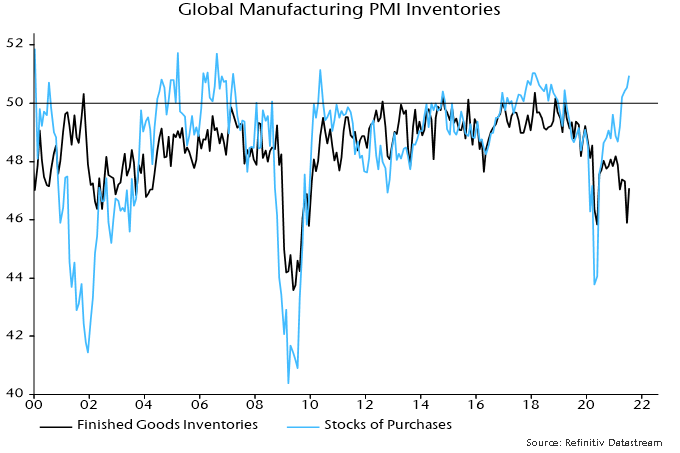
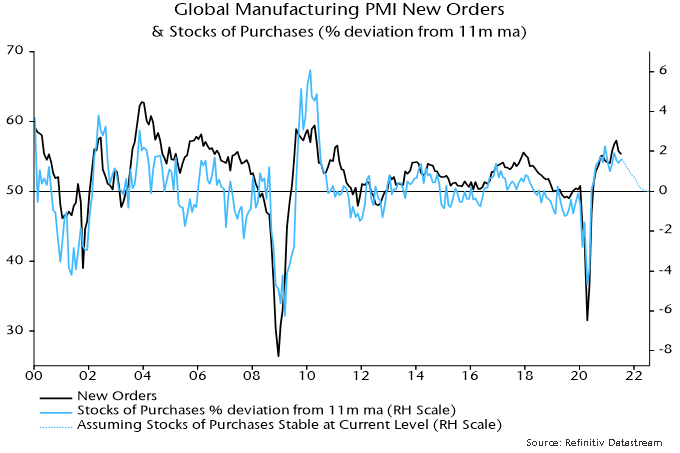
Proponents of the consensus view that replenishment of stocks will underpin solid industrial growth in H2 cite the still-low level of the global manufacturing PMI finished goods inventories index – chart 8. Research conducted here, however, indicates that the stocks of purchases index (i.e. raw materials / intermediate goods) is a better gauge of the stockbuilding cycle and tends to lead the finished goods index. The former index is already at a level consistent with a cycle top and the rate of change relationship with the new orders index is another reason for expecting orders to weaken significantly during H2 – chart 9.

Chart 8

Chart 9

Gestion de placements Connor, Clark & Lunn (Gestion de placements CC&L) est heureuse d’annoncer qu’elle appuie les recommandations du Groupe de travail sur l’information financière relative aux changements climatiques (GIFCC). En tant que gestionnaire des actifs que lui confient ses clients, Gestion de placements CC&L reconnaît sa responsabilité et son rôle de chef de file dans la promotion de l’intégrité des marchés financiers. La société encourage activement les sociétés détenues à intégrer les recommandations du GIFCC dans leurs déclarations futures.

« Gestion de placements CC&L s’engage à informer ses clients et les autres parties intéressées de son approche dans le cadre de ses démarches visant à intégrer ces recommandations à ses propres activités au fil du temps », a déclaré Martin Gerber, président et chef des placements chez Gestion de placements CC&L. « Nous disposons d’une solide politique d’investissement responsable (IR) qui prend en compte notre approche globale pour l’intégration des enjeux environnementaux, sociaux et de gouvernance (ESG) dans nos processus de placement. Notre approche repose essentiellement sur notre conviction selon laquelle nos portefeuilles et nos activités d’engagement doivent refléter le fait que l’économie mondiale en est à opérer une transition à grande échelle vers une réduction des émissions de carbone. »

En appuyant les recommandations du GIFCC, Gestion de placements CC&L s’engage à entreprendre certaines activités et à rendre compte de celles-ci selon le cadre du Groupe de travail recommandé. Les quatre piliers de ce cadre sont les suivants : gouvernance, stratégie, gestion du risque, et paramètres et cibles.

Gestion de placements CC&L estime que les équipes de direction des sociétés dans lesquelles elle investit ont le devoir d’être transparentes dans leurs déclarations et de rendre des comptes à toutes les parties prenantes. De plus, l’amélioration des divulgations permettra aux équipes de placement de Gestion de placements CC&L de réfléchir aux risques inhérents aux sociétés dont la transition est lente et de découvrir des occasions liées à l’adoption anticipée de nouvelles technologies et à l’innovation. Enfin, la société estime avoir un devoir de transparence; aussi son rapport conforme aux recommandations du GIFCC sera-t-il mis à la disposition des parties prenantes prochainement.

À propos de Gestion de placements Connor, Clark & Lunn Ltée

Connor, Clark & Lunn Investment Management Ltd. (CC&L Investment Management) is one of the largest Gestion de placements Connor, Clark & Lunn Ltée (Gestion de placements CC&L) est l’une des plus importantes sociétés de gestion de placements indépendantes au Canada (elle appartient à ses associés) et gère un actif de 55,9 milliards de dollars. Fondée en 1982, elle propose une gamme diversifiée de solutions de placements traditionnels (actions, titres à revenu fixe et placements équilibrés) et non traditionnels (stratégies neutres au marché, à alpha portable et à rendement absolu). Gestion de placements CC&L est membre du Groupe financier Connor, Clark & Lunn Ltée.

Personne-ressource

Lori Satov
Gestionnaire de portefeuille, Solutions clients
Gestion de placements Connor, Clark & Lunn
(604) 643-5819
[email protected]

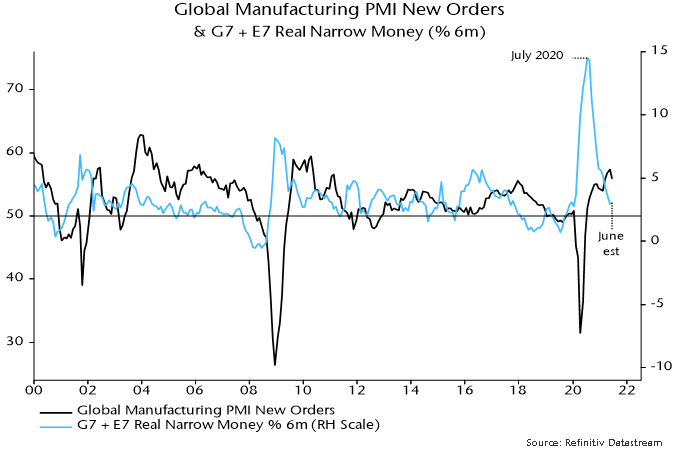
Global six-month real narrow money growth appears to have moved sideways in June and could be bottoming after a 10-month slide. If confirmed, and allowing for the usual lead time, this would suggest a stabilisation of industrial momentum in early 2022 following a H2 2021 slowdown.

The June real narrow money growth estimate is based on monetary data covering 70% of the G7 plus E7 aggregate tracked here and near-complete inflation numbers. The prior fall in real money growth is expected to be reflected in “surprising” weakness in global PMI manufacturing new orders and other coincident indicators of industrial momentum during H2 2021 – see chart 1.

Chart 1

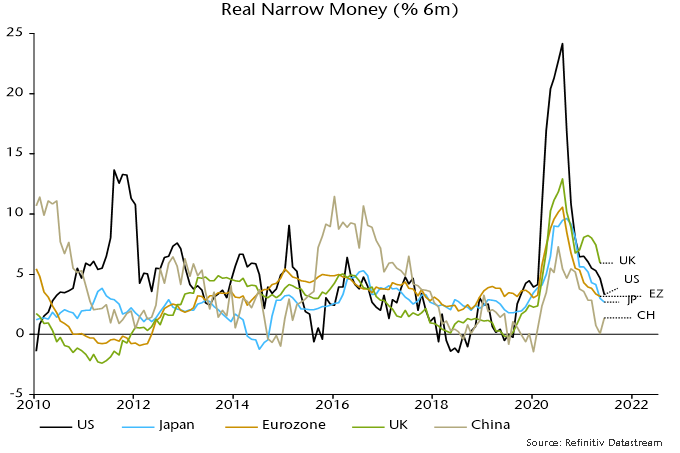
Global stabilisation conceals a June recovery in Chinese six-month real narrow money growth offset by further slowdowns in the US and Japan, with European data yet to be released – chart 2.

Chart 2

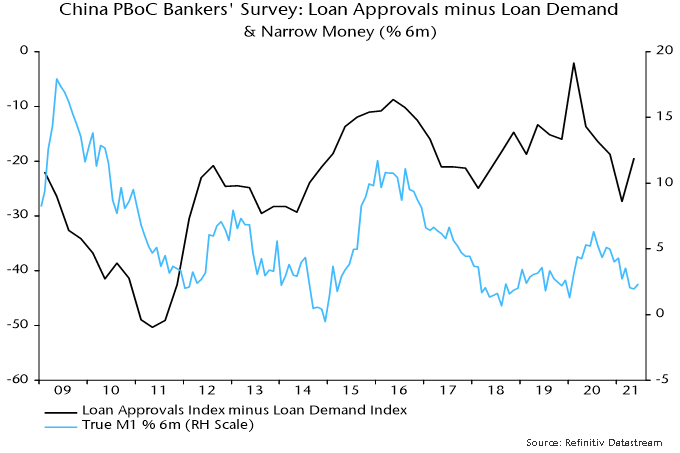
The recent cut in reserve requirements is judged here to confirm a trend shift in Chinese monetary policy, probably heralding a sustained rebound in money growth. Another indication of a policy turn is a rise in the differential between the loan approvals and loan demand indices in the PBoC Q2 bankers’ survey, suggesting that banks have been instructed to loosen credit – chart 3.

Chart 3

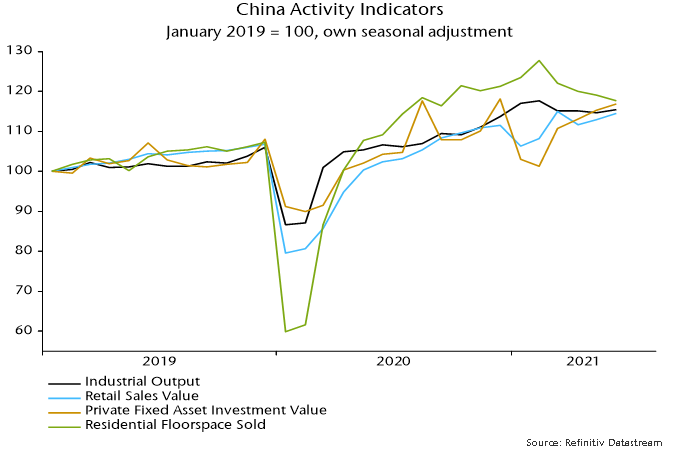
Street claims that last week’s Chinese activity data were solid, implying no need to adjust policy settings, are puzzling. GDP grew by only 3.4% annualised between Q4 and Q2. Monthly indicators are stagnant in real seasonally adjusted level terms – chart 4.

Chart 4

The view here is that the economy faced a “hard landing” without a policy change but the authorities have recognised the risk and will act to avert it.

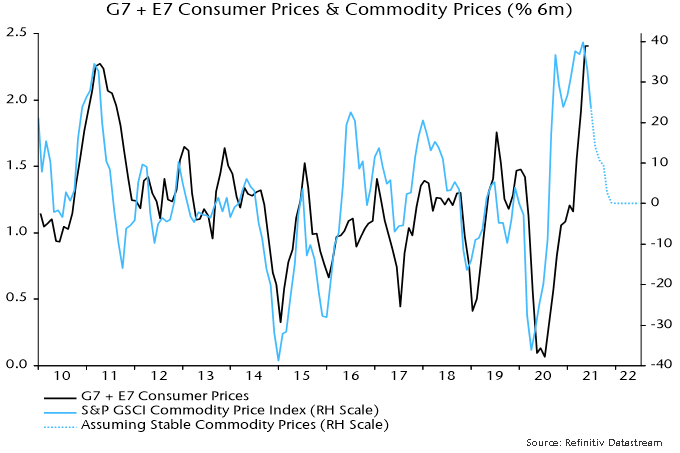
Support to global real money growth from Chinese easing should be supplemented by a slowdown in global six-month CPI inflation in H2, assuming stable commodity prices – chart 5. Commodity prices could weaken as industrial activity decelerates.

Chart 5

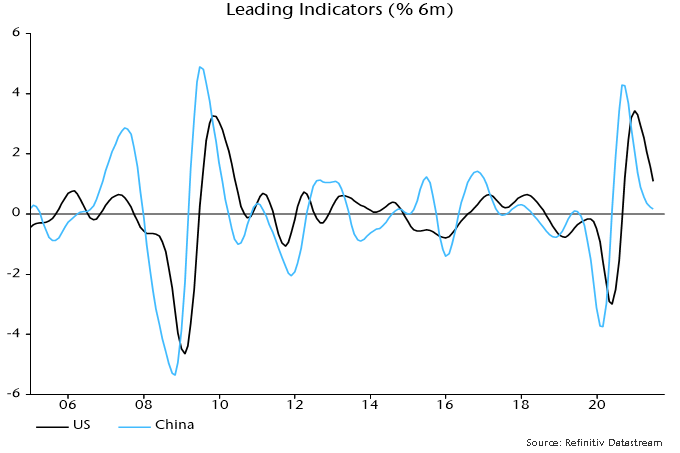
China continues to lead US / global economic momentum. The six-month rate of change of the OECD’s US leading indicator peaked four months after that of a Chinese indicator – chart 6*. This fits with a four-month interval between peaks in 10-year government bond yields – November in China, March in the US.

Chart 6

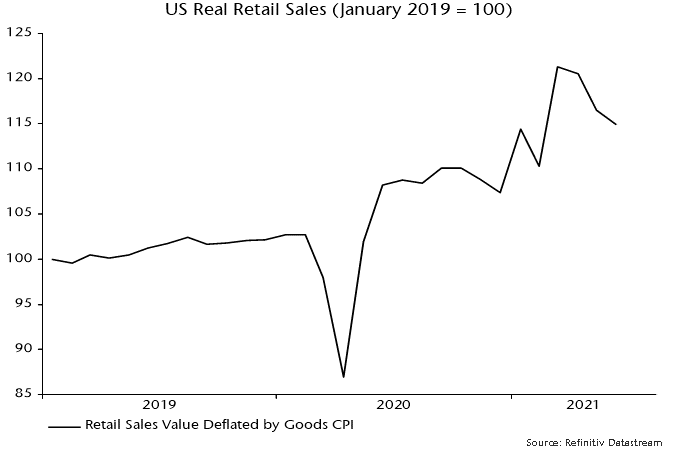
Street descriptions of US June retail sales as « robust » are also questionable. With prices surging, sales fell for a third month in real terms, consisent with a fading boost from March / April stimulus payments – chart 7.

Chart 7

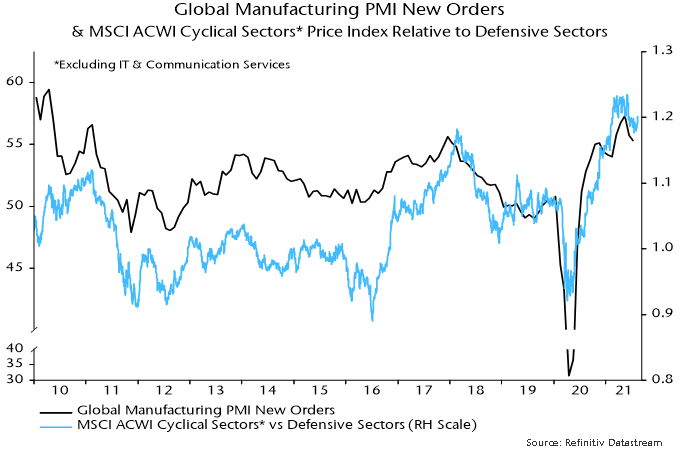
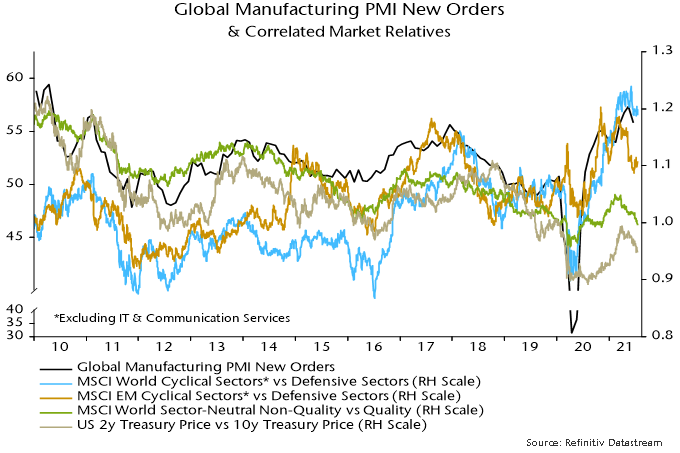
Markets have already partially discounted a H2 economic slowdown, with quality stocks outperforming and bullish flattening of yield curves. Non-tech cyclical sectors of developed equity markets have so far held up against defensive sectors and could be the next shoe to drop – chart 8.

Chart 8

*The indicators shown use the OECD’s methodology but are calculated independently.

This strategy and any associated investments are only available to professional investors and eligible counterparties, as defined in the rules of the UK Financial Conduct Authority. This communication is not being made to, and should not be relied upon by, persons who are retail clients for FCA regulatory purposes. Vergent Asset Management LLP is not authorised by the FCA to deal with retail clients.

The strategy continues to be rewarded for the thesis we’ve built around technology, payments, and financial inclusion in our markets. The starting point for us in that process was the mobile money opportunity in East Africa which continues to be best exemplified by Kenya’s Safaricom’s M-Pesa. Over time, we built a deeper understanding of the payments value chain which helped us identify infrastructure players like Morocco’s Hightech Payment Systems which was an early investment in the life of the strategy. We also broadened the geographical scope of the thesis by expanding our core mobile money thesis towards West Africa into Ghana with MTN’s exciting Momo business which is now starting to get the attention it deserves from the market. We also benefited from the deepening opportunity set in the sector with transformational companies like Kazakhstan’s Kaspi.Kz coming to market last year. Our financial inclusion theme extended to microfinance companies like Bank BTPN Syariah in Indonesia which provides micro loans to nearly four million women entrepreneurs in rural Indonesia. BTPN Syariah has a fantastic opportunity to go from an offline centric credit disbursement and collection model into an Omni-channel offering that will help scale the business whilst improving the level of service they provide customers. Our initial thesis has evolved and strengthened since we started investing in the sector; financial inclusion and digital transformation has become a regulatory priority and the pandemic has only helped accelerate adoption and usage among consumers. Moreover, the companies we’ve invested in are constantly evolving with Kaspi.Kz continuing to add new services to its super app that counts over half of Kazakhstan’s population as active users and M-Pesa accelerating its transformation from a peer-to-peer USSD based service into a full-fledged lifestyle and financial services platform servicing ~25 million Kenyan consumers and ~300k merchants. Another factor that we must acknowledge has changed over the last two years is the valuations have re-rated for the broader sector both in the public and private markets. What reassures us on that front are four key points:

  1. The aforementioned companies and others we own in the sector are all profitable
  2. Their balance sheets are unlevered and in most cases net cash
  3. They trade at reasonable multiples relative to the sector in developed markets (albeit at a premium to the rest of the portfolio) and private markets. In fact, no one company we’ve invested in currently trades on a P/E ratio that is in excess of 30x 2022 earnings. Note our emphasis on price to earnings ratio means all of our companies are bottom line profitable
  4. The growth profile and optionality embedded in these business models means that the multiples we see on near term earnings will burn off fairly quickly in the next five years

Away from payments and technology, the strategy also experienced strong returns in the period from our retail portfolio in Morocco and the Philippines. In Morocco, the vaccination rollout program has been very successful with over 18m doses administered as of the date of writing (Morocco’s total population is ~36 million of which 27% is under the age of 15). This has bolstered the outlook for sales at Label Vie, the operator of the largest supermarket chain in the country under license from France’s Carrefour. Label Vie also operates the largest cash & carry format stores in the country under the Atacadao brand, a Brazilian concept brand also owned by Carrefour which caters to professional buyers and households. The reason for our optimism on the company’s short term prospects comes from the potential return of the hospitality channel as Morocco reopens to European tourism. Prior to the pandemic, a quarter of Atacadao’s sales came from the hospitality channel and we expect that some of that will start to show in sales over the next few quarters. Longer term, our bullish thesis on Label Vie is underpinned by the broader modern retail sector’s development and management team’s aggressive expansion strategy which is focused on scaling several formats including supermarkets (~700sqm), minimarkets (~200sqm), and Atacadao. It is worth nothing that Label Vie’s management is also investing in building an online presence in Morocco through “Bringo”, a Romanian online grocery concept that is also owned by Carrefour. Morocco is a very nascent market for online (~1% of retail sales) and according to our channel checks has not experienced the same step change in online shopping habits that other markets have experienced since the onset of the pandemic. This gives Label Vie an opportunity to build out its online channel thoughtfully by adapting its offerings and fulfillment strategy to local tastes and dynamics. We were encouraged by management’s receptiveness to our recommendations in this area and expect to continue to engage with them as they build out their online model. In the Philippines, we are seeing early signs of a recovery as vaccinations begin to pick up pace. Encouraged by that progress, we made an investment in a leading home improvement retailer that we believe will benefit tremendously from the return in construction spending and home renovation activity. It is worth nothing that unlike in other markets in the world, construction activity has been largely suppressed in the Philippines since the pandemic started in March of last year as a result of strict social distancing measures at the local and federal level.

In our last letter, we made a case for investors to think differently about how they approach emerging markets. We argued that many of the largest constituent countries of emerging market indices have reached levels of economic development, regulatory cycle, and market efficiency that makes them comparable to developed markets. We continue to advocate that the true emerging market opportunity today lies in the next generation of emerging markets like Egypt, Indonesia, Kenya, Pakistan, and Vietnam. Today, those market offer up a unique combination of a large, young and rapidly urbanizing consumer base that is increasingly connected but still not served in the same way their counterparts in more developed countries are. Our job is to find public companies that are able to fill that gap by offering services directly to those customers (B2C) or by enabling other businesses to offer those services to customers (B2B2C). That gap represents a substantial economic and social profit opportunity for well run businesses in which the strategy is generously invested.

Vergent Asset Management LLP


DISCLOSURES

1. Unless otherwise stated, all data is at June 30, 2021 and stated in US dollars (US$). Source: Connor, Clark & Lunn Financial Group, Thomson Reuters Datastream.
2. Performance history for the Vergent Emerging Opportunities Strategy is that of the Vergent Emerging Opportunities Composite. The Composite has an inception and creation date of August 2018.
3. Net performance figures are stated after management fees, estimated performance fees, trading expenses and before operating expenses. Operating expenses include items such as custodial fees for pooled vehicles and would also include charges for valuation, audit, tax and legal expenses. Such additional operating expenses would reduce the actual returns experienced by investors. Past performance of the strategy is no guarantee of future performance; Future returns are not guaranteed and a loss of capital may occur. For illustrative purposes, performance fee of 20% on added value over the hurdle rate of 6% plus the management fee of 1.25% have been assumed. Actual management fees charged to a particular account may vary.
4. There is no benchmark for the Vergent Emerging Opportunities Strategy because it has an absolute return objective
5. Standard Deviation measures the dispersion of monthly returns since the inception of the strategy.
Benchmarks and financial indices are shown for illustrative purposes only, are not available for direct investment, are unmanaged, assume reinvestment of income, do not reflect the impact of any management or incentive fees and have limitations when used for comparison or other purposes because they may have different volatility or other material characteristics (such as number and types of instruments) than the Strategy. The Strategy’s investments are not restricted to the instruments comprising any one index and do not in all cases correspond to the investments reflected in such indices.
These materials (“Presentation”) are furnished by Vergent Asset Management (“Vergent”) on a confidential basis for informational and illustration purposes only. This Presentation is intended for the use of the recipient only and may not be reproduced or distributed to any other person, in whole or in part, without the prior written consent of Vergent. Certain information contained in this Presentation is based on information obtained from third-party sources that Vergent considers to be reliable. However, Vergent makes no representation as to, and accepts no responsibility for, the accuracy, fairness or completeness of the information contained herein. The information is as of the date indicated and reflects present intention only. This information may be subject to change at any time, and Vergent is under no obligation to provide you with any updates or amendments to this Presentation. This Presentation is not an offer to buy or sell, nor a solicitation of an offer to buy or sell any security or other financial instrument advised by Vergent. This Presentation does not contain certain material information about the strategy, including important risk disclosures. An investment in the strategy is not suitable for all investors, and before making an investment in the strategy, you should consult with your professional advisor(s) to determine whether an investment in the strategy is suitable for you in light of your investment objectives and financial situation. Vergent does not purport to be an advisor as to legal, taxation, accounting, financial or regulatory matters in any jurisdiction, and the recipient should independently evaluate and judge the matters referred to in this Presentation. Vergent Asset Management LLP is registered in England and Wales with its registered office address at 8th Floor, 1 Knightsbridge Green, London SW1X 7QA, United Kingdom (Companies House number OC418829) and is authorized and is an Exempt Reporting Adviser in the USA. It is regulated by the Financial Conduct Authority (FRN: 791909).
THIRD-PARTY DATA PROVIDERS
This report may contain information obtained from third parties including: Merrill Lynch, Pierce, Fenner & Smith Incorporated (BofAML), S&P Global Ratings, and MSCI. Source: Merrill Lynch, Pierce, Fenner & Smith Incorporated (BofAML), used with permission. BofAML permits use of the BofAML indices related data on an « As Is » basis, makes no warranties regarding same, does not guarantee the suitability, quality, accuracy, timeliness, and/or completeness of the BofAML indices or any data included in, related to, or derived therefrom, assumes no liability in connection with the use of the foregoing, and does not sponsor, endorse, or recommend CC&L Canada, or any of its products. This may contain information obtained from third parties, including ratings from credit ratings agencies such as S&P Global Ratings. Reproduction and distribution of third party content in any form is prohibited except with the prior written permission of the related third party. Third party content providers do not guarantee the accuracy, completeness, timeliness or availability of any information, including ratings, and are not responsible for any errors or omissions (negligent or otherwise), regardless of the cause, or for the results obtained from the use of such content. THIRD PARTY CONTENT PROVIDERS GIVE NO EXPRESS OR IMPLIED WARRANTIES, INCLUDING, BUT NOT LIMITED TO, ANY WARRANTIES OF MERCHANTABILITY OR FITNESS FOR A PARTICULAR PURPOSE OR USE. THIRD PARTY CONTENT PROVIDERS SHALL NOT BE LIABLE FOR ANY DIRECT, INDIRECT, INCIDENTAL, EXEMPLARY, COMPENSATORY, PUNITIVE, SPECIAL OR CONSEQUENTIAL DAMAGES, COSTS, EXPENSES, LEGAL FEES, OR LOSSES (INCLUDING LOST INCOME OR PROFITS AND OPPORTUNITY COSTS OR LOSSES CAUSED BY NEGLIGENCE) IN CONNECTION WITH ANY USE OF THEIR CONTENT, INCLUDING RATINGS. Credit ratings are statements of opinions and are not statements of fact or recommendations to purchase, hold or sell securities. They do not address the suitability of securities or the suitability of securities for investment purposes, and should not be relied on as investment advice.
Source: MSCI. The MSCI information may only be used for your internal use, may not be reproduced or re-disseminated in any form and may not be used as a basis for or a component of any financial instruments or products or indices. MSCI makes no express or implied warranties or implied warranties or representations and shall have no liability whatsoever with respect to any MSCI data obtained herein. This report is not approved, reviewed or produced by MSCI.

This strategy and any associated investments are only available to professional investors and eligible counterparties, as defined in the rules of the UK Financial Conduct Authority. This communication is not being made to, and should not be relied upon by, persons who are retail clients for FCA regulatory purposes. Vergent Asset Management LLP is not authorised by the FCA to deal with retail clients.

The strategy continues to be rewarded for the thesis we’ve built around technology, payments, and financial inclusion in our markets. The starting point for us in that process was the mobile money opportunity in East Africa which continues to be best exemplified by Kenya’s Safaricom’s M-Pesa. Over time, we built a deeper understanding of the payments value chain which helped us identify infrastructure players like Morocco’s Hightech Payment Systems which was an early investment in the life of the strategy. We also broadened the geographical scope of the thesis by expanding our core mobile money thesis towards West Africa into Ghana with MTN’s exciting Momo business which is now starting to get the attention it deserves from the market. We also benefited from the deepening opportunity set in the sector with transformational companies like Kazakhstan’s Kaspi.Kz coming to market last year. Our financial inclusion theme extended to microfinance companies like Bank BTPN Syariah in Indonesia which provides micro loans to nearly four million women entrepreneurs in rural Indonesia. BTPN Syariah has a fantastic opportunity to go from an offline centric credit disbursement and collection model into an Omni-channel offering that will help scale the business whilst improving the level of service they provide customers. Our initial thesis has evolved and strengthened since we started investing in the sector; financial inclusion and digital transformation has become a regulatory priority and the pandemic has only helped accelerate adoption and usage among consumers. Moreover, the companies we’ve invested in are constantly evolving with Kaspi.Kz continuing to add new services to its super app that counts over half of Kazakhstan’s population as active users and M-Pesa accelerating its transformation from a peer-to-peer USSD based service into a full-fledged lifestyle and financial services platform servicing ~25 million Kenyan consumers and ~300k merchants. Another factor that we must acknowledge has changed over the last two years is the valuations have re-rated for the broader sector both in the public and private markets. What reassures us on that front are four key points:

  1. The aforementioned companies and others we own in the sector are all profitable
  2. Their balance sheets are unlevered and in most cases net cash
  3. They trade at reasonable multiples relative to the sector in developed markets (albeit at a premium to the rest of the portfolio) and private markets. In fact, no one company we’ve invested in currently trades on a P/E ratio that is in excess of 30x 2022 earnings. Note our emphasis on price to earnings ratio means all of our companies are bottom line profitable
  4. The growth profile and optionality embedded in these business models means that the multiples we see on near term earnings will burn off fairly quickly in the next five years

Away from payments and technology, the strategy also experienced strong returns in the period from our retail portfolio in Morocco and the Philippines. In Morocco, the vaccination rollout program has been very successful with over 18m doses administered as of the date of writing (Morocco’s total population is ~36 million of which 27% is under the age of 15). This has bolstered the outlook for sales at Label Vie, the operator of the largest supermarket chain in the country under license from France’s Carrefour. Label Vie also operates the largest cash & carry format stores in the country under the Atacadao brand, a Brazilian concept brand also owned by Carrefour which caters to professional buyers and households. The reason for our optimism on the company’s short term prospects comes from the potential return of the hospitality channel as Morocco reopens to European tourism. Prior to the pandemic, a quarter of Atacadao’s sales came from the hospitality channel and we expect that some of that will start to show in sales over the next few quarters. Longer term, our bullish thesis on Label Vie is underpinned by the broader modern retail sector’s development and management team’s aggressive expansion strategy which is focused on scaling several formats including supermarkets (~700sqm), minimarkets (~200sqm), and Atacadao. It is worth nothing that Label Vie’s management is also investing in building an online presence in Morocco through “Bringo”, a Romanian online grocery concept that is also owned by Carrefour. Morocco is a very nascent market for online (~1% of retail sales) and according to our channel checks has not experienced the same step change in online shopping habits that other markets have experienced since the onset of the pandemic. This gives Label Vie an opportunity to build out its online channel thoughtfully by adapting its offerings and fulfillment strategy to local tastes and dynamics. We were encouraged by management’s receptiveness to our recommendations in this area and expect to continue to engage with them as they build out their online model. In the Philippines, we are seeing early signs of a recovery as vaccinations begin to pick up pace. Encouraged by that progress, we made an investment in a leading home improvement retailer that we believe will benefit tremendously from the return in construction spending and home renovation activity. It is worth nothing that unlike in other markets in the world, construction activity has been largely suppressed in the Philippines since the pandemic started in March of last year as a result of strict social distancing measures at the local and federal level.

In our last letter, we made a case for investors to think differently about how they approach emerging markets. We argued that many of the largest constituent countries of emerging market indices have reached levels of economic development, regulatory cycle, and market efficiency that makes them comparable to developed markets. We continue to advocate that the true emerging market opportunity today lies in the next generation of emerging markets like Egypt, Indonesia, Kenya, Pakistan, and Vietnam. Today, those market offer up a unique combination of a large, young and rapidly urbanizing consumer base that is increasingly connected but still not served in the same way their counterparts in more developed countries are. Our job is to find public companies that are able to fill that gap by offering services directly to those customers (B2C) or by enabling other businesses to offer those services to customers (B2B2C). That gap represents a substantial economic and social profit opportunity for well run businesses in which the strategy is generously invested.

Vergent Asset Management LLP


DISCLOSURES

1. Unless otherwise stated, all data is at June 30, 2021 and stated in US dollars (US$). Source: Connor, Clark & Lunn Financial Group, Thomson Reuters Datastream.
2. Performance history for the Vergent Emerging Opportunities Strategy is that of the Vergent Emerging Opportunities Composite. The Composite has an inception and creation date of August 2018.
3. Net performance figures are stated after management fees, estimated performance fees, trading expenses and before operating expenses. Operating expenses include items such as custodial fees for pooled vehicles and would also include charges for valuation, audit, tax and legal expenses. Such additional operating expenses would reduce the actual returns experienced by investors. Past performance of the strategy is no guarantee of future performance; Future returns are not guaranteed and a loss of capital may occur. For illustrative purposes, performance fee of 20% on added value over the hurdle rate of 6% plus the management fee of 1.25% have been assumed. Actual management fees charged to a particular account may vary.
4. There is no benchmark for the Vergent Emerging Opportunities Strategy because it has an absolute return objective
5. Standard Deviation measures the dispersion of monthly returns since the inception of the strategy.
Benchmarks and financial indices are shown for illustrative purposes only, are not available for direct investment, are unmanaged, assume reinvestment of income, do not reflect the impact of any management or incentive fees and have limitations when used for comparison or other purposes because they may have different volatility or other material characteristics (such as number and types of instruments) than the Strategy. The Strategy’s investments are not restricted to the instruments comprising any one index and do not in all cases correspond to the investments reflected in such indices.
These materials (“Presentation”) are furnished by Vergent Asset Management (“Vergent”) on a confidential basis for informational and illustration purposes only. This Presentation is intended for the use of the recipient only and may not be reproduced or distributed to any other person, in whole or in part, without the prior written consent of Vergent. Certain information contained in this Presentation is based on information obtained from third-party sources that Vergent considers to be reliable. However, Vergent makes no representation as to, and accepts no responsibility for, the accuracy, fairness or completeness of the information contained herein. The information is as of the date indicated and reflects present intention only. This information may be subject to change at any time, and Vergent is under no obligation to provide you with any updates or amendments to this Presentation. This Presentation is not an offer to buy or sell, nor a solicitation of an offer to buy or sell any security or other financial instrument advised by Vergent. This Presentation does not contain certain material information about the strategy, including important risk disclosures. An investment in the strategy is not suitable for all investors, and before making an investment in the strategy, you should consult with your professional advisor(s) to determine whether an investment in the strategy is suitable for you in light of your investment objectives and financial situation. Vergent does not purport to be an advisor as to legal, taxation, accounting, financial or regulatory matters in any jurisdiction, and the recipient should independently evaluate and judge the matters referred to in this Presentation. Vergent Asset Management LLP is registered in England and Wales with its registered office address at 8th Floor, 1 Knightsbridge Green, London SW1X 7QA, United Kingdom (Companies House number OC418829) and is authorized and is an Exempt Reporting Adviser in the USA. It is regulated by the Financial Conduct Authority (FRN: 791909).
THIRD-PARTY DATA PROVIDERS
This report may contain information obtained from third parties including: Merrill Lynch, Pierce, Fenner & Smith Incorporated (BofAML), S&P Global Ratings, and MSCI. Source: Merrill Lynch, Pierce, Fenner & Smith Incorporated (BofAML), used with permission. BofAML permits use of the BofAML indices related data on an « As Is » basis, makes no warranties regarding same, does not guarantee the suitability, quality, accuracy, timeliness, and/or completeness of the BofAML indices or any data included in, related to, or derived therefrom, assumes no liability in connection with the use of the foregoing, and does not sponsor, endorse, or recommend CC&L Canada, or any of its products. This may contain information obtained from third parties, including ratings from credit ratings agencies such as S&P Global Ratings. Reproduction and distribution of third party content in any form is prohibited except with the prior written permission of the related third party. Third party content providers do not guarantee the accuracy, completeness, timeliness or availability of any information, including ratings, and are not responsible for any errors or omissions (negligent or otherwise), regardless of the cause, or for the results obtained from the use of such content. THIRD PARTY CONTENT PROVIDERS GIVE NO EXPRESS OR IMPLIED WARRANTIES, INCLUDING, BUT NOT LIMITED TO, ANY WARRANTIES OF MERCHANTABILITY OR FITNESS FOR A PARTICULAR PURPOSE OR USE. THIRD PARTY CONTENT PROVIDERS SHALL NOT BE LIABLE FOR ANY DIRECT, INDIRECT, INCIDENTAL, EXEMPLARY, COMPENSATORY, PUNITIVE, SPECIAL OR CONSEQUENTIAL DAMAGES, COSTS, EXPENSES, LEGAL FEES, OR LOSSES (INCLUDING LOST INCOME OR PROFITS AND OPPORTUNITY COSTS OR LOSSES CAUSED BY NEGLIGENCE) IN CONNECTION WITH ANY USE OF THEIR CONTENT, INCLUDING RATINGS. Credit ratings are statements of opinions and are not statements of fact or recommendations to purchase, hold or sell securities. They do not address the suitability of securities or the suitability of securities for investment purposes, and should not be relied on as investment advice.
Source: MSCI. The MSCI information may only be used for your internal use, may not be reproduced or re-disseminated in any form and may not be used as a basis for or a component of any financial instruments or products or indices. MSCI makes no express or implied warranties or implied warranties or representations and shall have no liability whatsoever with respect to any MSCI data obtained herein. This report is not approved, reviewed or produced by MSCI.

As we write this commentary, the first half of the year is behind us and most stock indices are at all-time highs. Earlier in the year, an inflation scare drove the United States (US) 10-year Treasury yield to 1.74% with a small correction in growth assets like those listed on the Nasdaq. It seems the market has decided to follow the cues of the US Federal Reserve (Fed) that inflation will be transitory, once the effects of the pandemic, the pent-up demand and the disruptions to the supply chain are behind us.  Since March 5, equity markets have been roaring back and the 10-year Treasury yield is now range-bound at around 1.5%. Inflation numbers, however, continue to rise.

What do we think at Global Alpha? Unfortunately, we do not have a crystal ball, nor have we reached a consensus amongst ourselves. However, we believe the risk that inflation will be sustainably higher than the target of 2% established the Fed and many central banks is high.

The table below shows the prices of various commodities. Many would argue that 2020 was an outlier.  That is why we based our comparison on 2019, which was a normal year with a strong economy. The numbers are self-explanatory. In many cases, prices are at multi-year highs. Copper is now at its highest level since 2011, and reached an all-time record this quarter, as did lumber.

Price of (in US$)June 28, 2019June 30, 2020June 30, 2021% increase over 2019
Oil (Bbl)58.4739.2773.9026%
Natural Gas (Mcf)2.311.753.6558%
Gasoline (gallon)1.771.262.2627%
Corn (Bushel)41437358541%
Pork (lb)0.870.751.0420%
CRB Food Index34829048840%
Copper (MT)59936015933556%
Aluminium (MT)18201620255240%
Lumber (MBF)37943671889%
CRB Index40836055737%
Baltic Freight Sea shipping138117993418247%
Sources: USDA, CRB

The broadest measure of commodity prices, the CRB Index, is at its highest since 2011, when it reached an all-time high. Its component, the CRB Food Index, is also at its highest since 2011, near its record high.

Many observers will brush off commodity price inflation, arguing that it is caused by an imbalance between demand and supply that normally reverts within a few quarters. Although true, the supply response can take a lot longer than expected. Oil and gas companies are under enormous pressure and are not increasing exploration. Political uncertainty in South America may slow the supply growth for copper. The effects of weather events seem to have a more permanent effect on the inflation of agricultural commodities. For now, let’s assume that supply will come back and prices will come down. The example of lumber, which has recently retreated from above $1700/mbf to just over $700 may prove this point. In our opinion, what may drive a more sustainable inflation will be wage increases, which are driven by inflation expectations.

What we are witnessing currently, particularly in North America, is a wage inflation between 5% and 10% for the lowest earners. Inflation expectations are running close to 4%. There is a risk that the situation becomes a self-feeding mechanism, like in the 70s. Another big component of inflation is rent. The median asking rent in the US has increased almost 18% from the end of March 2020 to the end of March 2021, reaching $1,226 per month. It is up 22% since March 2019.[1]

Many have stated that a big reason for the low-inflation of the last twenty years was the emergence of China and its vast labor pool of migrant workers as the factory of the world. In May of this year, China’s producer price index reached 9%, its highest level since the summer of 2008. China will no longer be the deflationary force it has been in the last two decades. Between the aging of its population, its internal needs and increasing trade frictions, we can expect price increases from China.

Inflation numbers will continue to be very high, one might even call them scary for the next twelve months. How the Fed, politicians, unions, consumers and investors will react to these numbers will be important to watch, and our job is to forecast. We are already starting to see some divergence between central banks, like those of Norway, New Zealand and Canada, and even within the ranks of the Fed.

How will the market react to increasing signs that inflation will be more than transitory and that rates will rise?

Past episodes have shown that long-duration assets like long-term bonds and high growth stocks will be most affected. US large caps, particularly technology companies, are selling at important premiums versus other markets. They will be most vulnerable. Europe does not have the same labor inflation pressures. That said, inflation in the region may be more contained.

Smaller companies have generally outperformed in periods of inflation. From January 1979 to July 1983, the Russell 2000 Index outperformed the S&P 500 Index by 77%. During this time, inflation rose to as high as 13% and the economy suffered a double-dip recession in 1980 and 1981-82, before staging an extremely strong recovery in 1983 with growth rates as high as 8.5%.[2]

Our portfolio is well positioned for a strong recovery accompanied by higher inflation. With less debt, a rise in interest rates will have a minimal impact. With a more important exposure to the consumer and industrial sectors, economic growth will translate into earnings growth.

As mentioned in last week’s commentary, our companies have been able to maintain their margin despite rising input costs through a combination of price increases and efficiency gains.


[1] www.census.gov

[2] http://www.cmegroup.com/