We recently launched our Emerging Markets (EM) Small Cap fund. Comprised of over 11,000 companies, the EM Small Cap universe presents plenty of very sound investment ideas. One of the main challenges we have encountered since launching the fund more than a month ago has been the strong Chinese government regulations in various sectors, mainly technology and education. While we do not have investments in these sectors in China, we have seen a climate of increasing uncertainty in other economic sectors.

From a local perspective (which can differ from Western perspective), Chinese policy-makers are aiming for common prosperity, which fundamentally entitles a policy shift towards reducing wealth inequality. The concept is not new; it has been a long-term goal of the Chinese government that has become more relevant recently. The Central Party and State Council jointly announced the plan on June 10, establishing Zhejiang province as the pilot zone. The 14th five-year plan (2021-2025) called for an “action plan” to be fully implemented by 2050 to become an advanced, modern economy. Among common prosperity goals are narrowing the income gap, tackling the increasing real estate prices, promoting higher household income growth, increasing public services, such as healthcare and education, and improving living conditions of rural residents, among many others. These common prosperity initiatives will likely rebalance the economy from investments to consumption, targeting the mid-low-income population. Moreover, the state’s role in public and private sectors is likely to become more relevant.

It is worth noting that the Chinese government seems to have downplayed the importance of paying too much attention to short-term growth. They indeed have a short-term buffer, considering the 2021 GDP target is “above 6%”, and the country is likely to grow in the range of 8% this year.[1] The current outlook is more focused on solving structural problems, which may have short-term collateral consequences, but the vision is to improve the long-term perspective. Indeed, President Xi has emphasized a couple of times that the aforementioned long-term goals are not just an economic objective, they are about the Party’s “governing foundation”. The foregoing is still interesting, since, as previously mentioned, the Western vision is often different. Billions of dollars have been lost in market capitalization of Chinese assets, driven by strict regulatory policy in the after-school tutoring sector, together with anti-monopoly and cybersecurity rules in the internet sector. The government has also tightened property policies. Currently a blanket of uncertainty persists regarding « which sector will be regulated next ». For example, almost one month ago, a state media article equated the gaming industry, which has many companies that trade on the stock market, to “opium”.  Although the government quickly quashed this article and there were no official statements, it caused a rapid slump of shares linked to the gaming sector, reflecting the prevailing nervousness among investors. The government recently released new regulations for the industry, including limiting the amount of time children can play video games to three hours a week, and last week state media mentioned that companies should avoid the sole focus of pursuing profit, in order to prevent minors from becoming addicted to games. This sentiment led to another round of losses in gaming-related stocks.

Again, different perspectives come into play. We believe China is trying to improve its society in the long term, but are not very concerned about the effect this may have on investors in the short term. The question then is; how can we better cope and adjust to these policies for the benefit of our clients? China accounts for around 10% of the MSCI EM Small Caps index, making it an important investment for our fund. Our approach to this new environment is to understand the domestic perspective and invest in companies/sectors that are subject to less regulation and more likely to benefit from the new trends that we see emerging in the future. Each scenario presents a new opportunity and the trends include:

  • greater self-reliance on government-fostered technology (semiconductors, artificial intelligence);
  • renewable energy;
  • fitness;
  • consumption favouring local brands/companies; and
  • manufacturing industry and robotics for products designed mainly to support and strengthen the Chinese  economy. 

In manufacturing and robotics, Estun Automation (002747 CH) is one of our key holdings. The company is the largest domestic industrial robot-maker in China and one of the best-positioned stocks in the A-share Small-Cap automation sector. Estun also produces several key components itself, which gives the company a strong competitive advantage in relation to competitors who rely on external suppliers. For example, Estun is one of the few robot-makers that can manufacture servo systems and controllers in-house. It has also managed to gain cutting-edge technologies, like robot 3D vision and micro-servos via a number of acquisitions. In short, Estun has the capabilities to manufacture almost all of the core parts it needs, with the exception of reducers, although they still procure the basic mechanical parts and semiconductor chips. They also have production plants across the globe. The two key plants are UK-based Trio, acquired in 2017, a top 10 global player in motion control systems, and Germany-based Cloos, acquired in 2019, making the brand a cutting-edge welding robot. In light of this, supply chain management has become a key issue for Estun.

The latter is definitely a big advantage. For industrial automation, all the key core technology is in upstream components, like servos, motion control systems, and reducers. Thus, without access to upstream components, a company is merely one of many system integrators, which face a significantly lower entry barrier, intense competition, and lower margins. In fact, now that the Estun brand is better known, more external system integrators are starting to integrate Estun’s robots into their product portfolio, which is why Estun shifted resources away from their system integration department. Back in 2019, the revenue contribution of industrial robot manufacturing and sales, and system integration sub-segments was 50:50, but from 2020 onward, it’s been skewing towards robot sales. As of the first half of 2021, the proportion has shifted to 80:20 for sales of robots to system integration.

Nowadays, Estun’s main end markets are lithium-ion batteries, computers, communications, and consumer electronics (known as the 3C industry in China) applications, solar, welding robots (primarily for heavy machinery), and metal forming (processing). Smaller, fast-growing contributors include woodwork, home appliances, and packaging. Meanwhile, the core markets for the Cloos robot brand are medium- and heavy–plated 6-axis welding robots. Currently, this brand is gaining market share in China’s heavy machinery segment. Cloos is also developing their medium-plated welding robots, which are commonly used in heavy-duty trucks.

Industry-wise, according to the MIR database, a Chinese based, high-end, hardware-focused research, the China automation market size grew 26.9% year over year to approximately RMB153 billion in the first half of 2021. The market is continuously experiencing robust demand from new-economy manufacturers, notably industrial robots, electric vehicle batteries, wind turbines/solar panels, as well as 3C and logistics, and some of the more niche markets (e.g., tobacco, wood engraving), which are dominated by Japanese players. However, this represents a huge upside potential for players like Estun, who are narrowing their technology gap with international peers. Moreover, machine exports drove some of the automation demand in the first half of 2021. Estun (and peers like Innovance) have experienced continuous market share gains. The company is also well positioned to maintain its domestic industrial robot leadership position, especially in 4-axis and 6-axis industrial robots, which contributed to approximately 85% of their shipment volume in the first half of 2021.

Estun’s focus on the new-economy manufacturers, coupled with their expected market share gains, should ensure a secular growth trend in the long term. Although there has been plenty of uncertainty around the Chinese economy since the start of the second half of 2021, we continue to view industrial automation (IA) demand as among the highlights of local dynamics, given the favourable demand outlook and strong policy support for an industrial upgrade. Estun is a perfect example of a company that can position Chinese automation, robotics, and industrialization on par with the leading international players. We believe the company will get ongoing government support for achieving these targets in the mid/long term, so the company is unlikely to be exposed to any material regulation risk. In light of its quarterly politburo meeting outlining the drive to “encourage enterprise to scale up technological upgrade investment”, we expect the manufacturing industry to step up investing pursuit of robotization.

Estun has experienced short-term pressure driven by COVID-19 in China (primarily in Nanjing and Jiangsu, Estun’s headquarters and production base) and lower-than-expected results in Q2 2021 are likely to remain so for the rest of the year. The difficult quarter was driven by:

  • price hikes of parts, base metals and chips;
  • Estun prioritizing market share over margins in 2021; and
  • hikes in raw material transportation fees.
  • the delayed shipping of Trio motion controllers

We feel this situation is temporary and expect margin reversal from next year (or before), driven by ongoing operating leverage, improvements in internal cost control, and more import substitution from domestic parts. In fact, in their 2Q earnings results conference call, the company maintained 2021 revenue guidance of RMB 3.5-4.0 billion, with its 2021/22/25 industrial robot sale targets of 10k/15k/50k units unchanged. Estun management also expects profit margin to rise notably as its business expands.

Despite the short-term headwinds, we hold a positive view toward Estun, as we believe in the sustainability of industrialization and automation, on the back of a solid secular growth trend in the coming years in China. As the local market leader, Estun is now already directly competing with big foreign players, like Japan-based FANUC. Their acquisition of Cloos has significantly contributed to the positioning and diversification of Estun’s robots in China. We expect Estun’s market share to increase from for 3-4% to approximately 10% by 2025, meaning Chinese factories will increasingly shift to domestic rather than foreign brands. We believe Estun has the potential to emerge as one of the leader industrial robot manufacturers globally. This could be a similar story to other emerging domestic players in China, such as excavators, where domestic market leader Sany holds an approximate 25% market share. 

As bottom-up investors, fundamentals drive our stock selection. We look for companies growing faster than their industry, with good margins and cash flows. We also need to understand local dynamics and invest accordingly. China’s recent policies are a good example of a divergence in timing and perspectives between local interests and foreign investors, as detailed above. The road has been bumpy, but opportunities are also emerging, especially in small-cap companies, that will likely have more room to grow in the long run. Government-encouraged manufacturing and robotics companies also present good opportunities in this scenario, which supports our preference for our holding Estun.


[1] www.dw.com
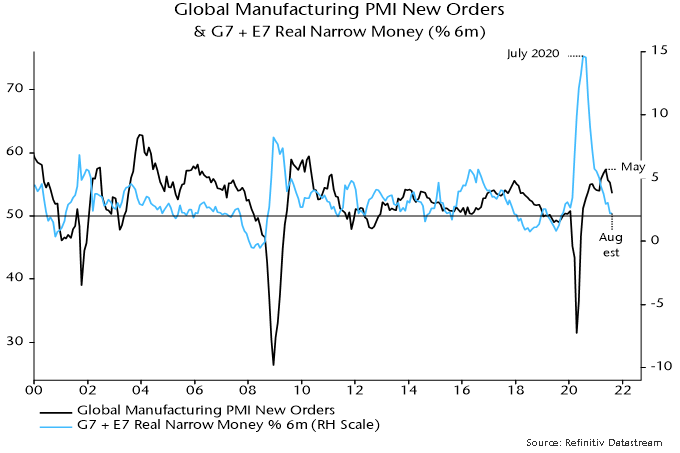
Partial data indicate that global six-month real narrow money growth was little changed in August, following July’s fall to a 22-month low. Allowing for the usual lead, the suggestion is that the global economy will continue to lose momentum into early 2022, with no reacceleration before late Q1 at the earliest.

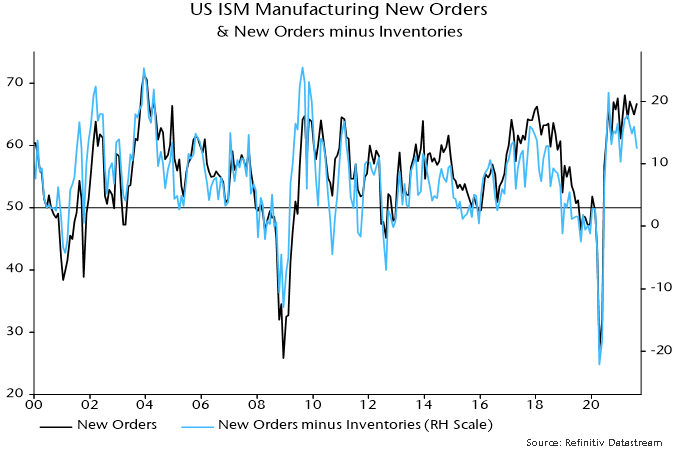
Global PMI results for August were consistent with the slowdown forecast, with the manufacturing new orders index falling for a third month – see chart 1.

Chart 1

The US ISM manufacturing new orders index unexpectedly rose in August but this appears to have been driven by a rise in inventories: the new orders / inventories differential, which often leads, fell to its lowest since January – chart 2.

Chart 2

The US, China, Japan, Brazil and India have released monetary information for August, together accounting for 70% of the G7 plus E7 aggregate calculated here*. CPI data are available for all countries bar the UK and Canada.

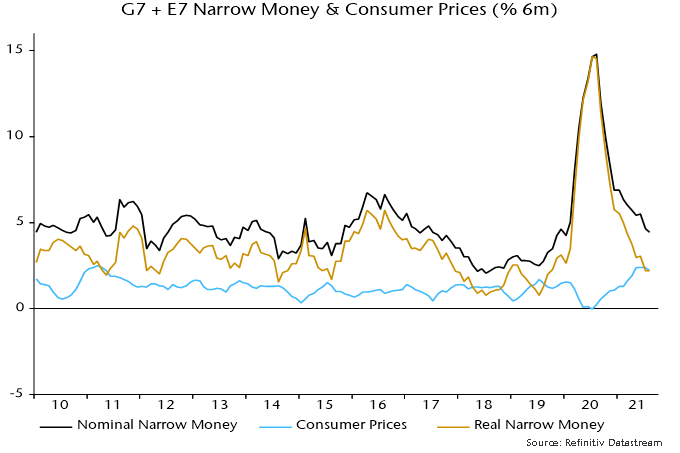
The stability of six-month real narrow money growth in August conceals a further slowdown in nominal money expansion offset by a small decline in CPI momentum – chart 3.

Chart 3

Previous posts discussed the possibility that real money growth would rebound during H2 2021, warranting optimism about economic prospects for 2022 and supporting another leg of the “reflation trade”. The monetary data have yet to validate this scenario.

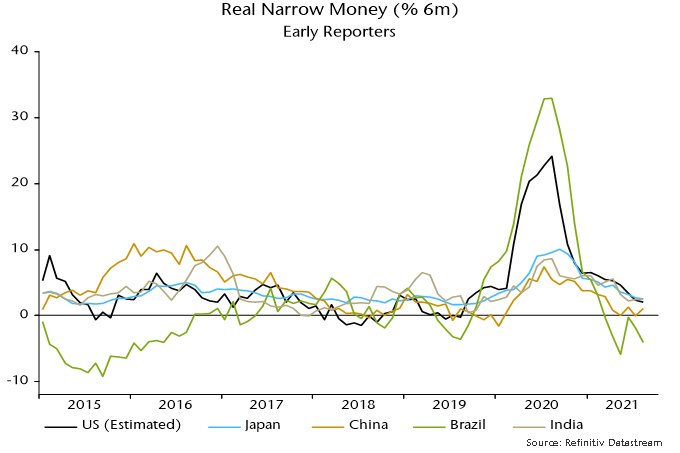
The real money growth rebound scenario depended importantly on a pick-up in China in response to recent and prospective policy easing. Chinese six-month real narrow money growth does appear to have risen slightly in August** but there were offsetting declines in the US, Japan and Brazil – chart 4.

Chart 4

*The US number is estimated from weekly data on currency in circulation and commercial bank deposits.
**The household demand deposit component is estimated pending release of full data.

Historically, individual investors interested in generating safe and stable returns looked to the bond market, which performed predictably and provided investors with a comfortable and low-stress retirement. The 21st century, however, brought with it declining interest rates, lower bond yields, and little indication that the investment environment will revert to easier times.

For investors, this shift means they can no longer rely on what has worked in the past. Investors that want to grow their portfolio or draw stable income from it while maintaining a palatable level of risk need to consider other options. To help, innovative investment managers have developed « alternative » investment approaches that investors can integrate into a portfolio strategy.

In this article, we discuss what alternative investments are and provide an overview of alternative asset classes. For more information on the changing investment environment and innovative portfolio management approaches, please read our Portfolio Guide – Beyond Stocks and Bonds.

What are alternative investments?

Alternative investments refer to any investment strategy that does not take a conventional approach to investing in traditional equities or bonds. Each class of alternatives works to address some of the variety of challenges that investors face while providing diversification benefits within a portfolio and return opportunities. Real estate, private infrastructure, and private equity are the most common forms of alternatives. Others, including hedge funds, alternative income sources, and equity investments in emerging economies, are also gaining attention.

Alternative asset classes have been well-researched, their merits and value proven with institutional investors. Alternatives are commonplace in the portfolios of notable and sophisticated institutional pension funds, such as the Canada Pension Plan, the Ontario Teachers Pension Plan, and the British Columbia Investment Management Corporation.

The main barrier to alternative asset classes has been accessibility for individual investors, with minimum investment thresholds often beyond reach and no public exchange for buying and selling assets cost-effectively. With growing demand, some Canadian investment managers have embraced innovation, introducing several alternatives for potential inclusion in the portfolios of their high-net-worth investors.

What are the major types of alternatives?

There are many alternative asset classes. At CC&L Private Capital, our pension-calibre approach can incorporate the following alternative investments.

Real estate

Real estate provides stable income and return potential. However, individual investors do not commonly use it due to the value of most transactions and the difficulty associated with gaining significant diversification. 

At CC&L Private Capital, our real estate investments include over 235 commercial and residential properties across Canada. They give our clients access to a diversified source of portfolio growth and cash flow, with rent escalation clauses in lease agreements hedging inflation. Our real estate investments include office buildings, industrial manufacturing facilities, distribution warehouses, retail centres, and multi-unit residential properties – assets typically outside the reach of most individual investors.

Infrastructure

Traditional infrastructure and energy assets are a less familiar option for most individual investors, given the complexity and high cost associated with access to the asset class. Institutional investors, however, have proven the value of infrastructure investments. For investors who do not require access to their capital in the short term, infrastructure can be a lower-risk means of generating stable cash flow and long-term capital growth. Infrastructure investments have the added benefit of acting as a buffer from economic turbulence in an investment portfolio.

At CC&L Private Capital, we use  »finance, build, and maintain contracts » with proven counterparties to guide our small- and medium-sized traditional infrastructure projects (e.g., roads, rail, hospitals), renewable power generation projects (i.e., hydro, wind, and solar), and energy transmission assets.  

Private loans

Lending to private, middle-market companies is a way for investors to obtain stable interest payments secured by liens against corporate assets. It makes private loans a reasonable fixed income alternative given declining bond yields. While it is not a common asset class in Canada, it is often seen in other markets, such as the USA and Europe. Private loans also contribute to the diversity of a portfolio, providing an uncorrelated source of income.

At CC&L Private Capital, we offer private loans to middle-market Canadian companies, typically in the range of $20 to $60 million.

Hedge strategies

The use of hedge strategies offers investors enhanced diversification in their portfolios by providing an uncorrelated source of return driven by analyst insights rather than by market-driven factors.

At CC&L Private Capital, we use three distinct hedge strategies in our portfolio—Canadian small-cap equities, a range of Canadian and global bonds, and global equities—in a manner that can decrease a portfolio’s exposure to core bonds.

Private equity

Providing capital in exchange for equity in private Canadian companies can be an excellent source of potential return for investors when coupled with the oversight of experts.

At CC&L Private Capital, we utilize the team at our Banyan Capital Partners affiliate. Banyan invests in companies with a historical track record of strong operations and consistent cash flow – working with owners and managers to drive efficiencies and spur growth.

Frontier markets

Frontier markets are unclassified markets or markets that are not represented well in the emerging markets index, such as Indonesia, the Philippines, Vietnam, Ghana and Kenya. They have large and growing populations and low but increasing income levels. As incomes rise, these countries’ populations are expected to increase consumer spending on goods and services. It should increase the profitability and business maturity of local companies able to meet rising consumer demand – making such companies ripe for investment.

While frontier investments are more volatile than many other alternative asset classes, their potential for generating returns over the long term is significant. At CC&L Private Capital, we believe that adding a modest allocation to frontier markets can help improve the return potential of a portfolio. However, any investments need to be made based on a discussion of the risk and return trade-offs. 

Moving beyond traditional investment approaches

It is becoming increasingly difficult for investors to get the portfolio returns they desire using traditional investment methods in the evolving investment environment. By embracing innovative approaches to a portfolio strategy, including the use of alternatives, investors can better position themselves to achieve their financial goals while managing their risks. 

Understanding different investment options is challenging, but an experienced investment manager can help. To find out how, please read our Portfolio Guide – How to future-proof your investment portfolio.

Contact us

If you would like to find out more about our approach to alternatives or learn how we can help you grow your investment returns, please contact us. 

This post is for information only and is not intended as investment advice. The views expressed are those of the author at the time of publication and are subject to change at any time.

Shot with the DJI Mavic Pro

In Canada and other developed markets, equity diversification has changed significantly in recent years. Traditional investments are now less diversified due to the increasing integration of global supply chains and global markets’ interconnectedness. 

The importance of diversification, however, has not changed. If anything, it is more important than ever. With declining interest rates and record-low bond yields, investors are on a quest for income and better returns. Many investors have increased their exposure to developed or emerging-market equity investments. However, they have experienced consequences when markets have tumbled in unison, such as during the early days of the COVID-19 pandemic.

Some investment managers now offer opportunities to invest in geographically unique markets. In particular, frontier markets are presented as a major opportunity for investors who have the flexibility to make long-term investments.

What are frontier markets?

Frontier markets are an alternative asset class focused on identifying opportunities in economies that are still in their infancy in terms of development. These « frontier » markets are less developed than emerging markets like China or Brazil. 

Unlike emerging markets, there is no clear and standard definition of frontier markets. We consider frontier markets to be unclassified markets or markets that are not represented well in the emerging markets index, such as Indonesia, the Philippines, Vietnam, Ghana, and Kenya. These have large and growing populations and low but increasing income levels.

As incomes rise, these countries’ populations are expected to increase consumer spending on goods and services. It should increase the profitability and business maturity of local companies able to meet rising consumer demand – making such companies ripe for investment.

Understanding the risks and benefits of frontier investing

While many of these countries are high-risk due to their low level of economic maturity and potential political instability, their economies are highly localized and disconnected from global trends, making them a viable mechanism for diversifying portfolios. To mitigate risk, the companies we invest in are typically consumer-focused – with offerings that meet local consumption demand rather than global supply needs.

Investing in frontier markets can also generate social benefits, injecting much-needed capital into underinvested companies and helping drive regional economic development and the maturation of key industries. Investors can make their money do good in the world while also contributing to their long-term financial goals.

How do frontier market investments fit within an investor’s financial portfolio?

At CC&L Private Capital, we believe that adding a modest allocation to frontier markets can help improve the robustness of a portfolio under certain circumstances. However, any frontier investments need to be made based on a fulsome discussion of the risk and return trade-offs.

Find out more

For more information on different types of alternative asset classes and innovative investment approaches, read our Portfolio Guide: Beyond Stocks and Bonds.

If you would like to find out more about our approach to frontier investing or learn how we can help you grow your investment returns, please contact us.

This post is for information only and is not intended as investment advice. The views expressed are those of the author at the time of publication and are subject to change at any time.

To enact change, more and more investors expect their money managers to hold companies accountable on environmental, social, and governance (ESG) issues. It aligns with a backdrop of social discourse from climate change and carbon emissions to equality and racism, alongside an outspoken, socially conscious, millennial generation that has integrated ESG into investment decisions and client portfolios.

There is a lot of conflicting information about what ESG investing is and why it should matter to investors – not to mention many misconceptions around whether ESG factors help or hinder investment performance. 

This article highlights how ESG investing has evolved and what it means today, shares our embrace of ESG factors in decision-making, and shows how to make your investments matter without sacrificing return potential.

How has the concept of ESG investing evolved?

Making investment decisions based on ESG-related factors is not new, although it has evolved significantly over the past 25 years. Early on, many ESG-related investment approaches took an exclusionary stance. They avoided investments in specific industries or companies that were associated with negative environmental or human impacts or had a reputation for poor or dangerous work conditions.  

In recent years, such investment approaches have matured and now align with different investors’ unique needs and objectives. At CC&L Private Capital, we typically break ESG-related investment approaches into three categories: 

  • ESG investing: Considering environmental, social, and governance issues as risk factors and integrating each into our investment process. This analysis and decision-making criteria informs our discipline when evaluating a stock, bond, or alternative investment in order to drive better risk-adjusted returns
  • Socially responsible investing (SRI): Use environmental, social, and governance risk factors to screen and filter specific risk exposures. These screening criteria are clearly defined but remain secondary to the primary objective of maximizing risk-adjusted investment returns. 
  • Impact Investing: An approach that takes the concept of SRI one step further, where all investments have a dual purpose: achieving a positive ESG impact and generating investment returns.

ESG investing, as defined above, should be relevant to all investors because it focuses on value. It is another important tool used to evaluate potential investments and determine return potential.

We embrace ESG factors in decision-making

At CC&L Private Capital, we integrate ESG factors into all of our investment processes, including traditional and alternative asset classes. This process identifies good environmental stewards that pay strong attention to health, safety, and social issues, and are well-governed.

By integrating ESG factors into our investment approach, we indirectly reward companies who embrace good corporate citizenship and provide the impetus to change for those that may be lagging. We are able to hold companies accountable and help them improve their own ESG activities. 

We also use a  »positive screen » approach – recognizing the best-in-class players in an industry or sector and encouraging others to make similar changes. For example, we might invest in a leading oil & gas company that takes environmental issues seriously, builds strong relationships with indigenous communities, and embraces diversity within their governance structures. 

In a world where ESG issues are growing in importance, we believe in working with clients and discussing an approach that better aligns with their values. It will help to generate improved risk-adjusted investment returns over the long term while contributing to the betterment of Canada and the world. 

Making investments that matter

ESG investing does not mean investors must choose between making socially-conscious investments and maximizing return potential. You can achieve both. Research has shown that, all else being equal, companies with sustainable business practices and a strong attention to corporate governance are likely to have less risk and perform better financially than those companies without. Investing in such companies leads to long-term value creation and contribute to building a better world. 

Find out more

In today’s investment environment, getting the returns you want can be difficult. To learn how you can build a diversified portfolio that achieves your financial goals while managing risk, please read our Portfolio Guide – Beyond Stocks and Bonds.

If you would like to find out more about our approach to ESG investing or learn how we can help you achieve your investment goals, please contact us.

This post is for information only and is not intended as investment advice. The views expressed are those of the author at the time of publication and are subject to change at any time.

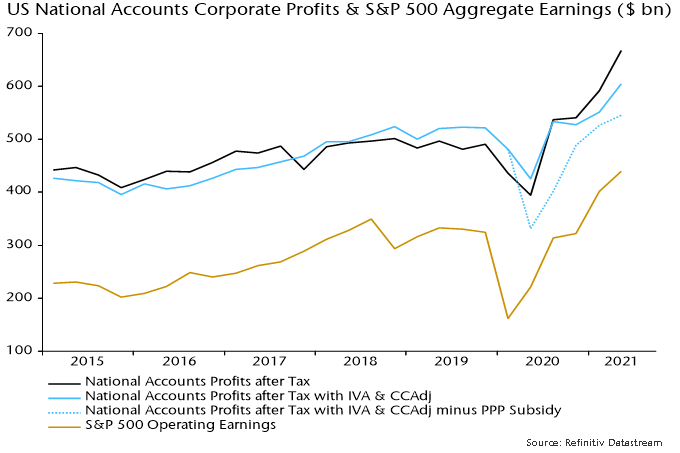
National accounts profits numbers for Q2 released last week mirror recent strength in company earnings reports. The concept closest to S&P 500 earnings – corporate profits after tax – rose by 13% in Q2 to stand 36% above its level in Q4 2019. The national accounts series covers all corporations but S&P 500 operating earnings also grew by 36% between Q4 2019 and Q2 this year – see chart.

The national accounts analysis additionally contains a measure of “economic profits”, i.e. excluding inventory gains and adjusted for the difference between reported and economic depreciation*. Reflecting commodity price strength, inventory profits have been significant in recent quarters, while overreporting of depreciation (to minimise tax bills) fell in 2020 and has remained at a lower level in H1 2021.

This economic profits measure, therefore, has performed less impressively than “headline” earnings, rising by 10% in Q2 to stand 16% above its Q4 2019 level.

This measure, however, still overstates underlying profits strength because it includes government subsidy payments to corporations under various pandemic response schemes, the most significant of which has been the now-closed Paycheck Protection Program. The subsidy payment to corporations under this scheme accounted for 10% of economic profits in Q2 but will fall to zero over coming quarters**.

Q2 profits were also supported by payments under the Employee Retention Tax Credit scheme and grants to air carriers, among other emergency measures.

Excluding only the PPP subsidy, growth of economic profits between Q4 2019 and Q2 this year falls to just 4%.

The level of headline national accounts profits was 22% higher than this adjusted economic profits measure in Q2. A reasonable base case assumption is that this overshoot will be eliminated by Q2 2022.

The consensus forecast is for S&P 500 operating earnings to rise by a modest-sounding 3% in the year to Q2 2022. For national accounts profits to grow at the same pace, underlying profits – i.e. excluding inventory gains, subsidies etc. – might have to increase by more than a quarter. Such strength is implausible, requiring the unlikely combination of rapid economic growth with no associated downward pressure on margins from a tightening labour market.

*Profits after tax with inventory valuation adjustment (IVA) and capital consumption adjustment (CCAdj).
**The subsidy payment is recorded as occurring over the term of the loan, not when it is forgiven.

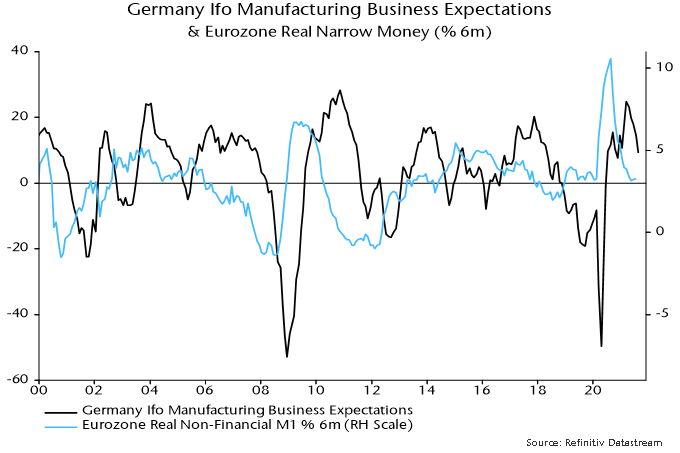
Eurozone monetary trends have been suggesting an economic slowdown through end-2021. A recent moderation of consumer price momentum, however, has stabilised six-month real narrow money growth, hinting at a bottoming out of business surveys and other coincident indicators in early 2022.

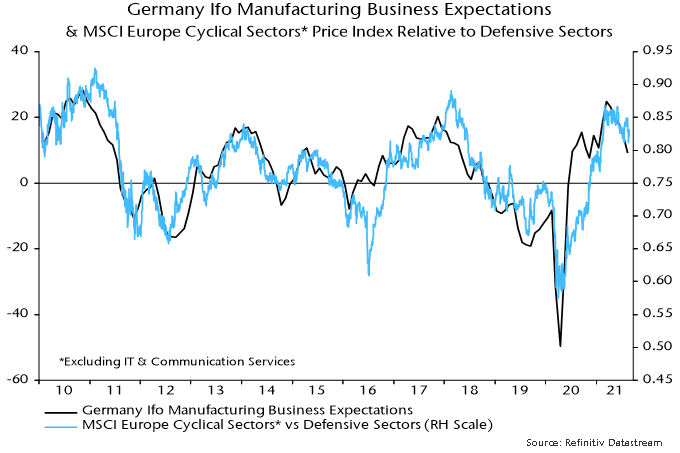
The Ifo manufacturing survey is a timely indicator of German / Eurozone industrial momentum, displaying a strong contemporaneous correlation with German / Eurozone manufacturing PMIs (but with a longer history). The business expectations component peaked in March, falling for a fifth month in August – see chart 1.

Chart 1

The March peak is consistent with an August 2020 peak in Eurozone six-month real narrow money growth. The implied seven-month lead is slightly shorter than the historical average – the correlation between Ifo business expectations and Eurozone real money growth is maximised by applying a nine month lag to the latter.

Real narrow money growth, however, has moved sideways since May (July money numbers were released yesterday). The suggestion is that the Ifo indicator – along with PMIs and other business surveys – will weaken further during H2 but bottom out in early 2022.

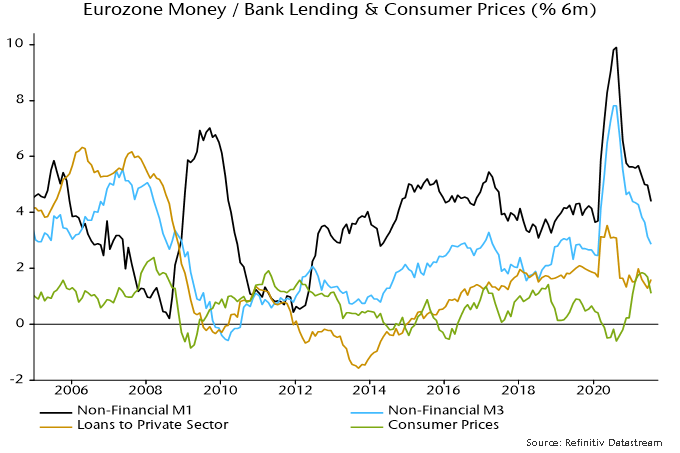
The recent stabilisation of real money growth is not entirely convincing: nominal money trends continued to weaken in June / July but this was offset by a slowdown in six-month consumer price momentum – chart 2.

Chart 2

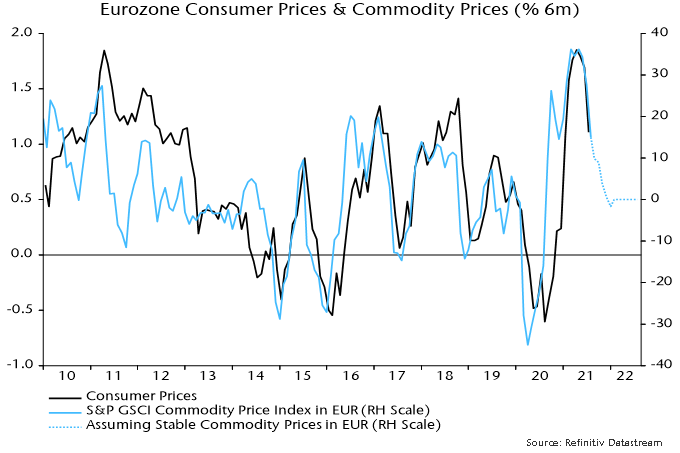
The inflation slowdown, however, could extend, assuming that commodity prices (in euro terms) stabilise at their current level – chart 3.

Chart 3

A recovery in nominal money growth is required to warrant shifting to a positive view of economic prospects. Such a signal would relate to H1 2022 – earlier real money weakness has “baked in” likely economic disappointment over the remainder of 2021.

What could lift money growth? The most likely candidate is a pick-up in bank lending. Six-month growth of loans to the private sector recovered in July – chart 2 – while the most recent ECB bank lending survey reported the strongest expectations for credit demand since 2016.

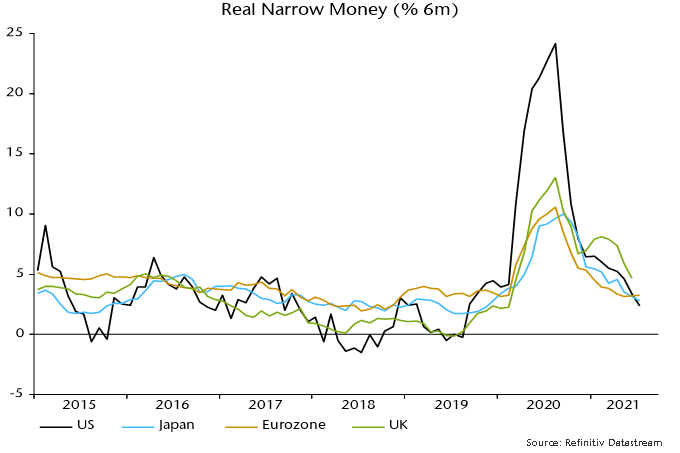
The recent stabilisation of Eurozone six-month real narrow money growth contrasts with a further slowdown in the US – chart 4. The divergence / cross-over suggests improving Eurozone relative economic and equity market prospects, although US real growth could benefit from a faster inflation slowdown over coming months.

Chart 4

A further fall in Ifo manufacturing business expectations and other survey indicators during H2 would probably be associated with underperformance of European non-tech cyclical sectors relative to defensive sectors – chart 5.

Chart 5

Detailed monetary data for July released yesterday suggest that recent policy easing is beginning to support money growth, in turn hinting at a recovery in economic momentum from end-2021.

A sustained slowdown in six-month narrow money growth from July 2020 correctly signalled “surprise” Chinese economic weakness so far in 2021. The expectation here was that the PBoC would ease policy in Q2, supporting economic prospects for later in 2021. Adjustment was delayed but the reserve requirement ratio cut on 9 July appeared to mark a significant shift. The hope was that July monetary data would confirm a bottom in money growth.

The headline July numbers released on 11 August seemed to dash this hope, with six-month of “true M1” falling to a new low – see chart 1*.

Chart 1

The additional data released yesterday allow a breakdown of the deposit component of this measure between households, non-financial enterprises and government departments / organisations. It turns out that the further fall in growth in July was due to the latter public sector element, which is volatile and arguably less important for assessing prospects for demand and output.

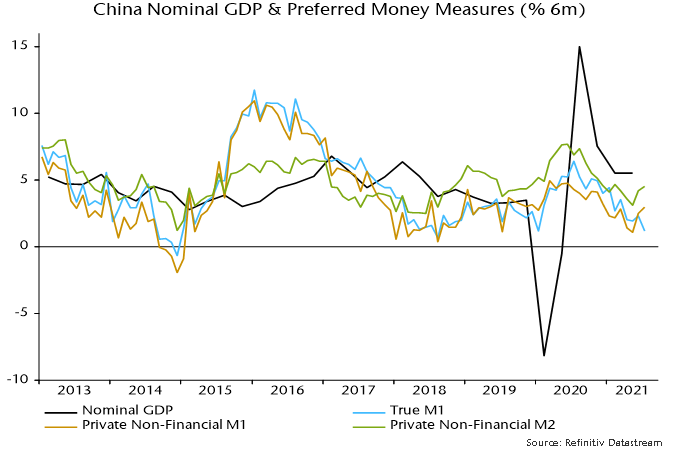
Six-month growth of “private non-financial M1”, i.e. currency in circulation plus demand deposits of households and non-financial enterprises, rose for a second month in July. So did the corresponding broader M2 measure – chart 1.

This improvement needs to be confirmed by a recovery in overall narrow money growth in August, ideally accompanied by a further increase in the private sector measure. One concern is that the rebound in the latter has so far been driven by the household component – enterprise money growth remains weak.

Increased bond issuance and fiscal easing could lift public sector money growth during H2.

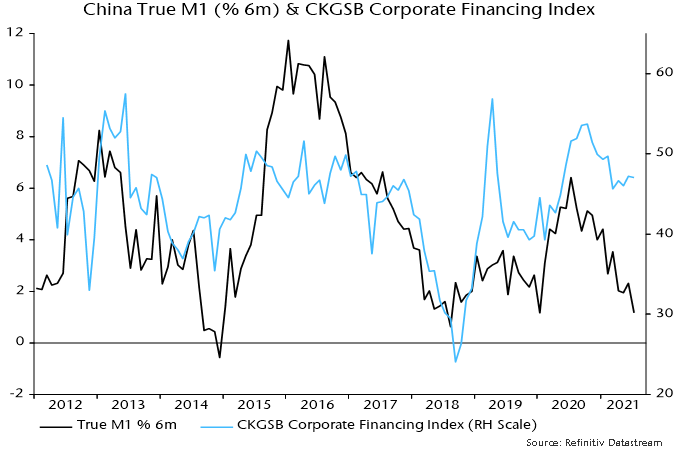
The corporate financing index in the Cheung Kong Graduate School of Business monthly survey is a useful corroborating indicator of money / credit trends – a rise signals easier conditions. The index bottomed in March but has yet to improve much – chart 2. August survey results will be released shortly.

Chart 2

*True M1 includes household demand deposits, which are omitted from the official M1 measure.

The fall in UK CPI inflation in July reported this week will be of limited comfort to policy-makers – a decline had been expected because of a large base effect and will be more than reversed in August. A bigger story was the further widening of the RPI / CPI inflation gap to an 11-year high. RPI inflation could top 5.5% in Q4 2021, boosting interest payments on index-linked gilts by a whopping £15 billion relative to the OBR’s Budget forecast.

CPI inflation fell from 2.5% in June to 2.0% in July but RPI Inflation eased by only 0.1 pp to 3.8%. RPIX inflation – excluding mortgage interest – was stable at 3.9%.

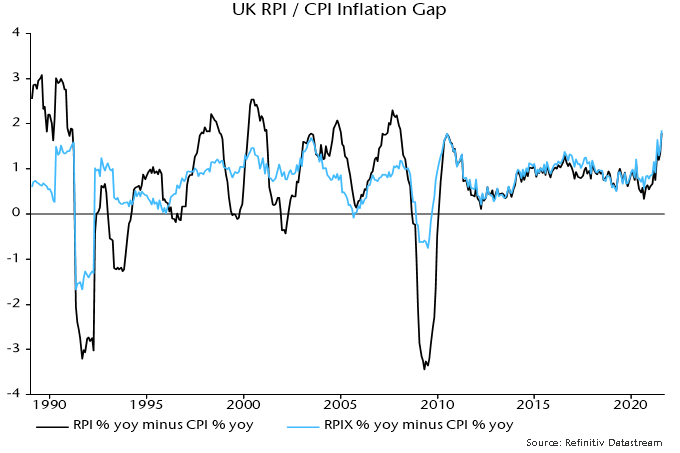
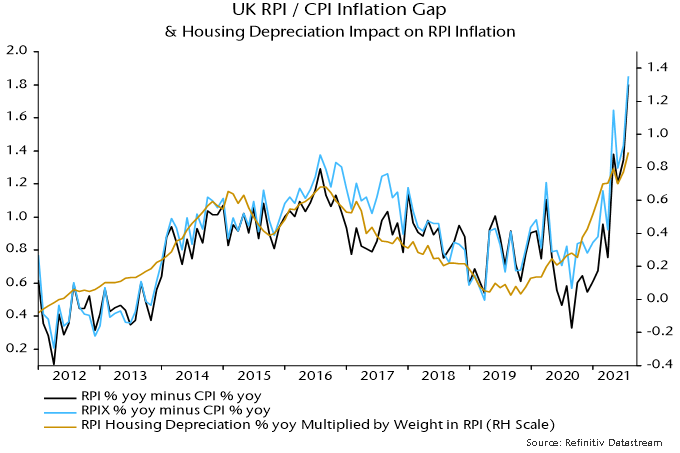
The RPI / CPI inflation gap, therefore, widened to 1.8 pp, its largest since June 2010. The RPIX / CPI inflation gap of 1.9 pp is the biggest on record since the inception of CPI inflation data in 1989 – see chart 1.

Chart 1

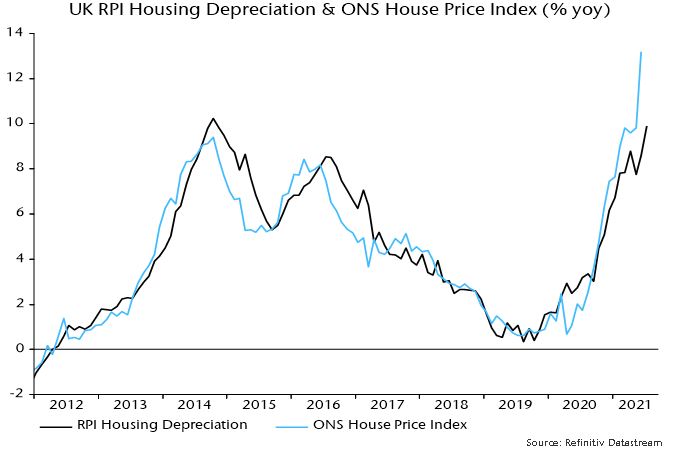
The widening gaps mainly reflect surging house prices, driven partly by Chancellor Sunak’s stamp duty holiday. House prices enter the RPI via the housing depreciation component*, which is linked to ONS house price data with a short lag – chart 2. This component has a 9.0% weight and rose by 9.9% in the year to July, contributing 0.9 pp to RPI inflation of 3.8%. The CPI omits owner-occupier housing costs.

Chart 2

Note that the housing depreciation weight has risen from 5.8% in 2014, i.e. the sensitivity of the RPI to house prices has increased by more than 50% since then.

The RPI / CPI and RPIX / CPI inflation gaps, however, have widened by more than implied by house prices alone – chart 3.

Chart 3

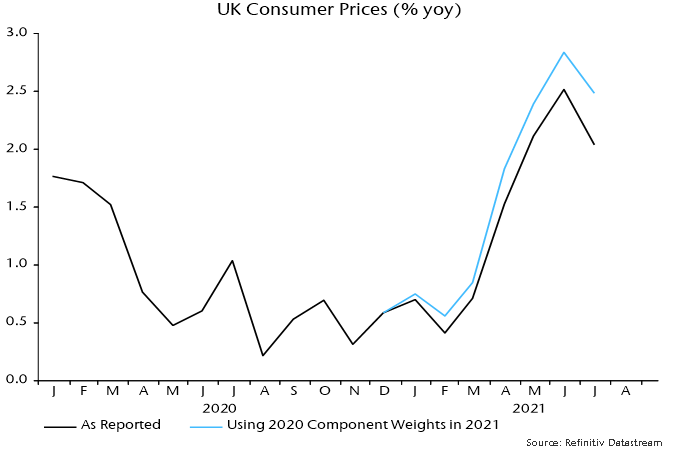
A likely additional influence has been the ONS decision to depart from its normal procedure and base 2021 CPI weights on 2020 rather than 2019 expenditure data. As previously explained, this has lowered the weight of categories hit hardest by the pandemic but now experiencing a rebound in demand and prices. An alternative calculation carrying over 2020 weights (based on 2018 expenditure data) to 2021 produces an annual inflation number for July of 2.5% rather than 2.0% – chart 4.

Chart 4

The RPI has been less affected because the normal procedure was followed of basing weights on expenditure shares in the 12 months to June of the previous year. 2021 weights, therefore, reflect spending in the year to June 2020 – the impact of the pandemic was smaller over this period than in calendar 2020.

So weighting effects are likely to have had a larger negative impact on CPI than RPI inflation.

The phase-out of the stamp duty holiday is being reflected in a slowdown in housing market activity but estate agents expect a shortage of supply to support prices, according to the RICS survey. Recent strength may not yet have fed through fully to the RPI housing depreciation component – the annual rise in the latter of 9.9% in July compares with a 13.2% increase in the ONS house price index in the year to June.

Assume, as a reasonable base case, that that the annual increase in the housing depreciation component moderates to 8.0% in Q4 2021 while other influences on the RPI / CPI inflation gap are stable. This would imply a decline in the gap from the current 1.8 pp to 1.6 pp. The Bank of England’s August forecast of CPI inflation of 4.0% in Q4 would then read across to RPI inflation of 5.6%.

The OBR’s March Economic and fiscal outlook projected a 2.4% rise in the RPI in the year to Q4 2021. According to its debt interest ready reckoner, a 1% rise in the RPI boosts interest costs on index-linked gilts by £4.8 billion in the following year. The suggested Q4 overshoot of 3.2 pp, therefore, implies a spending increase of £15.2 bn – or 0.6% of annual GDP – relative to Budget plans.

*House prices also feed into the mortgage interest component, as well as estate agents’ fees and ground rent.