Aerial view of downtown Taipei, Taiwan. Financial district and business area with intersection or junction with traffic.

Summary

  • EM underperformed US and international markets through 2023 – posting a 10.3% return in USD terms versus 26.3% for the US, 18.9% for EAFE and 22.7% for Europe ex-UK.
  • China was down 11% for the year, while Taiwan was up 31.3%, India 21.3%, Brazil 31.5% and Mexico 41.6%.
  • EM equities trade at 11.9x next 12m P/E against a 20-year average of 12.6x, while China trades at 9.3x against a 20-year average of 12.5x.
  • Brent crude closed the year at US$80 per barrel, pulling back sharply from its spike above US$90 in October following the outbreak of conflict between Israel and Hamas.
  • China held its Central Economic Work Conference in December, with top officials and economic advisers meeting to set growth targets for 2024. Government advisers have told the press that officials are targeting a range between 4.5% and 5.5%, with most favouring around 5% (the same as for 2023). The official target is set to be officially endorsed at the Two Sessions in March.
  • As reported in the Financial Times, BYD sold a record 526,000 battery-only EVs to Tesla’s 484,000 during the fourth quarter of 2023. This is the first time BYD has surpassed Tesla in quarterly sales.

“Goldilocks thinking”

Earlier this year, we emphasised our caution with respect to market expectations for the economy and inflation, warning that a Wile E. Coyote moment was a real risk for investors lured into the idea of a “miraculous disinflation” or “no landing” scenario. Bets on the combination of falling inflation, a resilient economy and rate cuts in 2023 were the fuel for a Santa rally propelling tech stocks and cyclicals.

In line with our forecasts, inflation has fallen rapidly as suggested by broad money growth with the usual two-year lag. What has surprised us is the resilience of the US economy despite monetary tightening, which appears partly to reflect consumption driven by savings built up during the pandemic. Improvements in the global supply chain have also supported industrial production.

G7 inflation rates fell by more than most expected during 2023, mirroring a big decline in money growth during 2021 – inflation heading for an undershoot by end 2024
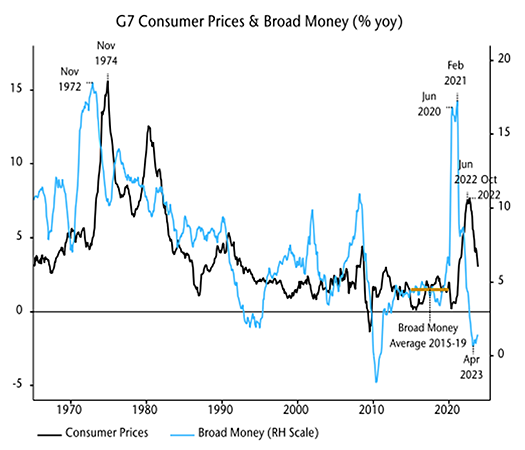
Source: NS Partners & Refinitiv Datastream.

Better inflation news has allowed the Fed to stay on hold since July despite strong Q3 GDP growth and a still-tight labour market. With inflation likely to continue to fall, investors are more hopeful of a soft landing coupled with rate cuts in 2024 and have rerated risk assets accordingly.

Based on the monetary and economic data that we track, our view is that market sentiment is excessively bullish and at risk of a correction. In his latest memo, Easy Money, published on January 9, Oaktree’s Howard Marks struck a similar tone, warning against “Goldilocks thinking”:

“At present, I believe the consensus is as follows:

  • Inflation is moving in the right direction and will soon reach the Fed’s target of roughly 2%.
  • As a consequence, additional rate increases won’t be necessary.
  • As a further consequence, we’ll have a soft landing marked by a minor recession or none at all.
  • Thus, the Fed will be able to take rates back down.
  • This will be good for the economy and the stock market.

Before going further, I want to note that, to me, these five bullet points smack of “Goldilocks thinking”: the economy won’t be hot enough to raise inflation or cold enough to bring on an economic slowdown.”

We certainly agree. While our analysis suggests that inflation has further to fall and rate cuts should be coming this year, global manufacturing PMI new orders are likely to decline further. Additionally, money trends are yet to suggest a significant subsequent recovery.

Economic “resilience” partly reflected pandemic catch-up effects, but is consistent with historical experience following monetary tightenings, suggesting greater H1 weakness
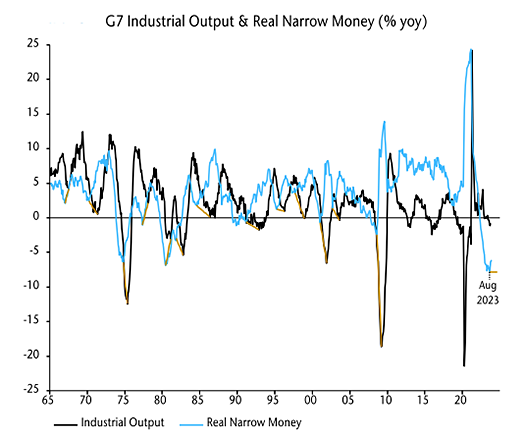
Source: NS Partners & Refinitiv Datastream.

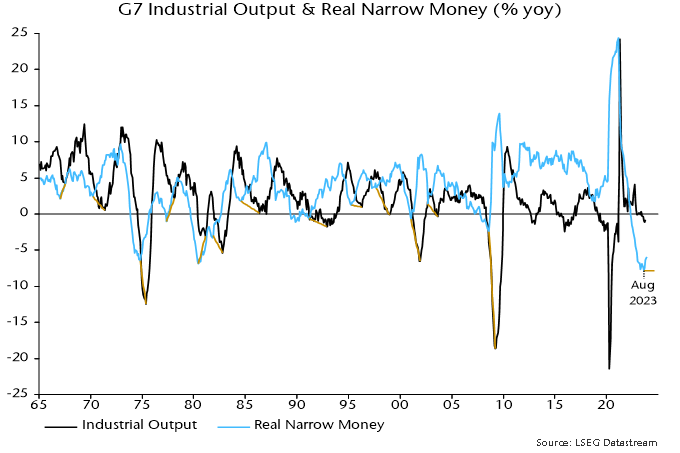
G7 annual real narrow money momentum led industrial output momentum by an average 12m at major lows historically, suggesting that the full impact of recent weakness won’t be apparent until mid-2024.

We continue to believe that hard landings are possible in the US / Europe, with resilience to date not inconsistent with historical lags for monetary weakness and yield curve inversion. Against this backdrop, we expect quality and defensive sectors to outperform in the near term on a view that hopes of a soft landing may prove to be premature.

Taiwan’s DPP returned to the presidency but lose the legislature

Taiwan held elections on January 13, with William Lai Ching-te of the Democratic Progressive Party (DPP) winning the presidency, taking 40% of the vote against 33% for Hou Yu-ih of the Kuomintang (KMT) and 26% for Ko Wen-je of the Taiwan People’s Party (TPP).

Credibility on management of cross-strait relations to safeguard Taiwan’s democracy was a key issue, and the key factor behind the DDP presidency win. However, voters (particularly younger generations) expressed their dissatisfaction with the DDP on a host of domestic issues that cost the party its hold over the legislature, now controlled by the KMT. Issues include prohibitively expensive property prices, a rapidly ageing population (see chart below), stagnant wage growth and debate over the length and quality of military conscription.

Taiwan faces demographic headwinds
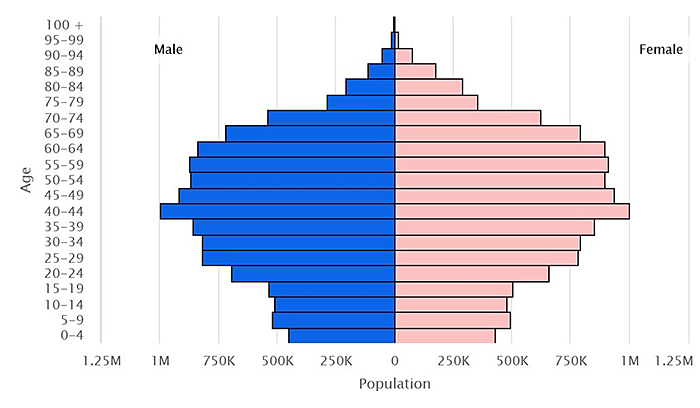
Source: CIA Factbook 2024.

In addition, a host of DPP officials have been caught up in scandals in recent years, including misuse of party funds, academic plagiarism by a legislator subsequently promoted by President Tsai to vice president of the government and an extramarital affair forcing another legislator to step down.

What does China make of it? While China has repeated the rhetoric that “reunification is inevitable”, the election result is unlikely to provoke any material military response from Beijing in the near term, although some PLA muscle-flexing is to be expected in the coming months. Predictably, the Party is claiming the result as a win from its perspective, pointing out that the result signals voter dissatisfaction in the electorate after eight years of DPP rule, with Lai’s win in part owing to Taiwan’s first past-the-post electoral system. The majority of voters went for the KMT (Beijing’s favoured candidate) and political upstart TPP.

Perhaps the most notable development was the rise of the TPP, founded less than five years ago by prominent surgeon and quirky political pragmatist Ko Wen-je. Clever rhetoric and deft use of social media was key for Ko to connect with younger voters, to foreground domestic issues in his campaign over relations with China, effectively counter-positioning with the DPP and KMT.

On China, Ko has shifted over the years from alignment with the DPP towards the KMT, arguing that Taiwan is part of a greater China while disagreeing with Beijing over which state should rule the territory.

Over the next term, Ko and his party have eight seats in the legislature, setting the TPP up as kingmaker to either the KMT with 52 seats or DPP with 51, and a pivotal player on issues such as energy policy, defence expenditure and kickstarting wage growth in the service sector.

Looking further ahead, the TPP may signal the breakdown of old, inherited voting patterns and the emerging base of young voters who identify primarily as Taiwanese but, at least for now, are more focused on domestic economic, social and political issues.

Hand flipping wooden blocks from 2023 to 2024, text on table.

L’année 2023 a débuté sous le signe de la prudence, sous l’influence principalement du contexte de marché de l’année précédente, qui avait été le théâtre de plusieurs nouveautés. En 2022, les investisseurs avaient enregistré pour la première fois des rendements négatifs importants à la fois pour les actions et les placements à revenu fixe traditionnels au cours d’une année civile. De nombreux régimes de retraite à prestations déterminées (PD) avaient également vu leur santé financière évoluer rapidement, passant d’un déficit à un excédent important malgré des conditions de marché difficiles. Les rendements ont connu un beau rebondissement en 2023, après bien des hauts et des bas. Cet article revient sur 2023 et offre des perspectives sur l’année à venir.

Des taux d’intérêt surprenants

La hausse rapide des taux d’intérêt a surpris de nombreux investisseurs, avec des conséquences variables selon les types d’investisseurs. Les investisseurs ayant un objectif de rendement total, comme les fonds de dotation, les fondations et les fiducies autochtones, ont vu la valeur marchande de leurs portefeuilles chuter en 2022, à cause des rendements négatifs à la fois des actions et des titres à revenu fixe. En revanche, en dépit des rendements négatifs des actifs, de nombreux régimes de retraite à PD ont vu leurs déficits faire place à des excédents, car la diminution du passif a dépassé la baisse des actifs.

La hausse des taux s’est traduite par des rendements plus avantageux à long terme pour les titres à revenu fixe. Alors qu’auparavant, les discussions portaient sur la réduction de la pondération des titres à revenu fixe, elles se sont tournées en 2023 vers l’évaluation des avantages qu’apporterait au contraire une pondération accrue de ces titres pour tous les types d’investisseurs.

Tour d’équilibriste

Pour les entités axées sur le rendement global, telles que les fonds de dotation, les fondations et les fiducies autochtones, l’amélioration des perspectives des titres à revenu fixe était une bonne nouvelle. Toutefois, les données historiques donnent à penser que la hausse des taux des titres à revenu fixe peut être le signe d’une baisse des rendements boursiers (voir « Le défi de la boule de cristal » ci-dessous).

Les organismes de bienfaisance enregistrés doivent composer en outre avec les conséquences de l’augmentation du contingent des versements (CV) annuel minimal, qui est passé de 3,5 à 5,0 % en 2023. Ce changement pourrait inciter les organismes de bienfaisance à viser des rendements plus élevés ou à accepter une marge de rendement supplémentaire plus faible pour répondre au CV plus élevé.

La perspective d’une hausse des rendements des titres à revenu fixe et d’une baisse potentielle des rendements boursiers a représenté pour les investisseurs une occasion de réévaluer leur stratégie de répartition de l’actif pour s’assurer qu’elle correspond à leurs objectifs, en particulier si leur pondération des titres à revenu fixe était habituellement faible ou largement en dessous de la répartition cible.

Des occasions à saisir

Début 2023, de nombreux régimes de retraite à PD ont vu leur santé financière s’améliorer grandement, après des décennies de cotisations supplémentaires pour contrebalancer les effets défavorables de la baisse des taux d’intérêt et de la croissance plus importante du passif que de l’actif en conséquence. Cette meilleure position financière a offert l’occasion de revoir les stratégies de répartition de l’actif à long terme et les niveaux de risque.

Les mesures spécifiques que les régimes de retraite à PD peuvent prendre varient en fonction du type de régime (p. ex., d’entreprise, universitaire ou public), des mesures de passif actuarielles qui dictent l’évaluation du risque, et d’autres facteurs, tels que l’ouverture ou la fermeture du régime à de nouveaux participants et l’échéance du régime (p. ex., pourcentage de participants actifs par rapport aux retraités et aux participants bénéficiant de droits différés). À tout le moins, pour les régimes dont la position de capitalisation s’était renforcée, il semblait pertinent d’aborder les avantages qu’apporterait une réduction du risque et les compromis envisageables en la matière.

Bien qu’il soit difficile de savoir dans quelle mesure les régimes de retraite à PD ont saisi cette occasion de réduire le risque et d’accroître leur pondération des titres à revenu fixe, les activités de recherche de titres à revenu fixe ont augmenté vers la fin de 2023, ce qui pourrait indiquer une tendance des comités à réévaluer leur stratégie de répartition de l’actif. Toutefois, il est évident que les marchés des titres à revenu fixe et des actions ont tous deux connu une année 2023 en dents de scie. Les taux des obligations à long terme ont grimpé davantage à la fin du troisième trimestre et au début du quatrième trimestre, avant de chuter par la suite, ce qui a entraîné une forte remontée des titres à revenu fixe à long terme, avec des rendements supérieurs à ceux des principaux marchés boursiers. Les rendements plus élevés des titres à revenu fixe sont probablement attribuables au fait que les passifs ont connu une plus forte augmentation que les actifs au quatrième trimestre, ce qui a en partie limité l’amélioration antérieure de la capitalisation des régimes de retraite à PD.

Un moyen de gestion du risque qui a encore été largement appliqué a été la réduction du risque à travers l’acquisition de rentes, en particulier dans le cas des régimes de retraite à PD d’entreprise, car cette transaction peut réduire l’incidence des régimes de retraite à PD sur les bilans d’une entreprise. Beaucoup des sociétés ayant choisi la voie de l’achat de rentes pour réduire leurs risques l’ont fait lorsque l’inflation était faible. Selon l’ampleur des augmentations des prestations de retraite liées à l’inflation, ces sociétés pourraient subir des pressions des retraités demandant des hausses ponctuelles des prestations de retraite dans le contexte actuel de forte inflation. Dans le cas du rachat d’une rente, la structure est telle qu’après la transaction, il n’y a plus de groupe d’actifs réservé auprès du promoteur du régime aux participants visés par le rachat, ce qui signifie que la seule source de financement pour les augmentations ponctuelles serait le bilan de la société.

Les titans de la technologie augmentent la concentration du marché

En 2023, les rendements boursiers ont été dominés par les actions américaines à mégacapitalisation, en particulier dans le secteur des technologies de l’information, grand bénéficiaire de l’enthousiasme des investisseurs pour l’intelligence artificielle (IA), ce qui a aggravé les problèmes de concentration de l’indice S&P 500. Comme le montre la figure 1, les dix principaux titres de l’indice S&P 500 représentaient près d’un tiers de l’indice à la fin de 2023.

Figure 1 : Pondération des dix principaux titres de l’indice S&P 500

Source : Groupe financier Connor, Clark & Lunn et S&P Global Market Intelligence.

Les actions américaines représentent généralement la composante individuelle la plus importante des portefeuilles de nombreux investisseurs. Les prochaines réunions du comité devraient inclure des discussions sur la concentration croissante du marché des actions américaines. Cela ne signifie pas que le secteur américain des technologies de l’information cessera d’enregistrer de bons résultats au cours de la prochaine décennie. Toutefois, il est prudent de tenir compte des avantages qu’apporte la diversification du portefeuille et d’évaluer les options de gestion des risques de baisse en cas de résultats négatifs.

La diversification au sein des marchés boursiers est une option, par exemple l’exploitation des qualités moins corrélées des marchés émergents par rapport à celles des marchés développés ou la combinaison d’un style de placement axé sur la valeur avec un portefeuille de croissance. Toutefois, une diversification au moyen de placements dans des titres à revenu fixe et des marchés privés peut s’avérer plus avantageuse. Ainsi, toute stratégie de diversification devrait inclure un large éventail d’occasions de placement sans se limiter aux actions.

Expériences contrastées sur les marchés privés

Au cours des 10 dernières années environ, les marchés privés ont enregistré d’importantes entrées de fonds en provenance des investisseurs institutionnels. En 2023, les rendements ont été contrastés entre les différents marchés privés. L’immobilier commercial a fait couler de l’encre pour deux raisons. Tout d’abord, les conséquences persistantes de la pandémie de COVID-19 sur le secteur des immeubles de bureaux ont entraîné une baisse des valorisations boursières. Deuxièmement, certains gestionnaires immobiliers commerciaux ont connu des problèmes de liquidité, ce qui a retardé les demandes de désinvestissement. Les autres secteurs de l’immobilier se sont bien comportés, ce qui a permis de compenser le recul du secteur des immeubles de bureaux dans les portefeuilles diversifiés et d’améliorer les perspectives du marché pour 2024 et à long terme.

Les marchés des actions de sociétés fermées ont aussi connu des difficultés en 2022-2023, mais les prévisions pour 2024 et au-delà sont beaucoup plus positives. En revanche, le marché des infrastructures a enregistré des résultats remarquables en 2023 et semble bien positionné pour l’avenir. Les infrastructures sont de plus en plus considérées comme essentielles pour soutenir les projets d’énergie propre et réduire la dépendance aux actifs à forte intensité carbone, dans le cadre des efforts mondiaux pour faire face au risque climatique. La réussite de la transition énergétique demandera de nouvelles infrastructures, basées sur des sources d’énergie renouvelable, partout dans le monde.

Le défi de la boule de cristal

Il n’est pas facile de prévoir les rendements. Par exemple, un sondage mené par Horizon Actuarial Services auprès de gestionnaires et de consultants en placement américains a révélé qu’ils avaient considérablement sous-estimé la vigueur du marché boursier américain pour la période de 10 ans terminée le 31 décembre 2022, et qu’au contraire, ils avaient surestimé les rendements plus faibles des marchés émergents. Les prévisions de rendement annualisé moyen des actions américaines s’élevaient à 5,9 %, alors que leur rendement réel a été de 12,6 %. Quant aux actions des marchés émergents, leur rendement prévu était de 7,5 %, mais elles n’ont affiché un rendement que de 1,8 % (tous les rendements sont en dollars américains).

Il y a toutefois une corrélation historique entre les taux de rendement et les perspectives de rendement des marchés boursiers. La figure 2 illustre la distribution des rendements historiques sur 10 ans de l’indice S&P 500. Les barres vertes représentent les moments où les taux des obligations du gouvernement américain à 10 ans étaient inférieurs à 3,5 % au début de la période de 10 ans, tandis que les barres dorées indiquent les rendements lorsque les taux initiaux étaient entre 3,5 % et 5 %. Par exemple, lorsque les taux étaient inférieurs à 3,5 %, environ 20 % des rendements se situaient autour de 17,5 %. Le rendement annualisé moyen global de l’indice S&P 500 lorsque les taux étaient inférieurs à 3,5 % était de 10,8 %. À l’inverse, lorsque les taux étaient plus élevés, comme tels de la fin de 2023, le rendement annualisé moyen de l’indice était de 6,7 %.

Figure 2 : Rendements des actions américaines selon le niveau des taux des titres à revenu fixe

Rendements annualisés des actions sur 10 ans

Source : Groupe financier Connor, Clark & Lunn.

Malgré la récente baisse des taux, les prévisions de rendement à long terme des titres à revenu fixe demeurent plus élevées que ce que nous avons observé depuis un certain temps. Le niveau des taux au moment de la rédaction du présent article indique également la possibilité d’une baisse des rendements boursiers à long terme par rapport aux hautes performances antérieures.

En ce qui concerne les marchés privés, il est difficile d’établir des généralités, car les perspectives dépendent fortement de la stratégie de placement spécifique. Il est donc important de communiquer avec vos gestionnaires de marché privé pour comprendre leurs prévisions de rendement et évaluer le risque de contraintes de liquidité, telles que celles récemment observées dans certaines stratégies d’immobilier commercial.

Sur d’autres marchés privés, comme celui de la dette privée, le contexte actuel a probablement favorisé le potentiel de rendement relatif, ce qui pourrait susciter un intérêt accru de la part de tous les types d’investisseurs. Comme nous l’avons mentionné plus tôt, l’accent mis sur la transition énergétique pour faire face au risque climatique devrait stimuler l’intérêt pour les stratégies d’infrastructures énergétiques spécialisées. Les conditions sont également réunies aujourd’hui pour envisager des actifs plus liquides et à rendement plus élevé, comme les prêts hypothécaires commerciaux, qui peuvent profiter de la hausse actuelle des taux.

2024 : Garder le cap en période d’incertitude

Au moment d’examiner les résultats de 2023, votre comité accueillera probablement avec soulagement les solides rendements totaux positifs du portefeuille. Le quatrième trimestre a rappelé aux régimes de retraite à PD envisageant une stratégie de réduction du risque que l’occasion de tirer parti d’une situation financière plus saine ne durerait pas indéfiniment et que sous certains scénarios, la baisse des taux de rendement (et une augmentation subséquente du passif) pourrait l’emporter.

Le marché ayant enregistré les meilleures performances en 2023 a été celui des actions américaines à grande capitalisation, qui a profité de l’enthousiasme suscité par l’IA. Même si les répercussions positives de l’innovation technologique pourraient durer, cela se jouera dans un contexte économique, social et politique difficile, avec des incertitudes connexes. Les risques géopolitiques, y compris les élections américaines, les conflits au Moyen-Orient et en Europe, et la rivalité sino-américaine, pourraient avoir des répercussions importantes sur les perspectives à court terme des marchés en 2024.

Eu égard aux diverses dynamiques soulignées, assurez-vous que la question de savoir si votre profil risque-rendement est en phase avec vos objectifs soit bien abordée lors des réunions du comité.

Abonnez-vous aux mises à jour

The money and cycles forecasting approach suggested that global inflation would fall rapidly during 2023 but at the expense of significant economic weakness. The inflation forecast played out but activity proved more resilient than expected. What are the implications for the coming year?

One school of thought is that economic resilience will limit further inflation progress, resulting in central banks disappointing end-2023 market expectations for rate cuts, with negative implications for growth prospects for late 2024 / 2025.

A second scenario, favoured here, is that the economic impact of monetary tightening has been delayed rather than avoided, and a further inflation fall during H1 2024 will be accompanied by significant activity and labour market weakness, with corresponding underperformance of cyclical assets.

The dominant market view, by contrast, is that further inflation progress will allow central banks to ease pre-emptively and sufficiently to avoid material near-term weakness and lay the foundation for economic acceleration into 2025.

On the analysis here, the second scenario might warrant a two-thirds probability weighting versus one-sixth for the first and third. This assessment reflects several considerations.

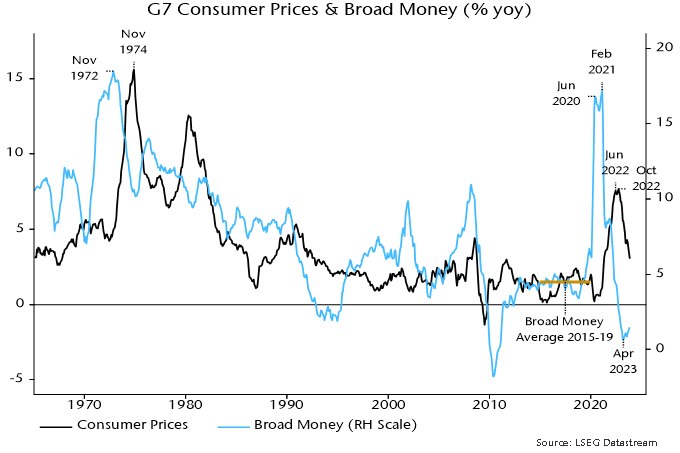
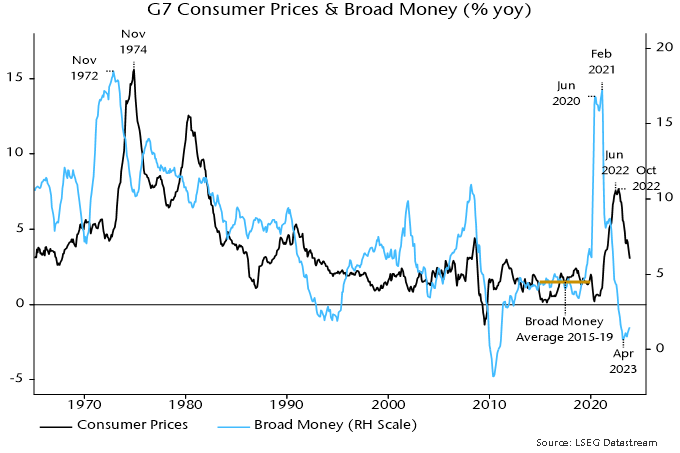
First, on inflation, developments continue to play out in line with the simplistic “monetarist” proposition of a two-year lead from money to prices. G7 annual broad money growth formed a double top between June 2020 and February 2021 – mid-point October 2020 – and declined rapidly thereafter. Annual CPI inflation peaked in October 2022, falling by 60% by November 2023 – chart 1.

Chart 1

Chart 1 showing G7 Consumer Prices & Broad Money (% yoy)

Broad money growth returned to its pre-pandemic average in mid-2022 and continued to decline into early 2023. The suggestion is that inflation rates will return to targets by H2 2024 with a subsequent undershoot and no sustained revival before mid-2025.

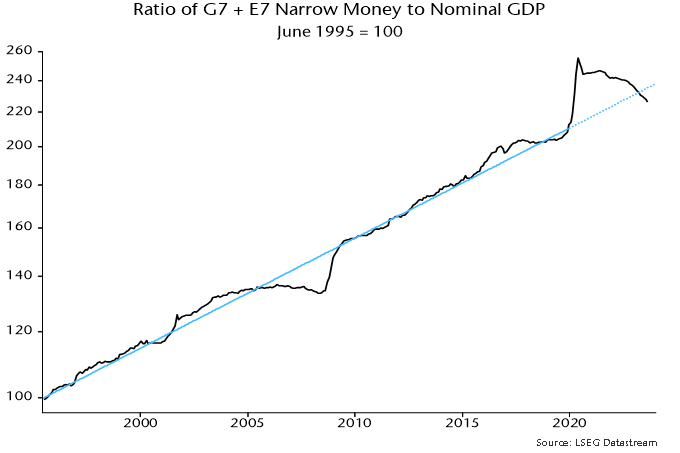
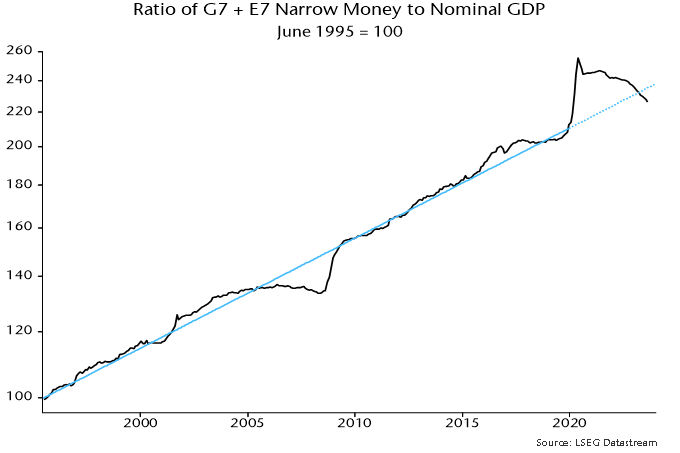
Secondly, economic resilience in 2023 partly reflected post-pandemic demand / supply catch-up effects. On the demand side, an analytical mistake here was to downplay the supportive potential of an overhang of “excess” money balances following the 2020-21 monetary explosion. Globally, this excess stock has probably now been eliminated – chart 2.

Chart 2

Chart 2 showing Ratio of G7 + E7 Narrow Money to Nominal GDP June 1995 = 100

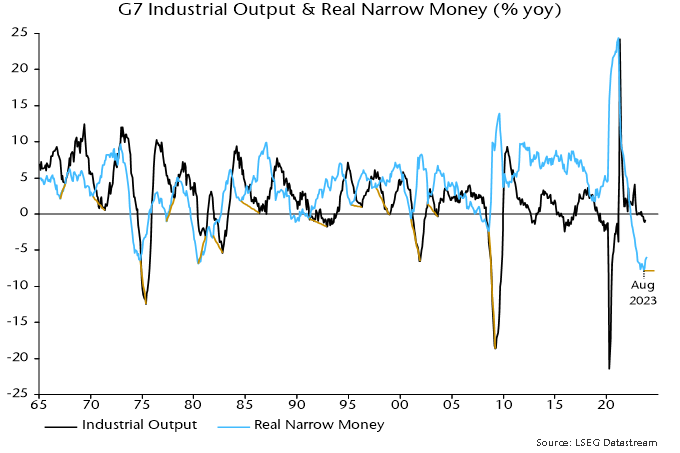
The moderate economic impact of monetary tightening to date, moreover, is consistent with historical experience. Major lows in G7 annual real narrow money momentum led lows in industrial output momentum by an average 12 months historically – chart 3. With a trough in the former reached as recently as August 2023, economic fall-out may not be fully apparent until H2 2024.

Chart 3

Chart 3 showing G7 Industrial Output & Real Narrow Money (% yoy)

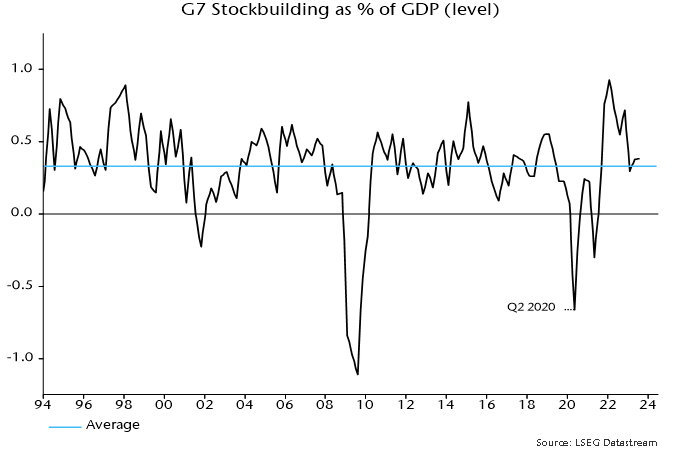
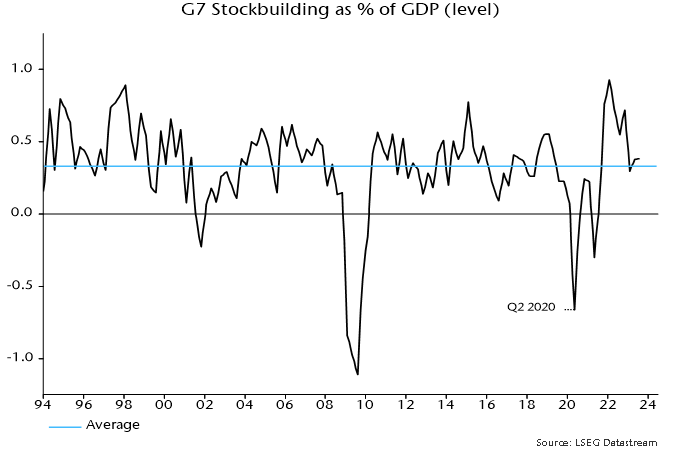
The suggestion that economic downside is incomplete is supported by a revised assessment of cyclical influences. The previous hypothesis here was that the global stockbuilding cycle would bottom out in late 2023 and recover during 2024. Recent stockbuilding data, however, appear to signal that the cycle has extended, with a recovery pushed back until H2 2024.

The assumption of a late 2023 trough was based on a previous low in Q2 2020 and the average historical cycle length of 3 1/3 years. This seemed on track at mid-2023: G7 stockbuilding had crossed below its long-run average in Q1, consistent with a trough-compatible level being reached in H2 – chart 4. The downswing, however, was interrupted in Q2 / Q3, with a further decline likely to be necessary to complete the cycle and form the basis for a recovery.

Chart 4

Chart 4 showing G7 Stockbuilding as % of GDP (level)

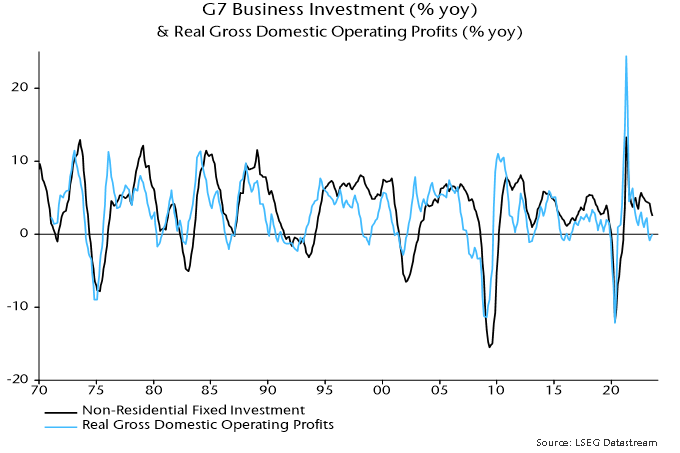
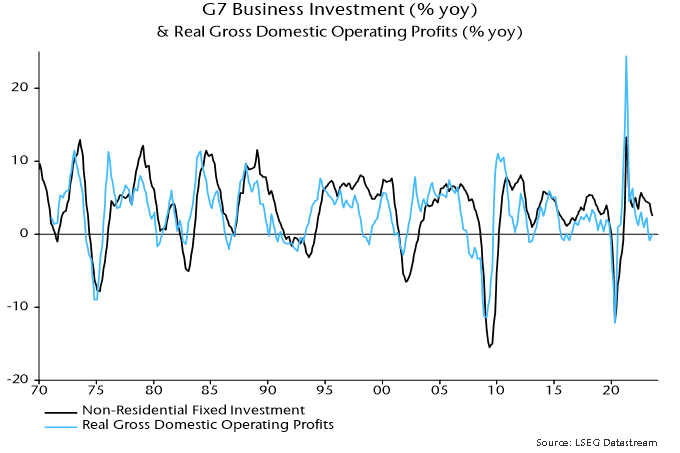
A resumed drag from stockbuilding may be accompanied by a further slowdown or outright weakness in business investment, reflecting recent stagnation in real profits – chart 5. Capex is closely correlated with hiring decisions, so this also argues for a faster loosening of labour market conditions.

Chart 5

Chart 5 showing G7 Business Investment (% yoy) & Real Gross Domestic Operating Profits (% yoy)

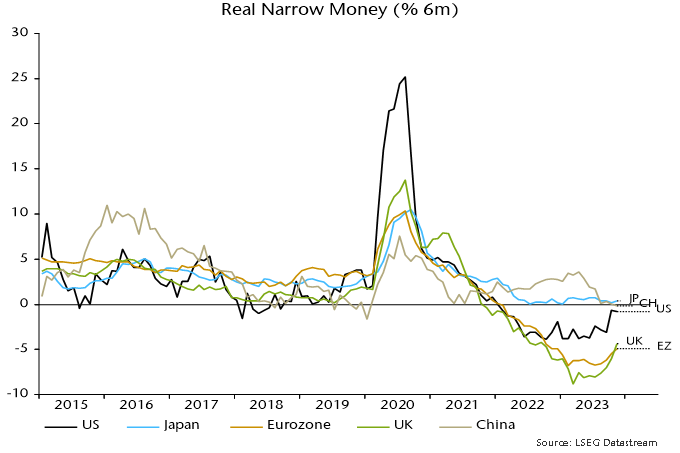
Real narrow money momentum remains weaker in Europe than the US, suggesting continued economic underperformance and a more urgent need for policy relaxation – chart 6. Six-month rates of change are off the lows but need to rise significantly to warrant H2 recovery hopes. Globally, the US / European revivals have been partly offset by a further slowdown in China, suggesting still-weakening economic prospects.

Chart 6

Chart 6 showing Real Narrow Money (% 6m)

The frenetic rally of the final two months resulted in global equities delivering a strong return during 2023 despite the two “excess” money indicators tracked here* remaining negative throughout the year. The indicators, however, started flashing red around end-2021, since when the MSCI World index has slightly underperformed US dollar cash.

Historically (i.e. since 1970), equities outperformed cash on average only when both indicators were positive, a condition unlikely to be met until mid-2024 at the earliest.

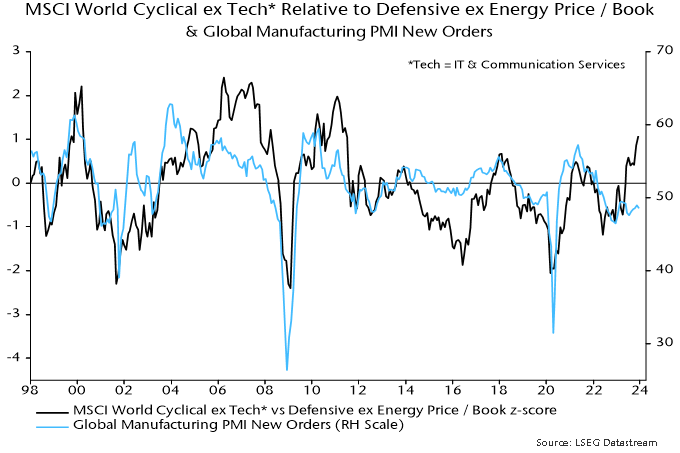
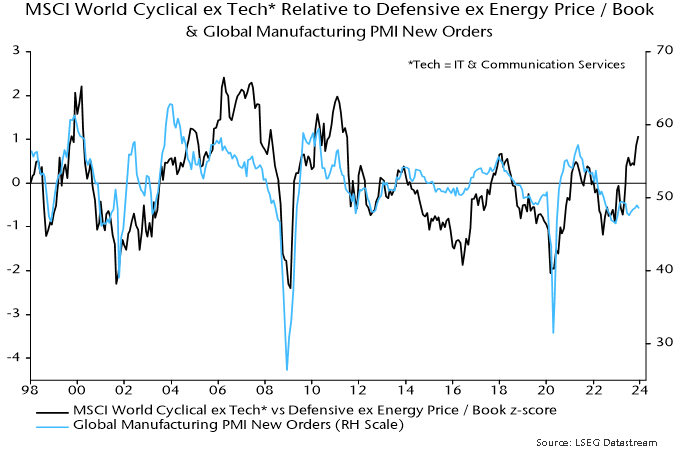
The late 2023 rally was led by cyclical sectors as investors embraced a “soft landing” scenario. Non-tech cyclical sectors ended the year more than one standard deviation expensive relative to history versus defensive ex. energy sectors on a price / book basis – chart 7. Current prices appear to discount an early / strong PMI recovery, which the earlier discussion suggests is unlikely.

Chart 7

Chart 7 showing MSCI World Cyclical ex Tech* Relative to Defensive ex Energy Price / Book & Global Manufacturing PMI New Orders *Tech = IT & Communication Services

Quality stocks outperformed during 2023, reversing a relative loss in 2022 and consistent with the historical tendency when “excess” money readings were negative. Earlier underperformance partly reflected an inverse correlation with Treasury yields, a relationship now suggesting further catch-up potential.

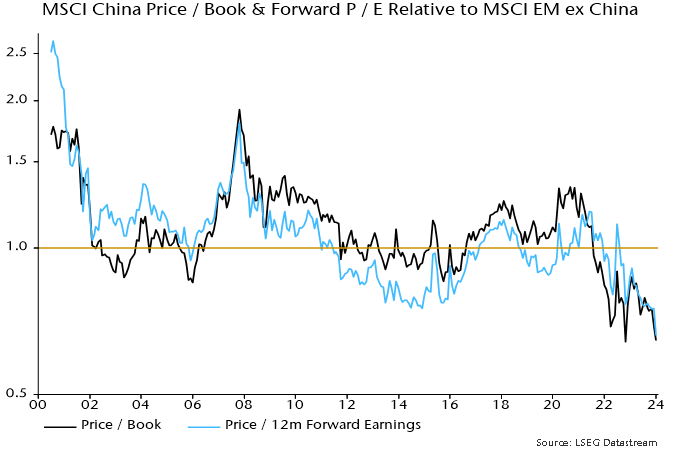
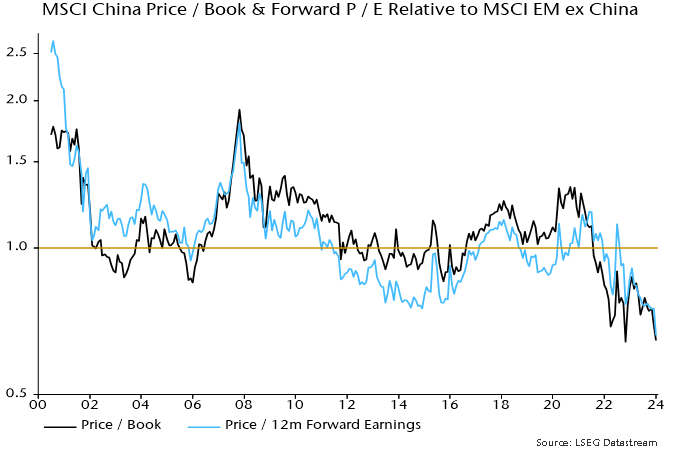
Contributing factors to the dramatic underperformance of Chinese stocks during 2023 include excessively optimistic post-reopening economic expectations at end-2022 and unexpectedly restrictive monetary / fiscal policies. MSCI China is at a record** valuation discount to the rest of EM – chart 8 – while monetary / economic weakness suggests an early policy pivot.

Chart 8

Chart 8 showing MSCI China Price / Book & Forward P / E Relative to MSCI EM ex China

A key issue for 2024 is the extent to which central bank policy easing will revive money growth. While inflation is expected to trend lower into early 2025, the cycles framework suggests another upswing later this decade – the 54-year Kondratyev price / inflation cycle last peaked in 1974. Aggressive Fed easing 54 years ago – in 1970 – pushed annual broad money growth into double-digits the following year, creating the conditions for the final Kondratyev ascent. Signs that a similar scenario is playing out would warrant adding to inflation hedges.

*The differential between G7 plus E7 six-month real narrow money and industrial output momentum and the deviation of 12-month real narrow money momentum from a long-term moving average.

**Since June 2000. MSCI China included only B-shares through May 2000, when red chips and H-shares were added.

Corporate businesspeople shaking hands in an office.

Recent market movements have been driven by a decline in bond yields and a repricing of a more optimistic scenario, where growth is resilient and inflation figures are falling fast. While mid-term trends look supportive, persistently high inflation could point to later interest rate cuts than markets currently expect.

Small caps shine in Europe

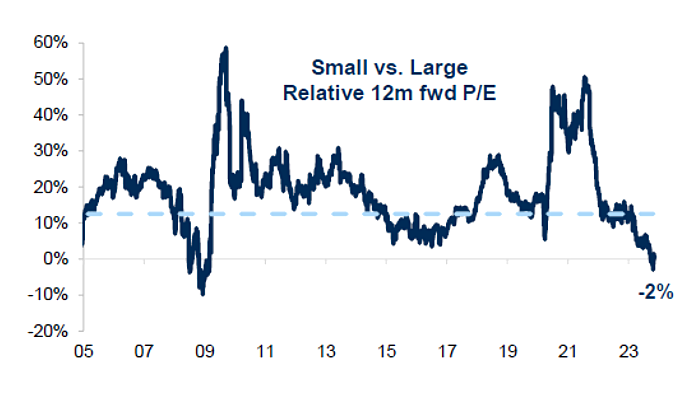
We believe that growth will remain steady in 2024 despite potential economic contractions in some regions during the first half of the year. European small caps continue to look attractive compared to their larger counterparts. As illustrated below, small caps are near their largest historical discount relative to large caps. Several industries still trade at very low valuations and could benefit from a potential re-rating. We believe the end of the destocking phase combined with lower interest rates should help in regaining momentum for European small caps.

P/E of STOXX small caps vs STOXX large caps

Source: Goldman Sachs.

Wage growth: a silver lining

Real wage growth is another indicator showing positive signs. An increase in wage growth could be beneficial for consumers and the broader economy. Companies’ responses to growing labour costs will be a key determinant for financial markets in 2024. Companies with strong pricing power should be able to raise prices again. Others might scale back labour, cut investments or accept lower profits. In summary, we expect earnings growth to be erratic and modest in 2024.

Factor investing in a dry liquidity climate

Regarding factor investing, liquidity has dried up in 2023 and small caps are underinvested in compared with other asset classes. According to JP Morgan, small caps in Europe have experienced their worst 23-month outflows in the last 15 years. However, November’s positive inflows may indicate a shift toward a more optimistic sentiment. A return to more normalized monetary policy should gradually improve liquidity and investment flows during 2024. Much like the adage “cash is king,” investors are likely to continue rewarding companies with decent dividends and buybacks.

M&A: the untapped potential for small caps

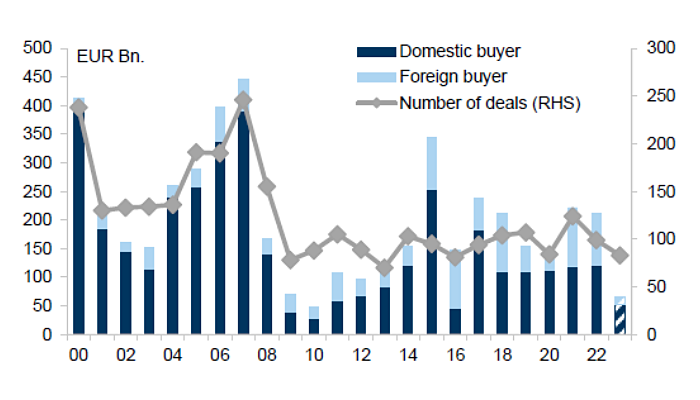
M&A activity is another potential catalyst that would favour smaller companies. M&A in 2023 has been low, as shown by the chart below, with a 70% decrease primarily due to fewer foreign buyers. Corporate sentiment, equity valuations and monetary conditions are key drivers of M&A activity. Reasonable equity valuations along with a normalizing monetary policy should enhance corporate sentiment toward M&A. With positive sentiment and plenty of balance sheet resources, a potential pickup in M&A could greatly benefit smaller companies.

Sources: Goldman Sachs, Bloomberg.

Navigating tomorrow’s market

As small caps gain traction and M&A activity hints at resurgence, the market presents a complex puzzle. The real insight emerges in piecing together these fragments to understand where the next wave of growth will come from.

New house under construction is insulated with spray foam.

As winter approaches, homeowners are confronted with the need to turn on their heating systems and the higher costs of additional heating. This winter, many US consumers will likely pay even more to heat their homes because of surging fuel prices and colder weather forecasts.

The National Energy Assistance Directors Association predicts increased winter heating expenditures across the board, with electricity up 1.2%, propane 4.2% and heating oil 8.7%. Natural gas is expected to be down 7.8%. Air conditioning and heating are by far the biggest sources of home energy use, comprising 51% of household energy bills. A main reason energy bills spike in winter is due to inadequate insulation.

This is where Installed Building Products (IBP) comes in – and why we’ve invested in this company. This week, we’ll share insights into our investment process and approach to selecting companies like IBP that we believe are poised to generate shareholder value.

Who is Installed Building Products (IBP)?

Founded in 1977 and based in Columbus, Ohio, IBP is one of the largest insulation installers in the US. In the late 1990s, the company embarked on an ambitious acquisition strategy to expand its reach nationally. IBP went public in 2014, at which point it was generating $432 million in revenue with earnings of 2 cents a share. Last year, its revenue reached $2.6 billion with adjusted earnings of $8.95 per share.

Besides insulation, which makes up 60% of its revenue, IBP has diversified into complementary building products (waterproofing, fireproofing, garage doors, rain gutters and more) for both the residential and commercial construction markets.

Target market

  • Combined single family and multifamily insulation market has a ~$6 billion total addressable market (TAM).
  • Complementary products add another $4 billion TAM ($1.4 billion for garage doors, $1.1 billion for shower shelving and mirrors, $800 million for window blinds and $700 million for gutters).
  • Amount of insulation per home is increasing due to a greater focus on energy efficiency and stricter energy codes.
  • IBP’s largest competitor is TopBuild (they each rank #1 or #2 in different markets).

IBP has a cost advantage

Industry suppliers lack power. The fiberglass insulation manufacturing industry is highly consolidated, with four players accounting for all sales (Owens Cornings 40%, CertainTeed 20%, Knauf 20%, Johns Manville 20%). While the supplier concentration would suggest high pricing power, insulation manufacturing is a capital-intensive business with high fixed costs. Ovens cannot be easily shut on and off. As a result, manufacturers are incentivized to run their lines at high capacity to cover their fixed costs and get leverage. This makes the industry more competitive despite its concentration. Given IBP’s scale, it can buy insulation foam at a larger discount than smaller competitors and save big on costs.

IBP’s growth strategy

  • Organic growth is achieved through increasing penetration in developing markets.
  • On average, an established IBP branch generates ~$4,400 per residential permit versus $2,200 for a new developing branch.
  • Inorganic – M&A is part of IBP’s expansion story and it aims to acquire ~$100 million of revenue annually.

Strengths

  • Leading positions in insulation installation, with a 28% market share up from 5% in 2005.
  • M&A has been a part of its growth strategy since 1990.
  • Scale = ability to buy product cheaper than smaller competitors.

Weaknesses

  • Distribution arm is relatively small when compared to peer TopBuild.
  • No centralized ERP = branches could be competing for the same business.
  • Complementary products have lower margin due to current lack of scale.

Opportunities

  • Complementary products.
  • Capacity to penetrate developing markets.
  • Increasing residential building codes = higher revenue per unit.

Threats

  • Weakness in US residential markets.
  • Current supply constraints cap organic growth.
  • Supply shortage (COVID-19 period) or explosion/fire at a supplier plant (2018) can temporarily increase cost of raw material.

IBP management

IBP’s management, led by CEO Jeff Edwards since 2004, is a key part of the business’s success. Edwards, who joined the company in 1994 and became chairman in 1999, is one of its largest shareholders.

When we first spoke to Jeff and he walked us through how he built the business, we quickly realized he was a visionary leader with a solid plan for future growth.

He told us how he saw potential in the niche sideline of foam insulation. His rational was simple: every home, every building, needs insulation. He was not looking to reinvent the industry, but rather focused on delivering the best service to builders while acquiring successful businesses in various cities. The sales pitch to targets was also simple: being part of IBP means they can do what they like and not be bogged down by functions that aren’t core to their business, like insurance, human resources, accounting and payroll.

In 1994, IBP made its first acquisition with Freedom Construction in Columbus, Ohio, followed by several more in the ensuing years. The rest as they say is history.

Unseen value beyond the walls

Investment potential often lies hidden in plain sight, like the insulation in our walls. IBP has all the characteristics we look for in an investment: a small-cap company with what we believe to be tremendous growth potential with low debt, rapid revenue and earnings growth compared to its industry, and strong management.

Insulation may not be exciting, but not only does it conserve energy and reduce bills, it also represents a notable sector in our investment landscape. How often do investors overlook the potential in the ordinary and what opportunities might we uncover by paying closer attention to what others may miss?

 Buenos Aires Financial District.

Summary

  • Treasury yields retreated through the month on inflation data that undershot market expectations (in line with our forecasts), with stocks and bonds celebrating the news.
  • We remain cautious and view the exuberance with scepticism, and expect a weakening global economy and earnings downgrades to test the bulls.
  • On a brighter note, rapid disinflation and the prospect of rate cuts in 2024 will precipitate a recovery in money numbers that could be the signal to tilt away from current defensive positioning.

Institutional quality is key to unlocking development

Analysis of qualitative macro factors in emerging markets is a cornerstone of our process, which is critical to identifying the potential for downside shocks that can wipe out investor returns (irrespective of how attractive a company’s fundamentals may appear). Given the relative fragility of institutions in EM, politics can have an outsized impact on a country’s progress up (or down) the development ladder, with elections often serving as critical junctures.

This month we saw the conclusion of national elections in Argentina, with right-wing libertarian and economist Javier Milei crushing the incumbent Perónists on a platform of radical economic reform. While markets have celebrated the development, does Milei’s election truly represent a structural turning point given the institutional forces that stand in his way?

Argentina a case study of the vicious cycle

A hundred years ago, Argentina was one of the richest countries on the planet, with the young and dynamic South American country outstripping the likes of even France and Germany. The rise and dominance of the left-wing populist Perónists in the 20th and 21st centuries (interrupted by a succession of military juntas in the 1970s and 80s) put an end to this.

For us, Argentina’s downward spiral from such an enviable position to today underlies the importance of institutional quality as the key determinant of whether a country climbs or slides down the development ladder. Vicious and virtuous circles of development (where political and economic institutions become either more extractive or inclusive) can form momentum that is hard to break. For EM investors in particular, who deal with countries with relatively more fragile institutions than DM counterparts, it pays to be mindful of what kind of cycle is at play in a country.

The book “Why Nations Fail” by Acemoglu and Robinson provides an excellent summary of these vicious/virtuous circles:

“Rich nations are rich largely because they managed to develop inclusive institutions at some point during the past three hundred years. These institutions have persisted through a process of virtuous circles. Even if inclusive in a limited sense to begin with, and sometimes fragile, they generated dynamics that would create a process of positive feedback, gradually increasing their inclusiveness. England did not become a democracy after the Glorious Revolution in 1688. Far from it. Only a small fraction of the population had formal representation, but crucially, she was pluralistic. Once pluralism was enshrined, there was a tendency for institutions to become more inclusive over time, even if this was rocky and uncertain process.” (Why Nations Fail, p364)

Clearly nothing of the sort occurred in Argentina over the last century. Instead, a confluence of economic and political crises from the 1930s onwards saw the country follow nearly half a century of growth with a lapse into domestic upheaval, the rise of Perónism and extreme political choices that fuelled a vicious circle causing Argentina to backslide.

Rise of the Perónists

While it is possible for countries to grow under extractive institutions, this will begin to falter at more advanced levels of development. Improving institutional quality is essential to break through to the next level.

“It is true that Argentina experienced around fifty years of economic growth, but this was a classic case of growth under extractive institutions. Argentina was then ruled by a narrow elite heavily invested in their agricultural export economy … [involving] no creative destruction and no innovation. And it was not sustainable.” (Why Nations Fail, p385)

Becoming Minister of Labour in 1943 following a military coup, Juan Domingo Perón was elected president in 1946. He then set about attacking Argentina’s institutions much as the previous military junta had done before him. He started by gutting the Supreme Court to remove any checks to his power, and sidelined the main opposition party by arresting its leader. The Perónists emerged as a new elite which shaped extractive institutions to their benefit.

“The Perónists won elections thanks to a huge political machine, which succeeded by buying votes, dispensing patronage, and engaging in corruption, including government contracts and jobs in exchange for political support. In a sense this was a democracy, but it was not pluralistic. Power was highly concentrated in the Perónist Party, which faced few constraints on what it could do, at least in the period when the military restrained from throwing it from power.” (Why Nations Fail, p385)

Is Milei’s election a critical juncture?

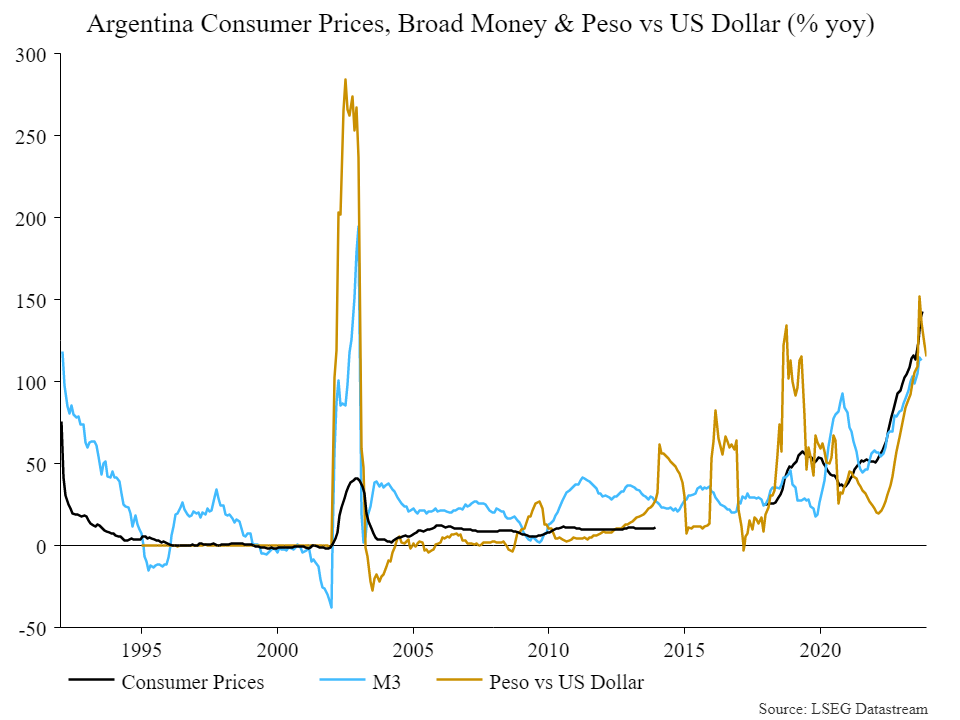
Following 28 of the last 40 years under Perónist rule, the country today battles its worst economic crisis in two decades as inflation spirals, poverty rates climb and – in the words of President-elect Javier Milei – the peso “melts like ice cubes in the Sahara.” Such is public frustration for perpetual economic catastrophe that Argentinian voters dumped the incumbents for libertarian rockstar economist Milei, who attracted 56% of the second-round vote, the most votes garnered by any candidate since 1983.

Argentina Consumer Prices, Broad Money & Peso vs. US Dollar (% yoy).

Source: NS Partners & LSEG Datastream

Milei campaigned on the promise of radical change and economic shock therapy. This includes dollarising the economy and eliminating the politicised central bank, putting the “chainsaw” to public spending, privatising state-owned companies, along with a host of controversial conservative social and libertarian reforms. Clearly, breaking the vicious cycle in play in Argentina will require radical policy change. Well implemented dollarisation could indeed work (with a deep recession) to restore economic order, working to reduce inflation, increase consumer buying power, and stabilise the economy in a way that enables better long-term economic planning while attracting foreign investment.

This sounds great in theory and markets have cheered the election results, but can Milei actually translate his victory into policy that passes through parliament when his party holds just 39 of 257 seats in the lower house and 8 of 72 in the senate? An alliance with centre-right former president Macri and his Republican Proposal party still won’t constitute a governing majority, but it will boost the chances of pushing through the reform agenda. For this to happen, however, it is likely that compromises will need to be made with Macri’s moderates and other neutrals. Will Milei, a libertarian firebrand who has gained so much popularity from demonising the political elite, be able to stomach a watered-down agenda?

How do we implement development theory in EM investing?

Our approach to macro analysis is not to place bets on such uncertain outcomes, but instead to assess the direction of travel and mark conviction in that country up or down accordingly. If Milei can beat the odds, then Argentina may gradually emerge as a hunting ground for investment opportunities.

For now, the reality is that powerful structural forces suffocate the country’s potential and make for a fragile environment that can easily wipe out investors lacking a robust approach to accounting for macro risk.

Photo of White River hydro project
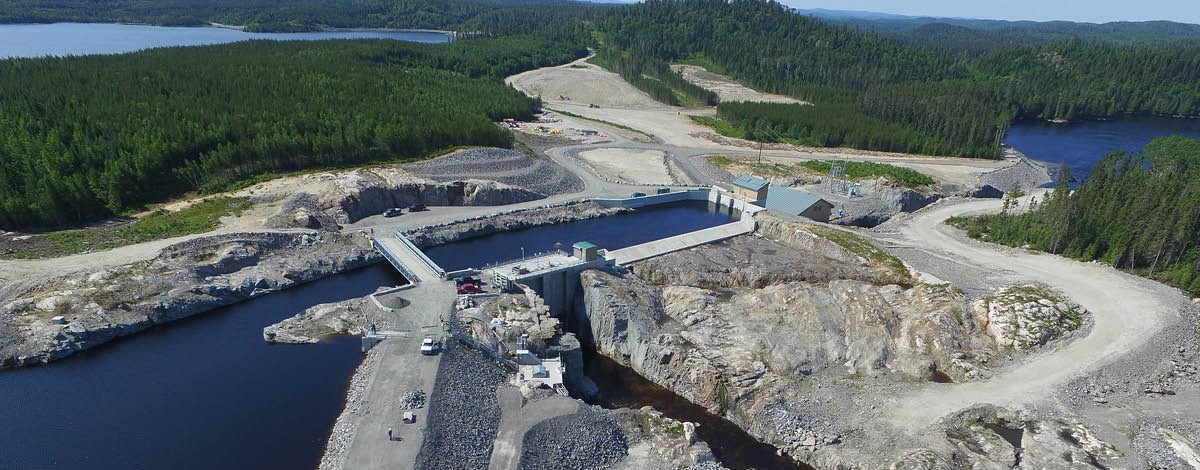
White River Hydro Project, Ontario, Canada

Une occasion de favoriser les avantages mutuels et de soutenir le développement durable

Cet article a été initialement publié dans le numéro 33 du Journal of Aboriginal Management (JAM), dans le thème Infrastructures : Bâtir un avenir meilleur.


La participation des Autochtones dans des projets d’infrastructures favorise l’autonomisation économique des communautés tout en contribuant à la réussite et à la durabilité globales des projets. Dans cet article, nous examinons certaines des façons dont les communautés autochtones peuvent participer aux investissements en infrastructures et nous soulignons les avantages que de tels partenariats peuvent créer.

L’investissement responsable nécessite la mobilisation inclusive des parties prenantes

Les projets d’infrastructures sont généralement des actifs corporels à grande échelle qui répondent à un besoin humain de base. Ces actifs sont essentiels au bien-être des communautés et au bon fonctionnement des économies locales. Les infrastructures englobent des projets comme les routes, les ponts, les écoles, les hôpitaux, la distribution et le traitement de l’eau, ainsi que la production et le transport d’électricité. L’aménagement et la construction de ces actifs nécessitent des investissements importants et l’apport de nombreuses parties prenantes. L’importance des projets d’infrastructure pour les communautés, leur nature à long terme et leur taille exigent une approche de placement responsable pour garantir et maintenir un permis social d’exploitation.

La mobilisation des parties prenantes joue un rôle crucial, car elle fait en sorte que les placements intègrent un large éventail de perspectives et produisent des résultats positifs. En fin de compte, l’investissement responsable consiste à produire des rendements financiers tout en tenant compte de l’incidence plus générale sur la société et l’environnement. Une approche inclusive de la mobilisation est essentielle pour garantir que toutes les parties concernées sont consultées.

On reconnaît de plus en plus l’importance d’inclure les peuples autochtones en tant que parties prenantes essentielles dans les projets d’infrastructures, en veillant à ce que leurs droits, leur patrimoine culturel et leurs intérêts économiques soient respectés et soutenus. Cela est particulièrement important dans des pays comme le Canada, où de nombreux projets d’infrastructures ont un impact direct sur les terres et les territoires des Autochtones, ainsi que sur leurs peuples et leurs communautés.

Cette sensibilisation accrue, combinée à une plus grande volonté d’inclusivité de la part des gouvernements et des entreprises, devrait contribuer à accroître la participation des Autochtones à l’aménagement responsable de nouveaux projets d’infrastructures durables au Canada. Toutefois, il est important que ces efforts soient axés sur le désir d’une véritable compréhension des points de vue et des priorités des Autochtones, ainsi que sur l’établissement d’une relation authentique qui vise à atteindre un avantage mutuel. Une telle approche favorise la transparence tout en encourageant la collaboration et la recherche de consensus, qui peuvent améliorer la prise de décisions et les résultats.

La collaboration favorise les avantages mutuels et le développement durable

Les partenariats positifs offrent une voie prometteuse vers des occasions d’investissement plus inclusives qui facilitent l’autonomisation économique des communautés autochtones et appuient l’aménagement, la construction et l’exploitation de projets d’infrastructures durables et de grande qualité.

La participation accrue des Autochtones peut contribuer aux efforts de réconciliation en encourageant le développement des entreprises autochtones, l’autodétermination et des résultats socioéconomiques positifs. Les flux de trésorerie réguliers générés par les investissements en infrastructures peuvent fournir aux partenaires autochtones des fonds pour répondre à un grand nombre d’objectifs : logement, soins de santé, éducation, installations récréatives, centres communautaires, développement économique, revitalisation culturelle, ou tout ce que la communauté valorise et priorise.

La mobilisation des communautés autochtones contribue également à protéger la valeur des investissements dans les infrastructures : elle atténue certains risques, permet d’éviter ou de résoudre promptement les conflits et les problèmes juridiques et rend l’aménagement et l’exploitation des projets plus fluides et efficaces.

Scott Munro, chef de la direction adjoint du Conseil de gestion financière des Premières Nations, l’a bien souligné dans son article sur l’évolution des normes ESG (JAM 32) : « La manière dont une entreprise prend en compte et respecte les droits des Autochtones déterminera l’impact sur sa valeur d’entreprise. Si l’entreprise ne peut montrer aux investisseurs et aux prêteurs qu’elle a obtenu le consentement libre, préalable et éclairé des peuples autochtones touchés par un projet, aussi bien intentionné et avantageux qu’il soit, le conflit sera inévitable. Le projet pourrait être retardé ou prêter le flanc à un litige coûteux, et l’entreprise fera face à une atteinte à sa réputation et à des actionnaires mécontents. »

En plus d’atténuer certains des risques associés aux projets d’infrastructures, la participation active des communautés autochtones dès les premières étapes de la planification des projets apporte des connaissances et des perspectives locales précieuses. Les communautés autochtones connaissent très bien leurs terres, leurs ressources et leurs pratiques traditionnelles. Ces perspectives contribuent à améliorer la conception des projets, à approfondir les connaissances dans les domaines d’importance archéologique, à gérer durablement les ressources, à préserver la biodiversité et à réaliser des évaluations d’impact environnemental plus robustes, tout en favorisant une surveillance et un entretien efficaces de l’environnement.

La collaboration accroît la durabilité des projets et renforce les efforts d’intendance en intégrant les perspectives et les pratiques autochtones qui se sont avérées respectueuses de l’environnement et résilientes au fil des générations. Elle peut mener à des résultats plus fructueux, tant pour le projet que pour les communautés concernées, en promouvant la collaboration, la confiance et la prospérité partagée.

Des occasions pour les Autochtones dans les infrastructures

Les collectivités autochtones peuvent participer à un projet d’infrastructures de différentes façons. Elles peuvent le faire directement par le biais d’une participation en actions, d’un partage des revenus ou d’une autre entente mutuellement avantageuse, ou encore d’une participation moins directe comme un placement dans une entreprise d’infrastructures publique ou un fonds d’infrastructures privé.

Le plus souvent, la participation est officialisée au moyen d’une entente négociée sur les avantages qui régit la relation entre la communauté autochtone et le projet d’infrastructures. Ces ententes énoncent les avantages et la rémunération spécifiques que la communauté autochtone recevra en échange de son soutien ou de son consentement à un projet, en veillant à ce que ses intérêts soient codifiés et reconnus dans le cadre des activités courantes du projet. Les ententes fructueuses facilitent la consultation et l’approbation de la communauté en tenant compte de ses objectifs sociaux, économiques et environnementaux, tout en assurant une distribution équitable des coûts et des avantages du projet. Les avantages peuvent comprendre la rémunération financière, des possibilités d’emploi, la formation professionnelle et les initiatives de développement communautaire.

La participation en actions permet à la communauté autochtone de participer directement aux facteurs économiques des investissements en infrastructures. En ayant une participation dans un projet, les communautés reçoivent des profits et prennent part à certains aspects du processus décisionnel. Les ententes de partage des revenus sont une autre façon pour les communautés autochtones de partager les profits générés par un projet d’infrastructures et peuvent constituer une importante source de revenus. Ces deux types d’ententes peuvent renforcer leur économie, favoriser la création d’emplois et améliorer l’accès aux ressources.

En plus des participations en actions et des paiements de redevances, on peut envisager d’autres ententes mutuellement avantageuses. Il est important de reconnaître que les besoins, les valeurs et les ambitions de chaque communauté autochtone sont uniques de la même façon que chaque projet d’infrastructures est distinct. Bien qu’il y ait des avantages à tirer parti de l’expérience passée et des pratiques exemplaires, il n’existe pas d’approche universelle. Chaque discussion doit s’amorcer dans le respect de la communauté autochtone et la volonté de dialogue ouvert qui aboutissent à une entente et à une collaboration productive.

Accent mis par CC&L Infrastructure sur la valeur partagée et les partenariats solides

CC&L Infrastructure investit dans des infrastructures présentant un profil risque-rendement attrayant, une longue durée de vie et la possibilité de générer des flux de trésorerie stables pour une clientèle très diversifiée : fiducies autochtones, fonds de pension publics et privés, sociétés d’assurance vie, institutions financières, fondations et fonds de dotation, particuliers fortunés, etc.

En tant que propriétaire d’actifs à long terme et intendant du capital de ses clients, CC&L Infrastructure se concentre sur la gestion responsable de ses actifs, qui comprend une approche systématique de l’évaluation des facteurs environnementaux, sociaux et de gouvernance. Nous croyons que cette approche améliore notre capacité à gérer le risque, protège la valeur de nos placements et bonifie le rendement des placements à long terme.

Notre société collabore depuis longtemps avec des partenaires autochtones. Il y a plus de 15 ans, nous avons collaboré avec les Premières Nations locales lors de notre premier investissement; aujourd’hui, nous coopérons d’une façon ou d’une autre avec les communautés autochtones pour plus de la moitié des actifs d’infrastructures canadiens en portefeuille. Il s’agit notamment de plusieurs installations hydroélectriques au fil de l’eau et projets d’énergie solaire dans lesquels nos partenaires autochtones détiennent une participation directe à nos côtés.

CC&L Infrastructure est membre du Groupe financier Connor, Clark & Lunn Ltée, une société de gestion de placements détenue par ses employés, dotée d’une structure multientreprise et dont les sociétés affiliées gèrent collectivement un actif de plus de 222 milliards de dollars canadiens.

Round checkboxes on white paper and an orange ballpoint pen.

2024 is shaping up to be a historically significant year for elections, with around half of the world’s population having the opportunity to vote. An estimated 76 countries will hold elections in 2024, including eight of the 10 most populated (Bangladesh, Brazil, India, Indonesia, Mexico, Pakistan, Russia and the US). Europe will witness the most election activity, with 37 countries voting, followed by Africa with 18.

US elections: The world watches

The US election in November, when voters will choose the next president, the entire House of Representatives and a third of the Senate, is expected to dominate headlines. The most likely scenario is a rematch between President Joe Biden and Donald Trump.

The shifting focus of Europe’s political landscape

The European Parliament elections are in June and the topic of migration will likely be at the forefront of debates. If current trends persist, the EU could see the highest number of asylum applications since the 2015-16 refugee crisis. Once thought of as a solution to labour shortages, migrants are increasingly being viewed by some European politicians as a security threat, despite ongoing worker shortages. This could lead to a meaningful political shift toward stricter immigration controls.

Dutch elections: A sign of the times?

The Netherlands’ snap elections on November 22 were perhaps a glimpse of what is to come, with the far-right Freedom Party led by Geert Wilders winning unexpectedly. No party achieved more than 25% of the vote, necessitating coalition talks that could stretch well into 2024. In addition to a strict stance on immigration, the Freedom Party campaign included higher taxes on banks, which negatively impacted Dutch bank stocks the following day. However, the Amsterdam Stock Exchange remained stable after the election due to the pending coalition formation.

Poland’s election results as a market catalyst

Poland’s October elections saw a major upheaval, with the long-ruling nationalist party being replaced by pro-Europe parties, lifting Polish markets the following day.

From voting booths to market trends

That is not to say all elections wield the same influence. Russia’s elections are unlikely to challenge Vladimir Putin’s stronghold. Brazil and Turkey will hold local or municipal elections, while the EU will elect its next parliament.

India, the world’s largest democracy, is likely to see Modi’s party re-elected in May despite some recent discontent. Indonesia will also hold elections early in the new year.

Taiwan’s January elections, important for their geopolitical implications, are expected to see the pro-independence party maintain control. It remains to be seen how the country’s relationship with China will develop from there.

Understanding the election effect on markets

US Bank reports that the S&P 500 Index typically experiences lower returns due to investor uncertainty before US presidential elections, with stronger returns in the following year regardless of the election outcome. Notably, returns tend to be higher when an incumbent party is re-elected and when one party wins decisively, suggesting larger policy changes.

Investing smart in election years

We believe our diversified portfolio is especially critical in periods of uncertainty. Election outcomes can heavily influence economic policies, affecting taxation, regulations and economic reforms. These changes have the power to shape various sectors and industries in profound ways. Safeguarding your investments by diversifying across different securities and industries is a wise strategy.

The role of quality companies

Quality companies that demonstrate enduring strength, guided by capable management and driven by long-term secular trends are well-equipped to weather the market’s ups and downs. Their resilience and adaptability often become key to their sustained success, offering a more grounded perspective for investors looking beyond the immediate horizon of shifting politics.

Lower Manhattan skyline at sunset on an overcast day.

The US commercial real estate (CRE) sector is experiencing heightened concerns due to increasing interest rates and diminishing credit availability. In the third quarter, US banks faced challenges from the CRE loans in their portfolios. For instance, Morgan Stanley allocated an additional $134 million for credit losses, in addition to the $161 million provisioned in the previous quarter, attributing this to worsening conditions in the CRE sector. Bank of America saw its nonperforming loans surge by $707 million, reaching $4.8 billion in the third quarter, driven primarily by CRE.

While it might seem like the entire sector is facing turmoil, it is important to note that CRE includes a wide range of assets. Segments like industrial, retail and hotels remain relatively stable, whereas offices spaces are facing substantial difficulties.

JLL reports that the US office vacancy rate has soared to 21%, a peak not seen in over 25 years as of Q3 2023. The imbalance between supply and demand is reflected in the 18.3 million square feet of negative net absorption, contributing to an annual total occupancy loss of 51 million square feet, although the vacancy rate differs significantly between the high-quality segment of the office market and the more obsolete ones.

Furthermore, the Trepp CMBS Special Servicing Rates for offices, which tracks the share of loans at risk of default, surged to over 8%, the highest since May 2017. This increase suggests more challenges ahead.

The sector also faces a huge refinancing hurdle. From 2023 to 2025, nearly $1.36 trillion in CRE loans will mature, a quarter of which are collateralized by office properties. Even with prevailing rates, new lending rates are likely to be 3.5 to 4.5 percentage points higher than existing mortgages.

The combination of high vacancy rates and rising interest rates complicates refinancing efforts. Lenders and CMBS investors have significantly tightened underwriting standards, pushing the loan-to-value (LTV) ratio to around 53%, the lowest in 23 years, and well below the historical average of around 65%.

This shift and higher financing costs could devalue office properties by around 20% for prime buildings and over 60% for lower-quality ones. While public market valuations are resetting, the private market has been slower to respond. A narrowing valuation gap between these markets is expected as risks persist.

The increase in office landlords defaulting on loans is concerning, with some properties falling below their mortgage values, prompting landlords to surrender properties to lenders. Even leading office owners like Pacific Investment Management Co. and Brookfield defaulted on their mortgages earlier this year. Most landlords have managed to maintain their mortgages due to typically long-term office leases, but as more mortgages come up for renewal, we expect an increase in defaults.

The typical capital structure in CRE is around 30% to 40% equity and 60% to 70% debt, with banks owning around 60% of the loans. Therefore, there is concern that the challenges in the CRE, especially the office sector, may trigger another banking crisis.

The basic problem is an oversupply of office space. Solutions like converting office spaces to residential use are being discussed, but only 10% to 15% of US offices are suitable for residential conversion. Government support may be necessary to incentivize and facilitate these conversions. Cities like Boston, New York, Washington DC, Chicago, Portland, Los Angeles and the Bay Area have already started incentivizing office conversions since the pandemic.

In our portfolios, we hold a few positions with exposure to commercial real estate:

IWG, which we talked about in a recent commentary, is the world’s largest provider of workspace solutions. While the growth outlook for traditional offices is in question, demand for flexible workspace has been growing, driven by the structural growth in flexible and hybrid working. Higher vacancy rates at office buildings also allow IWG to negotiate better lease terms with landlords. With a major competitor WeWork fading out of the landscape, IWG is well-positioned to expand its network.

Savills, established in 1855, is a leading global real estate advisor with expertise in various segments including residential, office, industrial, retail, leisure, healthcare, rural and hotel property, and mixed-use development schemes. Its revenue is diversified, with 40% from transaction advisory (30% commercial, 10% residential), and 60% from stable segments like investment management and property management. Despite a decline in transaction advisory business in the first half of the year, revenue growth in property management has kept its business relatively stable. Savills generates over 85% of its revenue from the UK, Asia Pacific, Continental Europe and the Middle East, with less than 15% from North America. Office occupancy rates are higher in Asia Pacific (79%) and Europe (75%) compared to the Americas (50%), suggesting less distress in these regions. Savills has a strong balance sheet to weather the current turbulent times.

The hotel sector, while hit hard during the pandemic, is recovering faster than offices. With international borders reopening and a surge in travel demand, hotel occupancies, especially in cities like London, New York and Tokyo, are improving and contributing to a strong investment outlook supported by fundamental performance.

Melia Hotels, a major holding in our strategies, is seeing strong bookings and improvements in occupancies and RevPAR. The company operates 350 hotels, with nearly 92,000 rooms globally. Despite its quality assets, it is trading at a significant discount to its net asset value, but increasing transaction volumes in the industry at higher multiples may reduce this discount.

We recently initiated a position in Hoshino Resorts REITs (HRR). Sponsored by Hoshino Resort, HRR has an extensive hotel portfolio, including upscale resorts and city hotels. Its flagship hotels managed by Hoshino Resorts show a strong recovery, with RevPAR 20% above pre-pandemic levels.

Despite ongoing challenges in the CRE industry, we believe the resilient business models and strong balance sheets of the companies in our portfolios will help them navigate these difficulties.