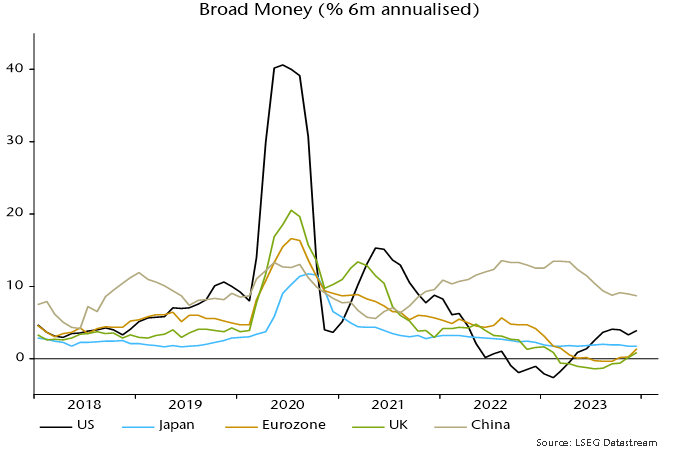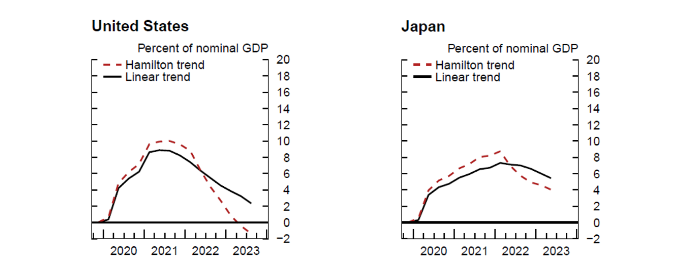
The six-month rate of change of US broad money has recovered from negative territory in early 2023 to 3.9% annualised in December – close to an average of 4.2% over 2010-19, when economic performance was generally favourable.

Does this signal that the economy has adjusted to higher interest rates and monetary conditions are no longer particularly restrictive, in turn suggesting less need for Fed easing?

The analysis below of the “credit counterparts” to monetary expansion indicates that the recent revival has been driven by exceptionally large-scale purchases of Treasury bills by money market funds.

Such buying will fall back but its recent importance highlights a larger point. If the fiscal deficit remains at its current level (or rises further), and the Treasury continues to choose to fund a large proportion of the deficit by expanding the Treasury bill issue, the contribution of deficit financing to monetary growth is likely to be significant, even assuming no return to QE. In this scenario, a higher average level of interest rates may be necessary to constrain money growth to a pace – of perhaps 4-5% pa – compatible with trend economic expansion and on-target inflation.

On the suggestion that the recovery in money growth obviates the need for policy easing, a key point is that the effects of prior monetary restriction are still feeding through and may not be fully apparent for another year or more. Rate cuts are likely to be warranted to cushion near-term economic weakness and avert an inflation undershoot.

The numbers quoted above for US broad money expansion refer to the “M2+” measure calculated here, which adds large time deposits at commercial banks and institutional money funds to the official M2 measure. The inclusion of these items is important as they capture a significant proportion of money holdings of non-financial businesses and non-bank financial institutions. As previously discussed, US business money holdings have been rising rapidly in recent quarters, resulting in six-month momentum of M2+ diverging positively from that of M2 since late 2022, i.e. M2 is understating broad money growth at present.

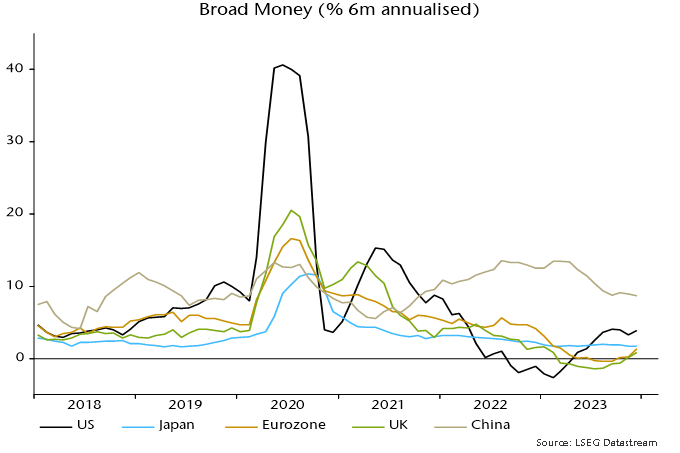
Six-month broad money momentum has recovered by much more and to a higher level in the US than in the Eurozone and UK – see chart 1.

Chart 1

Chart 1 showing Broad Money (% 6m annualised)

The credit counterparts analysis links changes in broad money to movements in other items on the monetary sector’s balance sheet, the US monetary sector being defined as the Fed, commercial banks and other depository institutions, and money funds. The following simple formulation is used for the analysis here:

Change in broad money = monetary financing of federal deficit + change in commercial banks’ loans and leases + other counterparts (residual)

Monetary financing of federal deficit = net purchases of Treasury securities by Fed, commercial banks and money funds – change in Treasury general account balance at Fed

The table shows the contribution of these items to the six-month change in M2+, not annualised, in December 2022 and December 2023.

Table 1 showing the contribution of these items to the six-month change in M2+, not annualised, in December 2022 and December 2023

The positive swing in six-month momentum between the two periods was driven by monetary deficit financing and, in particular, a huge change in money funds’ transactions in Treasuries, from selling in H2 2022 to exceptionally large-scale buying in H2 2023.

What caused this turnaround? Following the suspension of the debt ceiling in June 2023, the Treasury issued a net $1.21 trillion of Treasury bills in H2 2023, up from $170 billion in H2 2022 and the second-highest half-year amount ever (after H1 2020).

Money funds and commercial banks are natural buyers of Treasury bills because of the maturity structure of their liabilities. The market mechanism that induced them to increase demand was a rise in Treasury bill yields relative to other short-term rates, including the emergence of a premium over the Fed’s overnight reverse repo rate.

Money funds moved $1.1 trillion out of the Fed facility during H2 2023, buying an estimated $900 billion of Treasury securities and placing the remainder (and an additional amount) in the private repo market (with those funds probably also used to buy Treasuries, suggesting further indirect monetary financing).

Money funds’ Treasury buying is likely to slow dramatically in H1 2024, for two reasons. First, expansion of the Treasury bill issue will be scaled back to $200 billion (from $1.21 trillion in H2 2023), according to refunding plans. Secondly, money funds’ balance in the Fed facility was down to $800 billion at end-2023 (from $2.3 trillion a year earlier), with a further decline in early 2024. The rate of Treasury bill purchases will plausibly slow as the balance approaches exhaustion.

It would, however, be misleading to suggest that purchases of Treasuries by money funds and banks face a constraint in terms of the availability of investible resources. The first-round effect of the fiscal deficit is to swell the broad money stock, i.e. it creates the liquidity necessary to absorb associated debt issuance. If new Treasuries are sold to non-banks, the monetary boost is reversed. If, alternatively, money-holders choose to retain their higher balances, banks and money funds have additional funds with which to buy Treasuries. The money creation due to the deficit then remains unsterilised.

How large a boost could this private form of monetary financing give to broad money growth over the medium term? The federal deficit was $1.78 trillion in calendar 2023, equivalent to 6.5% of GDP and 6.8% of the M2+ stock at end-2022. Suppose that 1) the deficit remains stable as a proportion of the money stock, 2) it is half-financed via Treasury bills and 3) money funds and banks take up half of the issued bills. Assuming no QE / QT and a stable Treasury balance at the Fed, monetary deficit financing would contribute 1.7 pp to annual M2+ growth.

For comparison, Treasury buying by money funds and banks contributed 0.6 pp to average annual growth of M2+ over 2010-19.

Suggested conclusions are: 1) prior monetary weakness will be the dominant influence on economic developments over the next few quarters; 2) the recovery in broad money growth is likely to stall in H1 2024; and 3) a persistent large fiscal deficit could cause funding indigestion and force a renewed increase in reliance on bill financing (or, in the extreme, a resumption of QE), in turn posing an upside risk to medium-term money growth and inflation.

Photo of Sabrina Lacroix


En tant que responsable de la conformité, Sabrina Lacroix s’appuie sur les bases établies au cours de son mandat en tant que gestionnaire principale de la conformité. Elle apporte une connaissance approfondie des cadres réglementaires et un dévouement au soutien des normes de conformité rigoureuses.

Nous nous réjouissons de l’impact qu’elle aura sur Global Alpha.

Image of car side mirror with view of scenery behind the car.

En 2023, à Banyan Capital Partners, nous avons poursuivi notre croissance stratégique, nos placements et la création de valeur pour nos investisseurs.
Nouveautés à Banyan et promotions récentes

Photo of Chris Luongo
Chris Luongo
Devient associé principal
Photo of Gordon Yee
Gordon Yee
Devient analyste principale
Photo of Miranda Li
Miranda Li
Devient analyste principale
Photo of Dominic Mitchell
Dominic Mitchell
Se joint à titre de
directeur, finances

Ces promotions et ajouts reflètent notre culture de croissance professionnelle et reconnaissent la contribution des membres de notre équipe. Le renforcement de notre équipe fait partie intégrante de notre succès continu et de notre capacité à repérer et à alimenter les occasions de placement prometteuses et notre portefeuille de placement.

Nouvelle plateforme de placement

Image of dried flower arrangement.

Second Nature Designs

Fondée en 1994, Second Nature est un fabricant et distributeur de premier plan de cadeaux et de produits de décoration pour la maison composés de fleurs séchées et d’autres produits botaniques d’origine naturelle de sources durables. La société s’approvisionne en matériaux à l’échelle mondiale, fabrique ses produits à Hamilton, en Ontario, et dessert une clientèle reconnue en Amérique du Nord.

Nous nous sommes associés au président et fondateur de Second Nature ainsi qu’à son équipe de direction pour faciliter la planification de la relève et réaliser la prochaine phase de croissance de la société.

Pleins feux sur le portefeuille

Image of vitamins

Purity Life

En novembre 2023, Purity Life a conclu l’acquisition des actifs d’Indigo Natural Foods Inc., un important distributeur de produits de santé naturels établi à Toronto. Cette transaction élargit la présence de Purity Life sur le marché de l’Ontario et améliore son portefeuille avec de nombreuses nouvelles marques.

Image of bike rack on top of vehicle

Rack Attack

En janvier 2023, Rack Attack a conclu l’acquisition de Racks Unlimited, un important fournisseur de solutions de porte-bagages pour véhicules comptant deux magasins à Calgary, en Alberta. Cette acquisition stratégique a permis à Rack Attack d’accroître sa présence sur le marché de l’Ouest canadien.

Grâce à l’ouverture de quatre nouveaux magasins à Kitchener, London, Winnipeg et Philadelphie, la société compte maintenant 46 magasins en Amérique du Nord.

Innovative Surface Solutions

En avril 2023, Innovative a eu le plaisir d’annoncer la nomination de David Safran au poste de président et chef de la direction. M. Safran a été chef de la direction de Kissner Group et compte plus de 15 ans d’expérience dans le secteur du sel et des produits dérivés.

Pour en savoir plus sur notre portefeuille de placement actuel.

Réseau de partenaires d’exploitation

Depuis 2008, Banyan s’est joint avec de partenaires opérationnel de différentes industries afin d’identifier des occasions d’investissements à long terme.

Photo of Andy O'Brien
Andy O’Brien
Partenaire opérationnel
Photo of Jason Grouette
Jason Grouette
Partenaire opérationnel

Andy O’Brien s’est joint à Banyan comme partenariat en juin 2023, pour cibler des occasions d’investissement dans les segments de l’alimentation et des boissons, des produits de consommation et des espaces commerciaux.

Cela fait suite à notre partenariat avec Jason Grouette en 2022 afin de cibler des occasions de placement dans les domaines des B2B industriels et des équipements de projection individuelle.

Apprenez-en plus sur notre réseau de partenaires d’exploitation

Perspectives

Banyan devrait poursuivre sa croissance et son expansion en 2024. Nous continuons de mettre l’accent sur la recherche de nouveaux placements dans les sociétés du marché intermédiaire en Amérique du Nord, tout en maintenant notre engagement à l’égard de la création de valeur à long terme. Nous continuerons de tirer parti de notre expertise et de notre réseau pour favoriser des partenariats stratégiques, assurant ainsi le succès durable de nos sociétés en portefeuille et de nos investisseurs.

Nouveaux placements

Nous continuons de chercher activement à investir dans des sociétés dont le BAIIA est d’au moins 5 millions de dollars.

Avez-vous une occasion en tête? Découvrez nos critères de placement ou communiquez avec nous dès aujourd’hui.

Shibuya Crossing and its surroundings in Tokyo, Japan.

Last week, the January edition of the BofA Global Fund Manager Survey was released. It featured 256 panelists who manage a combined US$669 billion in assets. The survey revealed a growing optimism about rate cuts and a macroeconomic “soft landing” despite increasing bearishness with respect to China. Among the many interesting findings, a few are particularly relevant to our focus:

  • For the first time since June 2021, there’s a marked preference for small caps over large caps.
  • A strong preference for high-quality investments.
  • Overweight in countries compared to the average positioning of the past 20 years: notably the US and Japan.
  • Overweight in sectors relative to the average positioning in the past two decades: predominantly in consumer staples, healthcare and technology.

While our last commentary covered global small caps in general, this week let’s take a closer look at Japan specifically. The positive sentiment towards Japan in the survey is in line with market trends. The Nikkei 225 Index was up 28% in 2023 and recently reached its highest level in 34 years, approaching a new record.

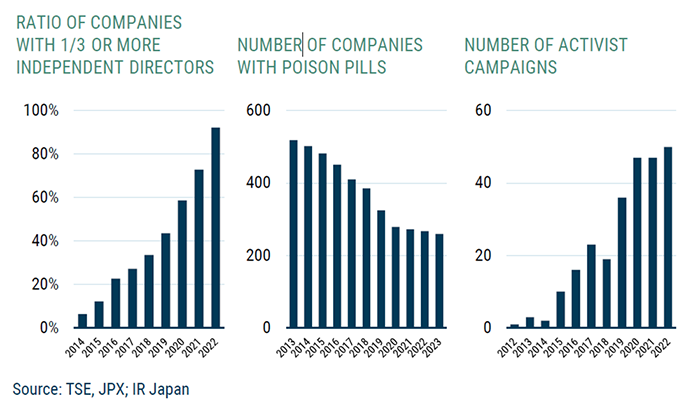
Factors driving this rally include a weaker yen, the end of deflation, wage growth and improved corporate governance. A decade ago, few companies had independent directors, but today almost all have at least a third of their board as independents. Institutional investors are increasingly voting down poison pills and supporting activism.

Source: GMO.

In 2024, we expect continuing financial reforms to attract more investors. Here are some new initiatives:

  • January: Introduction of the revamped Nippon Individual Savings Account (NISA). Under Prime Minister Kishida’s new capitalism scheme, the NISA aims to boost household wealth through investment. The contribution limit has been raised and the tax-exempt period extended, allowing an annual contribution of up to ¥3.6 million (US$24,300) per person and a combined total balance of ¥18 million to be permanently tax exempt. As of June 2023, there were 19.4 million NISA accounts, a modest number considering Japan’s population. In contrast, Japanese households held a record ¥2,115 trillion in financial assets, with more than half of this amount in cash.
  • January 15: Companies on the Tokyo Stock Exchange (TSE) began disclosing their capital efficiency plans. Thus far, 40% of firms listed in the TSE’s prime section have done so.
  • April: Enhanced segment earnings reporting. In addition to quarterly earnings reports, listed companies will now only need to submit more detailed financial reports semiannually rather than quarterly. This change emphasizes segment reporting. The TSE will mandate that companies disclose earnings and cashflow for each business segment to improve transparency.
  • November 5: The TSE will extend trading hours by 30 minutes to increase liquidity.

How have Japanese small caps been performing?

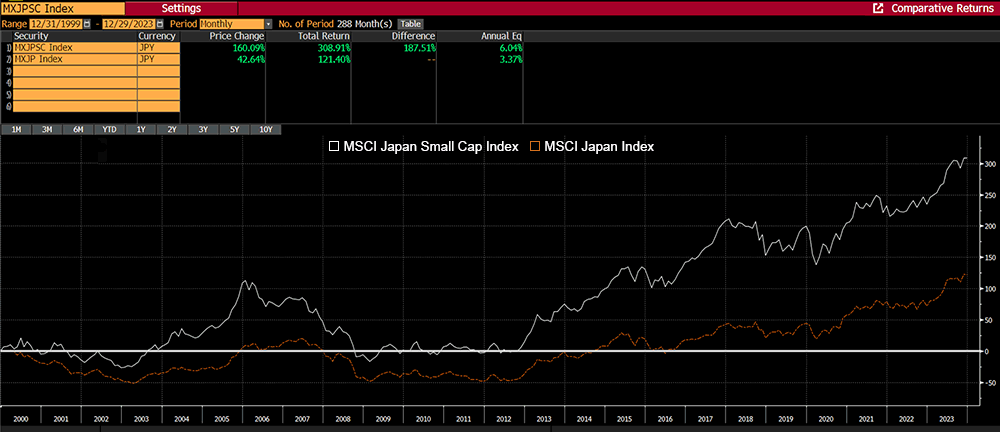
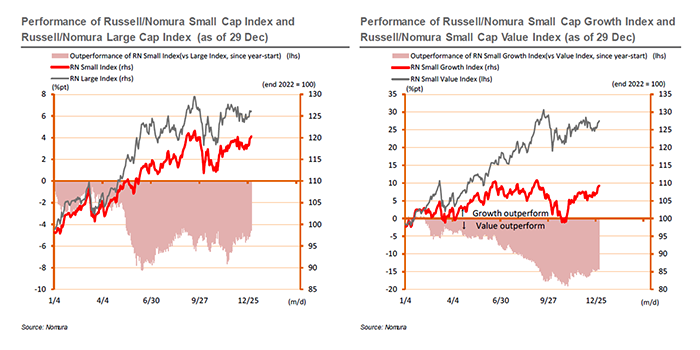
Since 2000, Japanese small caps have substantially outperformed large caps.

However, in 2023, they underperformed, with value stocks outperforming growth stocks. This trend was influenced by the TSE’s March 2023 initiative for sustainable growth and enhanced corporate value, leading to a renewed interest in large caps and companies with a price/book value below 1x.

Looking ahead, we believe strong fundamentals and valuations are likely to favour Japanese small caps over large caps due to:

  1. Faster earnings growth: Bloomberg data predicts +20% EPS growth for the MSCI Japan Small Cap Index in the next 12 months compared to +8% for the MSCI Japan Index. EPS growth for the following 12 months is +12% for the MSCI Japan Small Cap Index and +10% for the MSCI Japan Index.
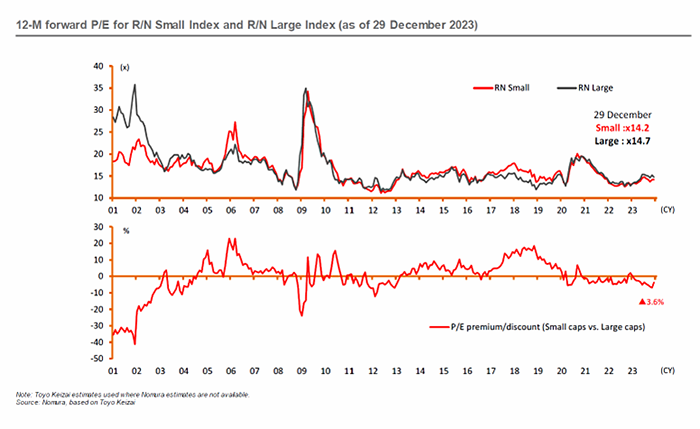
  2. Cheaper valuations: The P/E multiple discount for Japanese small caps compared to large caps widened in 2023 to a sizable 3.6%, suggesting a potential mean reversion.
  3. Reduced FX volatility: We expect the JPY to appreciate against the USD in 2024 in response to monetary policy in the US and Japan. Japanese small caps, which are more exposed to the stable domestic economy than large caps, should be less affected by currency fluctuations and may even benefit from a stronger yen via imports.

We believe the shift towards Japanese markets and small-cap stocks hints at something deeper than market fluctuations and could be indicative of structural changes and a broader reassessment of risk and opportunity. Moving forward, investors may need to view traditional powerhouses through a new lens and consider how different markets and different asset classes can offer new avenues for growth in a world where economic certainties are increasingly hard to come by.

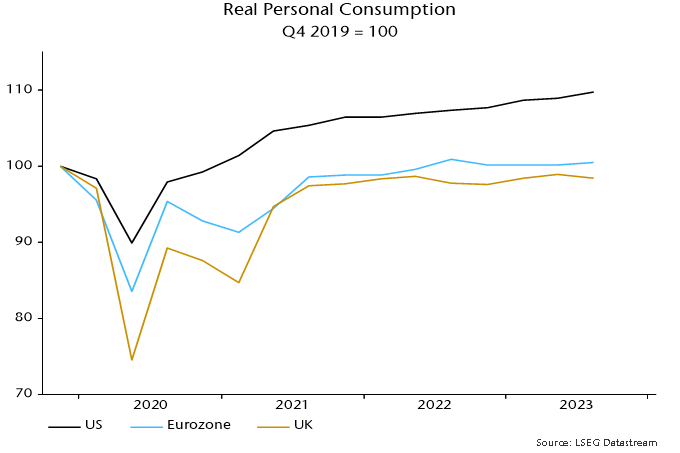
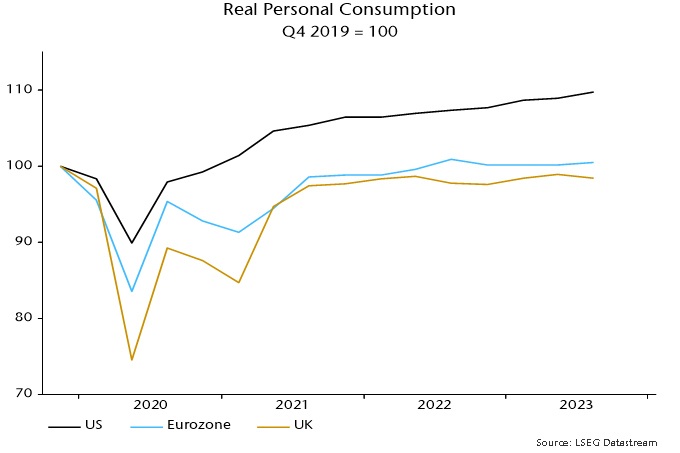
US consumers have trounced the Europeans – again. US personal consumption rose by 9.7% between Q4 2019 and Q3 2023 versus a 0.5% increase in the Eurozone and a 1.6% fall in the UK – see chart 1.

Chart 1

Chart 1 showing Real Personal Consumption Q4 2019 = 100

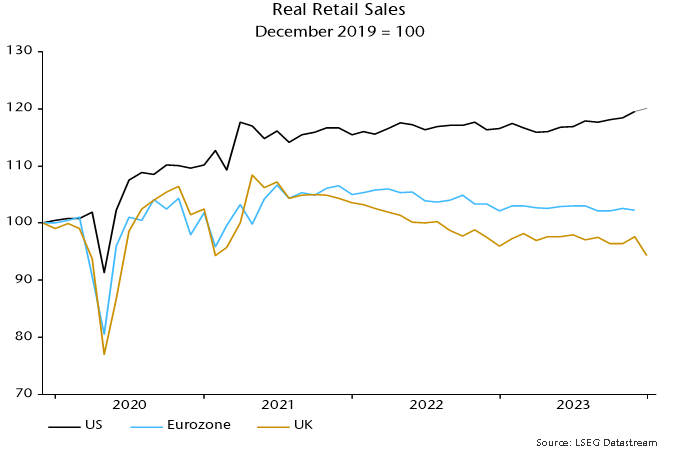
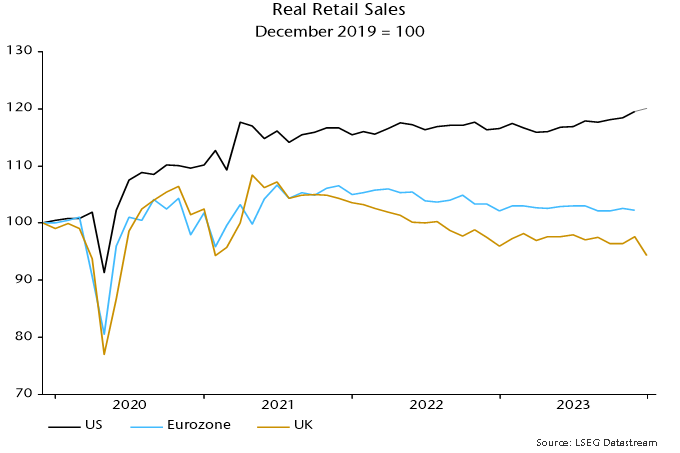
The divergence probably widened in Q4, judging from retail sales. US sales rose solidly into year-end as Eurozone turnover flatlined (through November) and UK sales hit a new low – chart 2.

Chart 2

Chart 2 showing Real Retail Sales December 2019 = 100

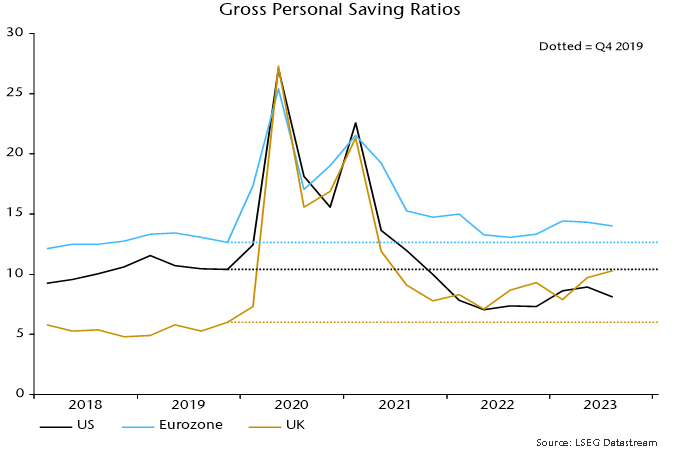
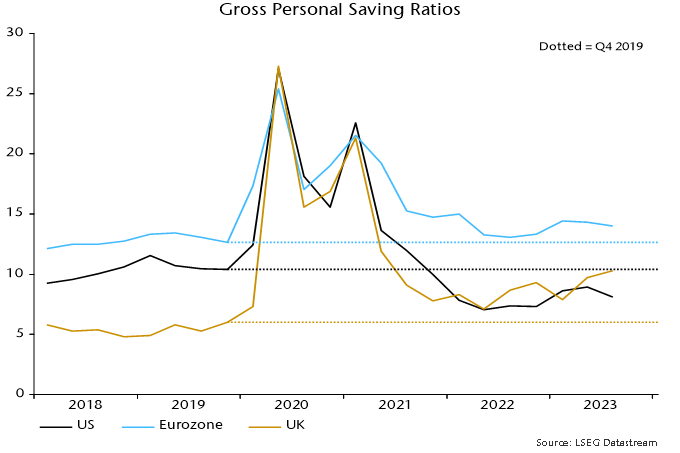
Faster growth of US real personal disposable income explains just over half of the US / Eurozone consumption divergence over Q4 2019-Q3 2023 and about one-third of the US / UK difference. The remainder reflects contrasting saving behaviour.

The US personal saving rate fell by 2.3 pp between Q4 2019 and Q3 2023 versus rises of 1.4 and 4.3 pp in the Eurozone and UK respectively – chart 3*.

Chart 3

Chart 3 showing Gross Personal Saving Ratios Dotted = Q4 2019

What explains the willingness of US households to consume more out of their income than before the pandemic, both in absolute terms and relative to Europeans?

A “monetarist” view is that divergent saving behaviour is related to the magnitude of the boost to household money balances from pandemic-era monetary and fiscal stimulus.

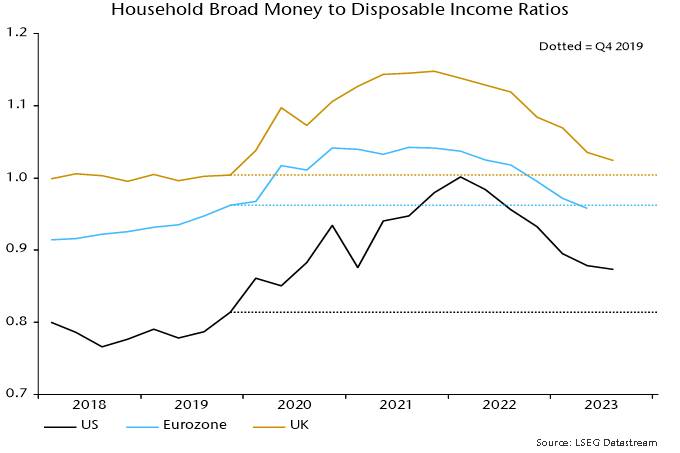
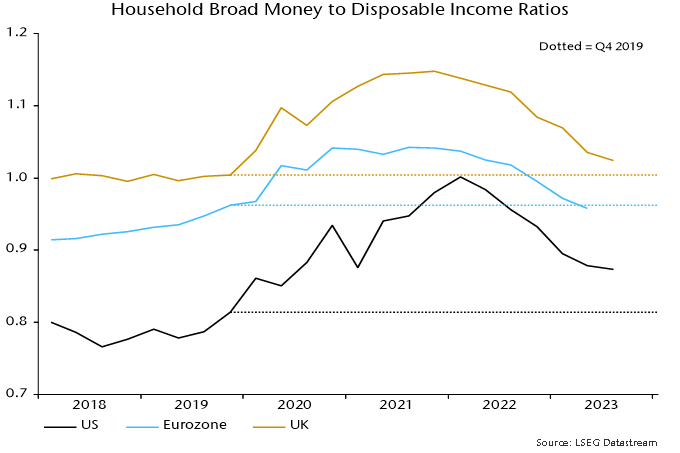
The rise in the ratio of household broad money to disposable income from Q4 2019 was larger and peaked later in the US than in the Eurozone and UK – chart 4.

Chart 4

Chart 4 showing Household Broad Money to Disposable Income Ratios Dotted = Q4 2019

Households with “excess” money balances adjust by spending more on consumption or investment (housing), adding to non-monetary financial assets and / or reducing debt. The larger US excess has probably resulted in a bigger and more sustained boost to consumption than in Europe.

To the extent that monetary adjustment involves higher consumption, the saving rate will be lower than otherwise until the ratio of money balances to income is restored to an “equilibrium” level.

Judging how much of a consumption boost remains requires an estimate of “equilibrium”. As chart 4 shows, the ratio of household broad money to income is below its Q4 2019 level in the Eurozone but still higher in the US and, to a lesser extent, UK.

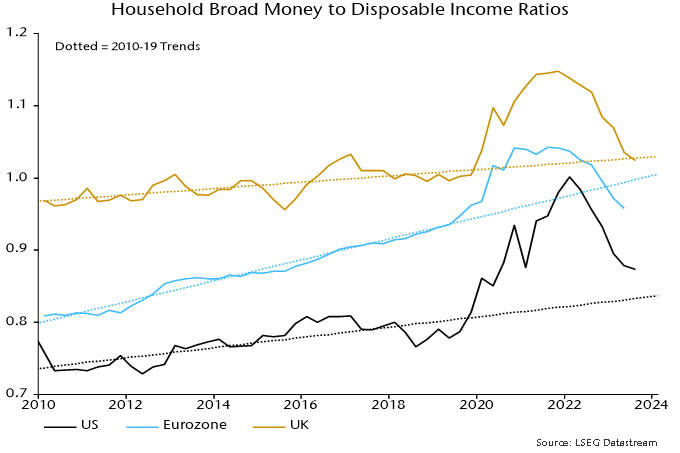
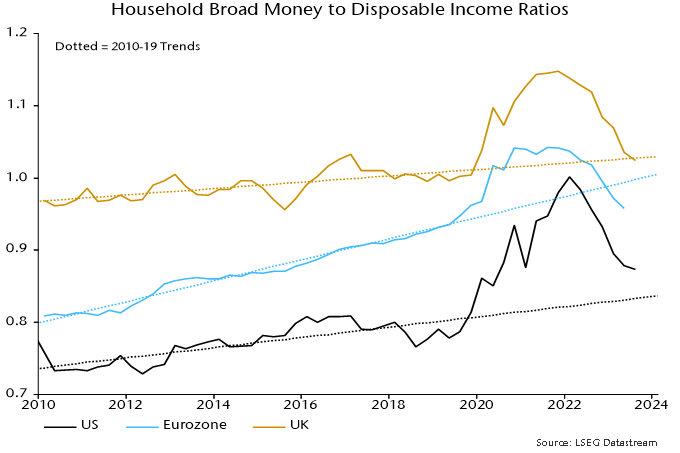
A superior approach, however, may be to compare money to income ratios with their pre-pandemic trends, since the ratios tend to rise over time as wealth grows faster than income.

On this basis, money demand may now be acting to restrain consumption in the Eurozone / UK, while US excess money balances are now modest and on course to be removed during 2024 – chart 5.

Chart 5

Chart 5 showing Household Broad Money to Disposable Income Ratios Dotted = 2010-19 Trends

The US money to income ratio peaked in Q1 2022, a quarter ahead of the low in the saving rate. The saving rate had risen by 1 pp by Q3 2023 and may increase further as the excess money effect wanes.

*The headline measure of the US personal saving rate is calculated net of depreciation. A gross measure is used here to align with European convention.

Election sign at Polling Station.

Last week, the New York Times identified some pivotal themes set to shape 2024: elections, antitrust and shadow banking, painting a vivid tableau of the global investment landscape. Against this backdrop, over half the world’s population across more than 50 countries will choose their governments in 2024. The US is probably the most significant, but Taiwan’s on January 13 was also noteworthy in the context of the country’s tense relationship with China and its crucial role in the global technology sector and semiconductor manufacturing.

In antitrust, recent weeks have seen cancellations of deals such as Illumina and Adobe and losses in important cases for Google and Apple (with appeals underway). Many antitrust cases are expected to reach courts in both Europe and the US in 2024.

The shadow banking sector is also at the forefront, with prominent figures like Jamie Dimon of J.P. Morgan highlighting private credit as a potential harbinger of the next financial crisis.

Listen to Robert’s audio commentary:  


Small caps in 2024

Turning to our universe of global small-cap equities, our outlook for 2024 builds on our December 2023 comment. As you may recall, 2023 was marked by the dominance of US large-cap equities, particularly the “Magnificent Seven” technology stocks. To help provide a well-informed outlook for this year, I reviewed our previous commentaries, all of which are available on our website from the time our firm was established. They offer valuable context and background and I invite you to browse them for a fuller picture of our thinking over time.

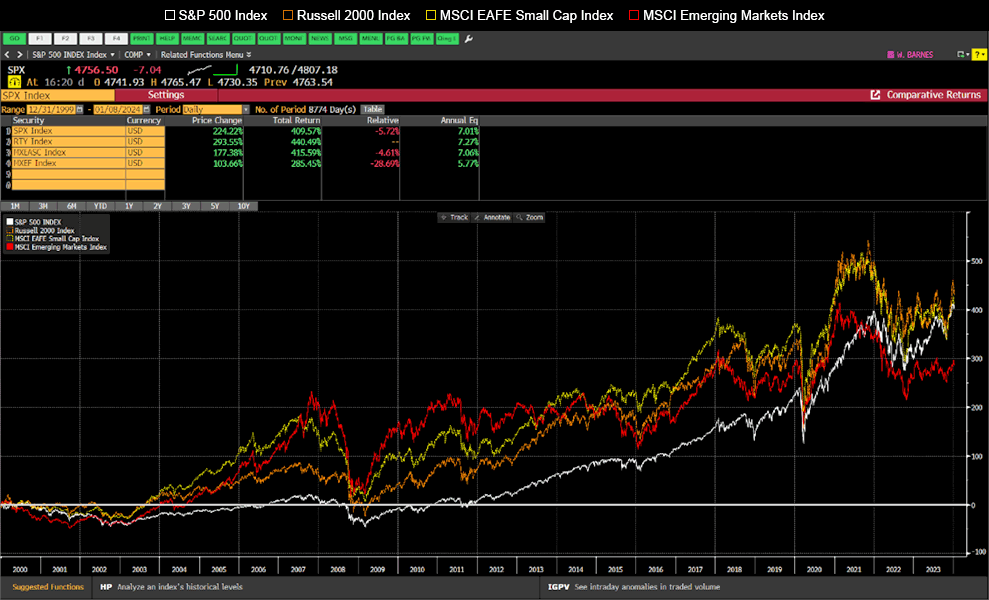
Despite the incredible returns of the Nasdaq-100 Index and, consequently, the S&P 500 Index due to unprecedented concentration, these large-cap indices have not significantly outperformed small caps since 2000, even in the face of various global upheavals, including the tech crash, the Great Financial Crisis and the COVID-19 pandemic.

Defying expectations: Large-cap vs. small-cap performance since 2000

Source: Bloomberg.

2024’s market moods

Understanding market psychology is a good starting point for thinking about the year ahead. So, where do we stand today?

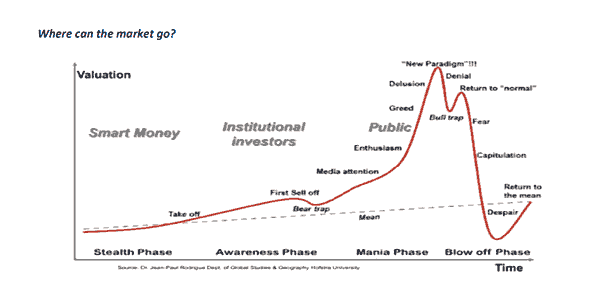
We view the Nasdaq 100 and, by extension, the S&P 500 as being in the “New Paradigm” phase. Meanwhile, small-cap, international and emerging markets equities are approaching the “Despair” phase. Question is, when and what will trigger a return to the mean?

 Line graph showing the cycle of market sentiment, beginning with its rise, reaching a high point labeled "new paradigm," followed by a decline to a low point of despair, and then stabilizing back to the average level.

The concentration conundrum

The S&P 500 is at its highest concentration ever, with the top-10 stocks comprising 31%. This is in contrast to the 35-year average of 20% and even exceeds the 25% peak during the tech bubble. A look back at the performance of US large caps following the era of the Nifty Fifty, which dominated the markets in the 1960s, these stocks subsequently underperformed from 1973 to 1982, realigning their multiples with the broader market.

From 2000 to 2010, US large caps lagged most other indices by a wide margin.

Another perspective to consider is that the US’s weight in the MSCI World Index is at an all-time high of 70%, far exceeding its 25% contribution to global GDP. This is a stark increase from approximately 38% at the end of 2000.

According to the Buffett Indicator, which measures the total market cap over GDP, we are currently at 174%, another record high.

Now that we have scared you about the US large-cap market, the question remains: why do we anticipate a return to the mean in 2024?

Unprecedented global events: a four-year retrospective

The last four years have been extraordinary. In 2020, we had the COVID-19 pandemic, followed by a global lockdown, things we had never seen before. 2021 was the year of the reopening, although a few countries like China reopened in 2022. We also saw the rise of inflation. Not so transitory as it turned out, although the supply chain shocks were. 2022 was the year of the great interest rate resets around the world and the end of free money. Rates were no longer zero. We also saw the war between Russia and Ukraine break out last February. 2023 could have been a more normal year, maybe marked by a slowdown or recession caused by the rapid rise in interest rates. Instead, the economy continued to be strong.

The overlooked factors of government spending and consumer behaviour

What did we miss? First, we missed the fact that governments around the world continued to spend enormously, while running huge deficits. The US, for example, ran a deficit for fiscal 2023 (October) of $1.7 trillion, $320 billion (23%) more than in 2022 and 6.3% of its GDP.

Second, we did not think Americans would spend all the excess savings they had built up during COVID-19.

Source of excess savings

Source: Federal Reserve.

Third, we did not anticipate the frenzy brought by the launch of ChatGPT and the narrative around generative AI.

Fourth, we did not anticipate such an aggressive Fed pivot while inflation is still running hot. Is the Fed seeing a market slowdown ahead?

Navigating new normals

So, what do we think is in store for 2024?

  • The pandemic is over. Although COVID-19 persists, it is no longer seen as a flu variant. No more lockdowns. And companies in 2024 will stop the references to 2019.
  • Interest rates have more or less reached a peak. Will they come down fast? We do not think so unless we experience a deep recession and even then, they will not go back to 0. That experiment failed and the central banks admit it. Will they go from 5% to 10% as they did from 0 to 5%? We believe absolutely not.
  • Supply chain shocks have subsided. There are always supply chain snags, but what we saw in 2021 and 2022 is now behind us.
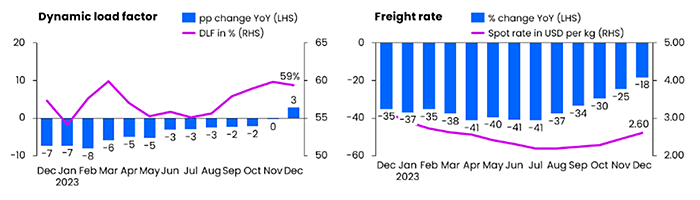
  • The easy comparison for inflation is now over. Comparing 2023 prices to 2022 showed a big decline. Comparing 2024 to 2023 will not be so straightforward. We will realize that inflation is stickier. How central banks will react remains to be seen. See air freight rates as an example:

Source: Xeneta.

  • The return of the bond vigilante: Those government deficits are unsustainable and the amount of government debt to be refinanced in 2024 is staggering. Governments will have to go back to austerity, possibly at the worst possible time if the economy slows down. We will also see income taxes rise, particularly for companies with high profitability and aggressive tax strategies.
  • The lagging impact of interest rate increases: It takes about 18 months to see the full impact of interest increases. So, we will see the impact of increases for another year, even if rates come down quickly.
  • A return to investment fundamentals: 2023 was brutal for many fundamental investors, us included. Dividend-paying companies underperformed non-dividend payers by the largest margin since 1983. Companies with strong balance sheets underperformed the weakest. Companies with low valuations underperformed those with high valuations.
  • Emphasis on revenue and EPS growth: In 2023, steady revenue and earnings growth gave way to momentum and liquidity. A good example is Apple, which saw its share price increase 49% in 2023 despite a 3% revenue decline in FY 2023 (September) and no earnings growth. That share price increase was equivalent to close to a trillion dollars, the market cap of Australia’s, South Korea’s or Stockholm’s stock exchanges. We anticipate a different trend this year, with a focus on solid balance sheets to withstand shocks and higher interest rates and to take advantage of consolidation opportunities.
  • There will be more M&A, both from strategic investors as well as private equity funds. A more stable operational and funding environment will be conducive to transactions.
  • We may also see a return of individual investors in Japan now that the Nikkei Index is back to where it was in 1990 and the government is trying to unlock US$14 trillion of household savings by expanding the tax-exempt Nippon Individual Savings Account (NISA), allowing investors to buy up to $24,170 per year in stocks. Japanese households keep 54% of their assets in cash versus 35% in the euro area and 13% in the US.

Building trust through market cycles

For our clients who started investing with us between 2019 and March 2020, you will have experienced mediocre performance, even worse if you invested with us in spring 2020 or since March 2022. But likely satisfactory if you invested with us outside these periods.

Should you keep your trust in us? We believe you should.

Our portfolio management team remains the same. The five partners who manage our one portfolio as one team have been together for over 15 years.

We have added to our bench strength with five more analysts joining our developed market portfolio management team since 2018 and three more covering emerging markets.

Upholding our investment philosophy

Our philosophy remains the same. We believe:

  1. Earnings growth drives stock prices.
  2. Secular trends will support superior and longer-term growth.
  3. A long-term investment horizon is key.

Our investment process is solid:

  1. Add excellent investment ideas that meet all our criteria, including valuation and expected return, to an approved list.
  2. Use the approve list to build a portfolio that meets client expectations and constraints.

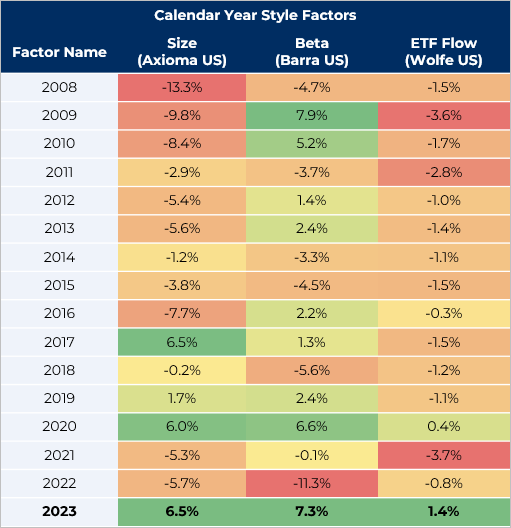
The chart below shows some style factors since 2008. Our worst two years since inception have been 2020 and 2023. Unfortunately, this has impacted our one to four-year performance. As illustrated, those two years coincided with size (larger), beta (higher) and ETFs (passive flows) outperforming.

You will also notice that the number of years these factors underperformed greatly surpass the number of times they outperformed, forming another reason for our optimism.

Calendar year style factor returns

Heatmap showing calendar year style factor returns from 2008 to 2023.

Source: Omega Point.

As we reflect on these trends and look ahead, it’s clear that the markets are in flux. We remain committed to adapting to these changes, always with an eye on long-term growth.

With this perspective, I want to wish you an excellent 2024. May the year bring health, peace and happiness to you, your families and your friends and colleagues!

Robert Beauregard

President, Co-Founder and Chief Investment Officer

*This communication may contain forward-looking statements (within the meaning of applicable securities laws) relating to the business of our funds and the overall financial environment in which they operate. Forward-looking statements are identified by words such as “believe”, “in our opinion”, “anticipate”, “project”, “expect”, “predict”, “intend”, “plan”, “will”, “may”, “estimate” and other similar expressions. These statements are based on our expectations, estimates, forecasts and projections and include, without limitation, statements regarding decreased fund portfolio risk and future investment opportunities. The forward-looking statements in this communication are based on certain assumptions; they are not guarantees of future performance and involve risks and uncertainties that are difficult to control or predict. A number of factors could cause actual results to differ materially from the results discussed in the forward-looking statements. There can be no assurance that forward-looking statements will prove to be accurate as actual outcomes and results may differ materially from those expressed in these forward-looking statements. Readers, therefore, should not place undue reliance on any such forward-looking statements. Further, these forward-looking statements are made as of the date of this communication and, except as expressly required by applicable law, we assume no obligation to publicly update or revise any forward-looking statement, whether as a result of new information, future events or otherwise.

Image of Arthur Erikson Place

 Investissements immobiliers Crestpoint Ltée (en coentreprise avec Vestcor Inc.), KingSett et Reliance Properties Ltd. ont annoncé aujourd’hui que l’immeuble emblématique de Vancouver, Arthur Erickson Place, a obtenu la certification « Norme du bâtiment à carbone zéro – PerformanceMC » du Conseil du bâtiment durable du Canada.

China’s economic woes partly reflect restrictive monetary policy. The latest money numbers suggest still-deteriorating prospects and urgent need for a policy reversal. It is unclear whether such a pivot is under way.

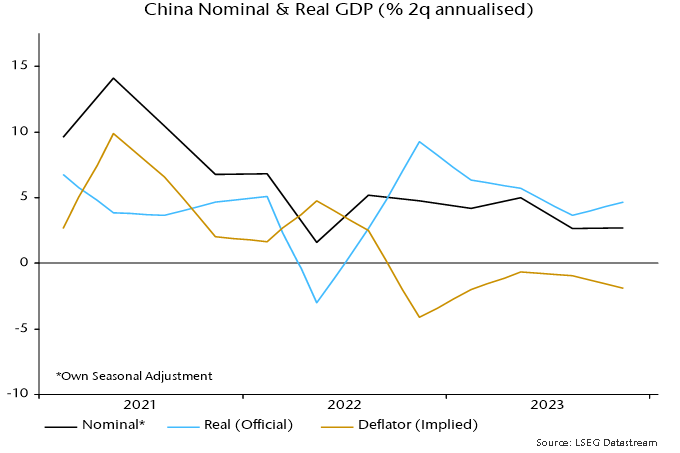
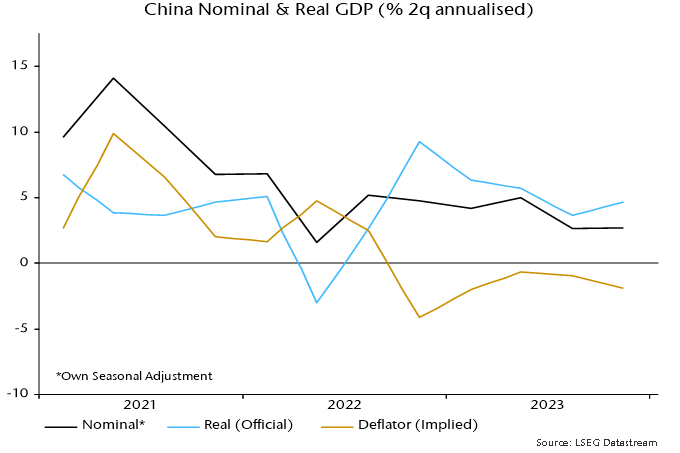
Two-quarter growth of nominal GDP (own seasonal adjustment) remained historically weak at 2.7% annualised in Q4, after 2.6% in Q3. Official real GDP numbers show a recovery in two-quarter growth from 3.6% annualised to 4.7%, so the implication is that GDP prices fell at a faster rate (1.9% annualised versus 1.0%) – see chart 1.

Chart 1

Chart 1 showing China Nominal & Real GDP (% 2q annualised)

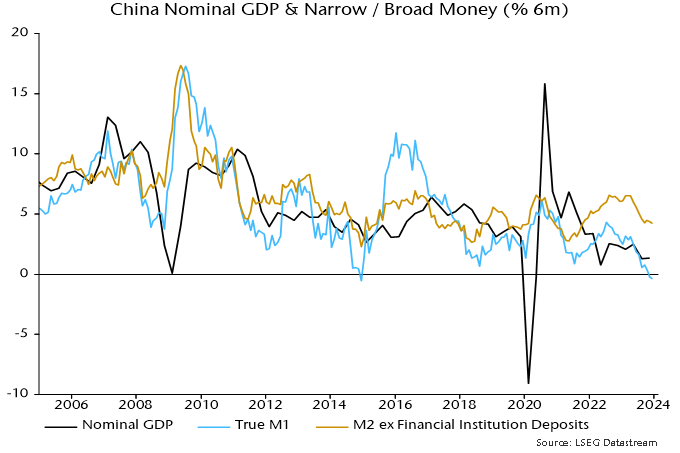
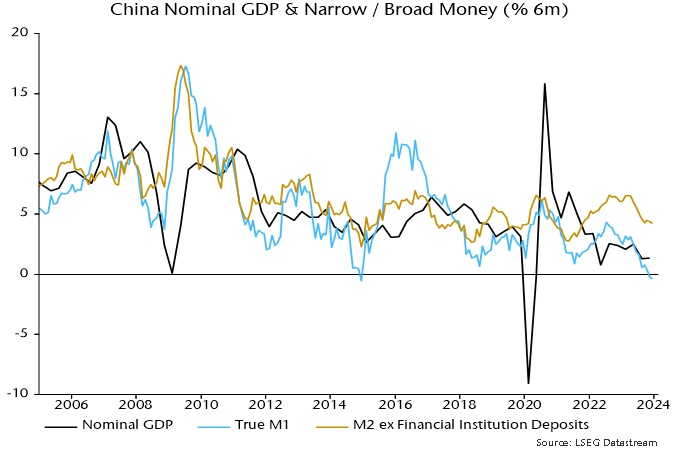
The stabilisation of two-quarter nominal GDP growth in H2 2023 mirrors sideways movement of six-month narrow and broad money growth during H1. Money trends, however, weakened sharply during H2, suggesting a further slowdown in nominal / real GDP in H1 2024 – chart 2.

Chart 2

Chart 2 showing China Nominal GDP & Narrow / Broad Money (% 6m)

Six-month narrow money momentum turned negative in late 2023 and is challenging the record low reached at end-2014. Weakness then rang policy alarm bells, contributing to an aggressive easing shift in 2015 that succeeded in reflating the economy and stocks.

Monetary optimists note that broad money growth is above the level reached then and in the middle of its range in recent years. A widening narrow / broad money divergence, however, suggests a faster rate of decline of broad money velocity, plausibly related to structural weakness in real estate and lack of confidence in policy.

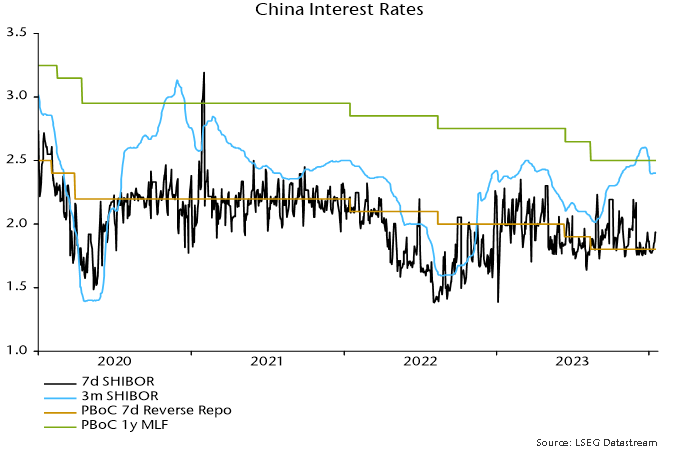
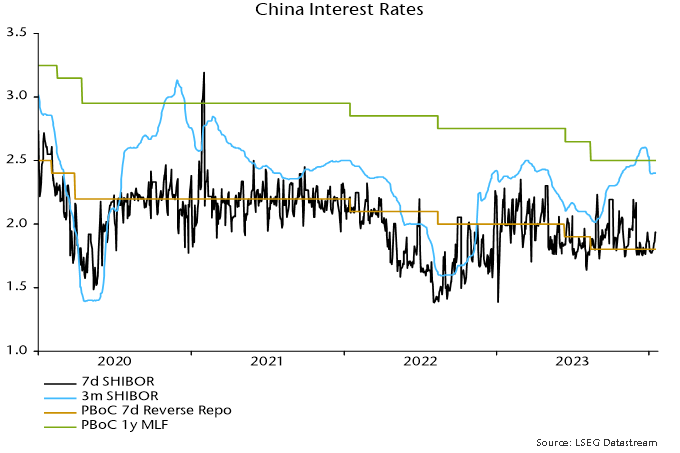
Will the economy and markets be rescued by 2015-style easing? Developments in 2023 don’t inspire hope. The PBoC loosened policy during H1 but a new upswing in term money rates began soon after the appointment of new Governor Pan Gongsheng in July, with three-month SHIBOR closing 2023 at a 32-month high – chart 3.

Chart 3

Chart 3 showing China Interest Rates

Another change under Governor Pan has been the suspension of publication of the PBoC’s informative quarterly surveys of entrepreneurs, consumers and bankers – the Q3 surveys were never released and Q4 results would normally have appeared by now.

A possible interpretation is that the PBoC has switched to prioritising currency stability, managing rates higher to discourage capital outflows while passing the baton of economic support to fiscal policy (and withdrawing from providing information on economic developments).

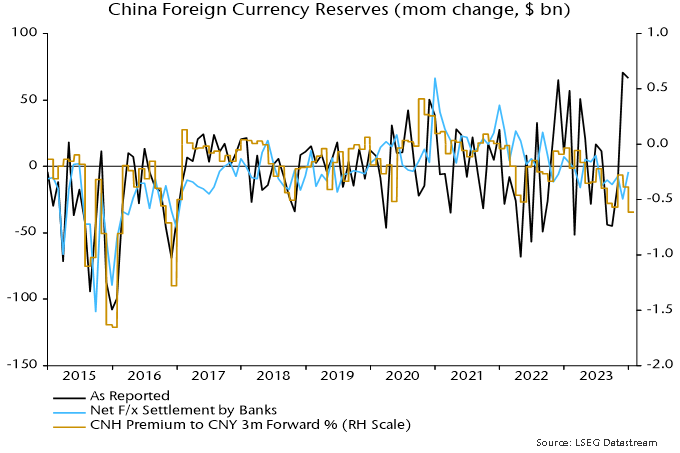
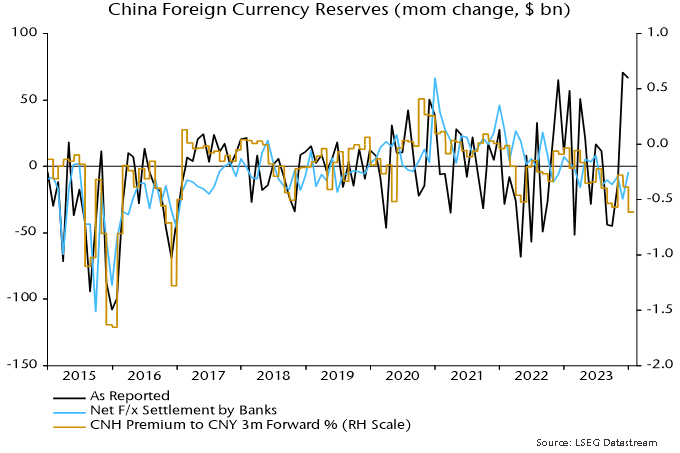
Foreign exchange reserves were boosted by valuation effects in late 2023 (weaker US dollar, rally in Treasuries) but settlements data suggest sustained intervention to support the currency during H2, consistent with a persistent sizeable forward discount on the offshore RMB – chart 4.

Chart 4

Chart 4 showing China Foreign Currency Reserves (mom change, $ bn)

Fiscal stimulus focused on government-directed investment is unlikely to be sufficient to reverse economic weakness without accompanying monetary accommodation to lift private sector confidence and broad money velocity.

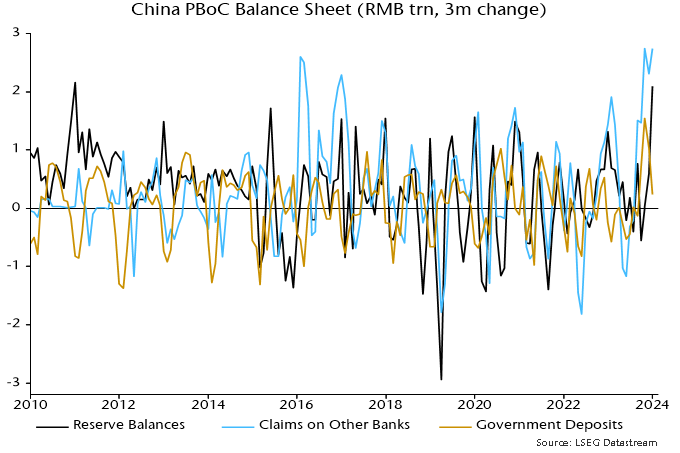
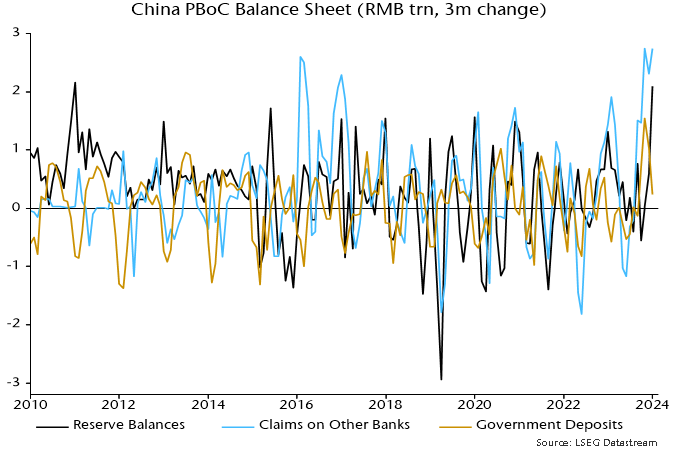
Are there any signs of the PBoC pivoting back to easing? One glimmer is that its lending to the banking system continued to expand rapidly in late 2023, which, together with a slower rise in government deposits at the PBoC, resulted in the second-largest quarterly rise in bank reserves on record – chart 5.

Chart 5

Chart 5 showing China PBoC Balance Sheet (RMB trn, 3m change)

The PBoC’s injections, however, may have been intended to moderate rather than reverse the rise in money rates. Three-month SHIBOR eased in early January but has stalled since – chart 3. Recent renewed US dollar strength may bolster the hard-liners.

Aerial view of downtown Taipei, Taiwan. Financial district and business area with intersection or junction with traffic.

Summary

  • EM underperformed US and international markets through 2023 – posting a 10.3% return in USD terms versus 26.3% for the US, 18.9% for EAFE and 22.7% for Europe ex-UK.
  • China was down 11% for the year, while Taiwan was up 31.3%, India 21.3%, Brazil 31.5% and Mexico 41.6%.
  • EM equities trade at 11.9x next 12m P/E against a 20-year average of 12.6x, while China trades at 9.3x against a 20-year average of 12.5x.
  • Brent crude closed the year at US$80 per barrel, pulling back sharply from its spike above US$90 in October following the outbreak of conflict between Israel and Hamas.
  • China held its Central Economic Work Conference in December, with top officials and economic advisers meeting to set growth targets for 2024. Government advisers have told the press that officials are targeting a range between 4.5% and 5.5%, with most favouring around 5% (the same as for 2023). The official target is set to be officially endorsed at the Two Sessions in March.
  • As reported in the Financial Times, BYD sold a record 526,000 battery-only EVs to Tesla’s 484,000 during the fourth quarter of 2023. This is the first time BYD has surpassed Tesla in quarterly sales.

“Goldilocks thinking”

Earlier this year, we emphasised our caution with respect to market expectations for the economy and inflation, warning that a Wile E. Coyote moment was a real risk for investors lured into the idea of a “miraculous disinflation” or “no landing” scenario. Bets on the combination of falling inflation, a resilient economy and rate cuts in 2023 were the fuel for a Santa rally propelling tech stocks and cyclicals.

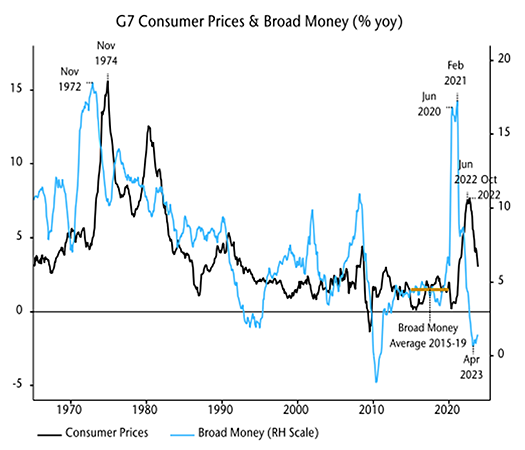
In line with our forecasts, inflation has fallen rapidly as suggested by broad money growth with the usual two-year lag. What has surprised us is the resilience of the US economy despite monetary tightening, which appears partly to reflect consumption driven by savings built up during the pandemic. Improvements in the global supply chain have also supported industrial production.

G7 inflation rates fell by more than most expected during 2023, mirroring a big decline in money growth during 2021 – inflation heading for an undershoot by end 2024

Source: NS Partners & Refinitiv Datastream.

Better inflation news has allowed the Fed to stay on hold since July despite strong Q3 GDP growth and a still-tight labour market. With inflation likely to continue to fall, investors are more hopeful of a soft landing coupled with rate cuts in 2024 and have rerated risk assets accordingly.

Based on the monetary and economic data that we track, our view is that market sentiment is excessively bullish and at risk of a correction. In his latest memo, Easy Money, published on January 9, Oaktree’s Howard Marks struck a similar tone, warning against “Goldilocks thinking”:

“At present, I believe the consensus is as follows:

  • Inflation is moving in the right direction and will soon reach the Fed’s target of roughly 2%.
  • As a consequence, additional rate increases won’t be necessary.
  • As a further consequence, we’ll have a soft landing marked by a minor recession or none at all.
  • Thus, the Fed will be able to take rates back down.
  • This will be good for the economy and the stock market.

Before going further, I want to note that, to me, these five bullet points smack of “Goldilocks thinking”: the economy won’t be hot enough to raise inflation or cold enough to bring on an economic slowdown.”

We certainly agree. While our analysis suggests that inflation has further to fall and rate cuts should be coming this year, global manufacturing PMI new orders are likely to decline further. Additionally, money trends are yet to suggest a significant subsequent recovery.

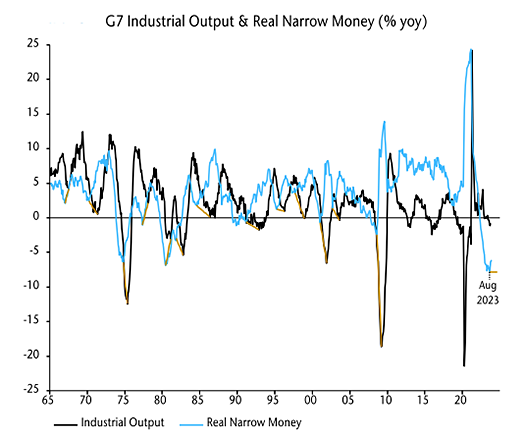
Economic “resilience” partly reflected pandemic catch-up effects, but is consistent with historical experience following monetary tightenings, suggesting greater H1 weakness

Source: NS Partners & Refinitiv Datastream.

G7 annual real narrow money momentum led industrial output momentum by an average 12m at major lows historically, suggesting that the full impact of recent weakness won’t be apparent until mid-2024.

We continue to believe that hard landings are possible in the US / Europe, with resilience to date not inconsistent with historical lags for monetary weakness and yield curve inversion. Against this backdrop, we expect quality and defensive sectors to outperform in the near term on a view that hopes of a soft landing may prove to be premature.

Taiwan’s DPP returned to the presidency but lose the legislature

Taiwan held elections on January 13, with William Lai Ching-te of the Democratic Progressive Party (DPP) winning the presidency, taking 40% of the vote against 33% for Hou Yu-ih of the Kuomintang (KMT) and 26% for Ko Wen-je of the Taiwan People’s Party (TPP).

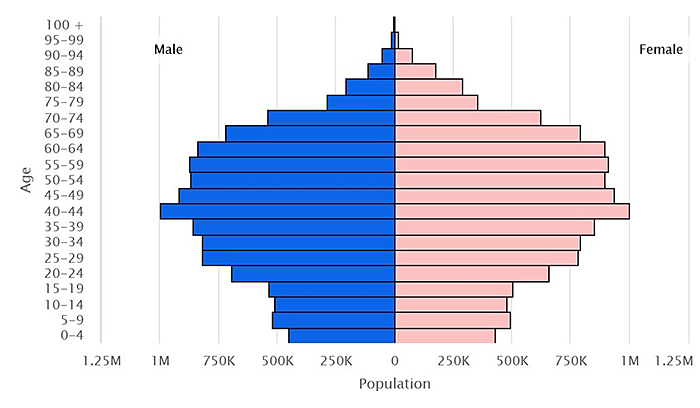
Credibility on management of cross-strait relations to safeguard Taiwan’s democracy was a key issue, and the key factor behind the DDP presidency win. However, voters (particularly younger generations) expressed their dissatisfaction with the DDP on a host of domestic issues that cost the party its hold over the legislature, now controlled by the KMT. Issues include prohibitively expensive property prices, a rapidly ageing population (see chart below), stagnant wage growth and debate over the length and quality of military conscription.

Taiwan faces demographic headwinds

Source: CIA Factbook 2024.

In addition, a host of DPP officials have been caught up in scandals in recent years, including misuse of party funds, academic plagiarism by a legislator subsequently promoted by President Tsai to vice president of the government and an extramarital affair forcing another legislator to step down.

What does China make of it? While China has repeated the rhetoric that “reunification is inevitable”, the election result is unlikely to provoke any material military response from Beijing in the near term, although some PLA muscle-flexing is to be expected in the coming months. Predictably, the Party is claiming the result as a win from its perspective, pointing out that the result signals voter dissatisfaction in the electorate after eight years of DPP rule, with Lai’s win in part owing to Taiwan’s first past-the-post electoral system. The majority of voters went for the KMT (Beijing’s favoured candidate) and political upstart TPP.

Perhaps the most notable development was the rise of the TPP, founded less than five years ago by prominent surgeon and quirky political pragmatist Ko Wen-je. Clever rhetoric and deft use of social media was key for Ko to connect with younger voters, to foreground domestic issues in his campaign over relations with China, effectively counter-positioning with the DPP and KMT.

On China, Ko has shifted over the years from alignment with the DPP towards the KMT, arguing that Taiwan is part of a greater China while disagreeing with Beijing over which state should rule the territory.

Over the next term, Ko and his party have eight seats in the legislature, setting the TPP up as kingmaker to either the KMT with 52 seats or DPP with 51, and a pivotal player on issues such as energy policy, defence expenditure and kickstarting wage growth in the service sector.

Looking further ahead, the TPP may signal the breakdown of old, inherited voting patterns and the emerging base of young voters who identify primarily as Taiwanese but, at least for now, are more focused on domestic economic, social and political issues.

Hand flipping wooden blocks from 2023 to 2024, text on table.

L’année 2023 a débuté sous le signe de la prudence, sous l’influence principalement du contexte de marché de l’année précédente, qui avait été le théâtre de plusieurs nouveautés. En 2022, les investisseurs avaient enregistré pour la première fois des rendements négatifs importants à la fois pour les actions et les placements à revenu fixe traditionnels au cours d’une année civile. De nombreux régimes de retraite à prestations déterminées (PD) avaient également vu leur santé financière évoluer rapidement, passant d’un déficit à un excédent important malgré des conditions de marché difficiles. Les rendements ont connu un beau rebondissement en 2023, après bien des hauts et des bas. Cet article revient sur 2023 et offre des perspectives sur l’année à venir.

Des taux d’intérêt surprenants

La hausse rapide des taux d’intérêt a surpris de nombreux investisseurs, avec des conséquences variables selon les types d’investisseurs. Les investisseurs ayant un objectif de rendement total, comme les fonds de dotation, les fondations et les fiducies autochtones, ont vu la valeur marchande de leurs portefeuilles chuter en 2022, à cause des rendements négatifs à la fois des actions et des titres à revenu fixe. En revanche, en dépit des rendements négatifs des actifs, de nombreux régimes de retraite à PD ont vu leurs déficits faire place à des excédents, car la diminution du passif a dépassé la baisse des actifs.

La hausse des taux s’est traduite par des rendements plus avantageux à long terme pour les titres à revenu fixe. Alors qu’auparavant, les discussions portaient sur la réduction de la pondération des titres à revenu fixe, elles se sont tournées en 2023 vers l’évaluation des avantages qu’apporterait au contraire une pondération accrue de ces titres pour tous les types d’investisseurs.

Tour d’équilibriste

Pour les entités axées sur le rendement global, telles que les fonds de dotation, les fondations et les fiducies autochtones, l’amélioration des perspectives des titres à revenu fixe était une bonne nouvelle. Toutefois, les données historiques donnent à penser que la hausse des taux des titres à revenu fixe peut être le signe d’une baisse des rendements boursiers (voir « Le défi de la boule de cristal » ci-dessous).

Les organismes de bienfaisance enregistrés doivent composer en outre avec les conséquences de l’augmentation du contingent des versements (CV) annuel minimal, qui est passé de 3,5 à 5,0 % en 2023. Ce changement pourrait inciter les organismes de bienfaisance à viser des rendements plus élevés ou à accepter une marge de rendement supplémentaire plus faible pour répondre au CV plus élevé.

La perspective d’une hausse des rendements des titres à revenu fixe et d’une baisse potentielle des rendements boursiers a représenté pour les investisseurs une occasion de réévaluer leur stratégie de répartition de l’actif pour s’assurer qu’elle correspond à leurs objectifs, en particulier si leur pondération des titres à revenu fixe était habituellement faible ou largement en dessous de la répartition cible.

Des occasions à saisir

Début 2023, de nombreux régimes de retraite à PD ont vu leur santé financière s’améliorer grandement, après des décennies de cotisations supplémentaires pour contrebalancer les effets défavorables de la baisse des taux d’intérêt et de la croissance plus importante du passif que de l’actif en conséquence. Cette meilleure position financière a offert l’occasion de revoir les stratégies de répartition de l’actif à long terme et les niveaux de risque.

Les mesures spécifiques que les régimes de retraite à PD peuvent prendre varient en fonction du type de régime (p. ex., d’entreprise, universitaire ou public), des mesures de passif actuarielles qui dictent l’évaluation du risque, et d’autres facteurs, tels que l’ouverture ou la fermeture du régime à de nouveaux participants et l’échéance du régime (p. ex., pourcentage de participants actifs par rapport aux retraités et aux participants bénéficiant de droits différés). À tout le moins, pour les régimes dont la position de capitalisation s’était renforcée, il semblait pertinent d’aborder les avantages qu’apporterait une réduction du risque et les compromis envisageables en la matière.

Bien qu’il soit difficile de savoir dans quelle mesure les régimes de retraite à PD ont saisi cette occasion de réduire le risque et d’accroître leur pondération des titres à revenu fixe, les activités de recherche de titres à revenu fixe ont augmenté vers la fin de 2023, ce qui pourrait indiquer une tendance des comités à réévaluer leur stratégie de répartition de l’actif. Toutefois, il est évident que les marchés des titres à revenu fixe et des actions ont tous deux connu une année 2023 en dents de scie. Les taux des obligations à long terme ont grimpé davantage à la fin du troisième trimestre et au début du quatrième trimestre, avant de chuter par la suite, ce qui a entraîné une forte remontée des titres à revenu fixe à long terme, avec des rendements supérieurs à ceux des principaux marchés boursiers. Les rendements plus élevés des titres à revenu fixe sont probablement attribuables au fait que les passifs ont connu une plus forte augmentation que les actifs au quatrième trimestre, ce qui a en partie limité l’amélioration antérieure de la capitalisation des régimes de retraite à PD.

Un moyen de gestion du risque qui a encore été largement appliqué a été la réduction du risque à travers l’acquisition de rentes, en particulier dans le cas des régimes de retraite à PD d’entreprise, car cette transaction peut réduire l’incidence des régimes de retraite à PD sur les bilans d’une entreprise. Beaucoup des sociétés ayant choisi la voie de l’achat de rentes pour réduire leurs risques l’ont fait lorsque l’inflation était faible. Selon l’ampleur des augmentations des prestations de retraite liées à l’inflation, ces sociétés pourraient subir des pressions des retraités demandant des hausses ponctuelles des prestations de retraite dans le contexte actuel de forte inflation. Dans le cas du rachat d’une rente, la structure est telle qu’après la transaction, il n’y a plus de groupe d’actifs réservé auprès du promoteur du régime aux participants visés par le rachat, ce qui signifie que la seule source de financement pour les augmentations ponctuelles serait le bilan de la société.

Les titans de la technologie augmentent la concentration du marché

En 2023, les rendements boursiers ont été dominés par les actions américaines à mégacapitalisation, en particulier dans le secteur des technologies de l’information, grand bénéficiaire de l’enthousiasme des investisseurs pour l’intelligence artificielle (IA), ce qui a aggravé les problèmes de concentration de l’indice S&P 500. Comme le montre la figure 1, les dix principaux titres de l’indice S&P 500 représentaient près d’un tiers de l’indice à la fin de 2023.

Figure 1 : Pondération des dix principaux titres de l’indice S&P 500

Source : Groupe financier Connor, Clark & Lunn et S&P Global Market Intelligence.

Les actions américaines représentent généralement la composante individuelle la plus importante des portefeuilles de nombreux investisseurs. Les prochaines réunions du comité devraient inclure des discussions sur la concentration croissante du marché des actions américaines. Cela ne signifie pas que le secteur américain des technologies de l’information cessera d’enregistrer de bons résultats au cours de la prochaine décennie. Toutefois, il est prudent de tenir compte des avantages qu’apporte la diversification du portefeuille et d’évaluer les options de gestion des risques de baisse en cas de résultats négatifs.

La diversification au sein des marchés boursiers est une option, par exemple l’exploitation des qualités moins corrélées des marchés émergents par rapport à celles des marchés développés ou la combinaison d’un style de placement axé sur la valeur avec un portefeuille de croissance. Toutefois, une diversification au moyen de placements dans des titres à revenu fixe et des marchés privés peut s’avérer plus avantageuse. Ainsi, toute stratégie de diversification devrait inclure un large éventail d’occasions de placement sans se limiter aux actions.

Expériences contrastées sur les marchés privés

Au cours des 10 dernières années environ, les marchés privés ont enregistré d’importantes entrées de fonds en provenance des investisseurs institutionnels. En 2023, les rendements ont été contrastés entre les différents marchés privés. L’immobilier commercial a fait couler de l’encre pour deux raisons. Tout d’abord, les conséquences persistantes de la pandémie de COVID-19 sur le secteur des immeubles de bureaux ont entraîné une baisse des valorisations boursières. Deuxièmement, certains gestionnaires immobiliers commerciaux ont connu des problèmes de liquidité, ce qui a retardé les demandes de désinvestissement. Les autres secteurs de l’immobilier se sont bien comportés, ce qui a permis de compenser le recul du secteur des immeubles de bureaux dans les portefeuilles diversifiés et d’améliorer les perspectives du marché pour 2024 et à long terme.

Les marchés des actions de sociétés fermées ont aussi connu des difficultés en 2022-2023, mais les prévisions pour 2024 et au-delà sont beaucoup plus positives. En revanche, le marché des infrastructures a enregistré des résultats remarquables en 2023 et semble bien positionné pour l’avenir. Les infrastructures sont de plus en plus considérées comme essentielles pour soutenir les projets d’énergie propre et réduire la dépendance aux actifs à forte intensité carbone, dans le cadre des efforts mondiaux pour faire face au risque climatique. La réussite de la transition énergétique demandera de nouvelles infrastructures, basées sur des sources d’énergie renouvelable, partout dans le monde.

Le défi de la boule de cristal

Il n’est pas facile de prévoir les rendements. Par exemple, un sondage mené par Horizon Actuarial Services auprès de gestionnaires et de consultants en placement américains a révélé qu’ils avaient considérablement sous-estimé la vigueur du marché boursier américain pour la période de 10 ans terminée le 31 décembre 2022, et qu’au contraire, ils avaient surestimé les rendements plus faibles des marchés émergents. Les prévisions de rendement annualisé moyen des actions américaines s’élevaient à 5,9 %, alors que leur rendement réel a été de 12,6 %. Quant aux actions des marchés émergents, leur rendement prévu était de 7,5 %, mais elles n’ont affiché un rendement que de 1,8 % (tous les rendements sont en dollars américains).

Il y a toutefois une corrélation historique entre les taux de rendement et les perspectives de rendement des marchés boursiers. La figure 2 illustre la distribution des rendements historiques sur 10 ans de l’indice S&P 500. Les barres vertes représentent les moments où les taux des obligations du gouvernement américain à 10 ans étaient inférieurs à 3,5 % au début de la période de 10 ans, tandis que les barres dorées indiquent les rendements lorsque les taux initiaux étaient entre 3,5 % et 5 %. Par exemple, lorsque les taux étaient inférieurs à 3,5 %, environ 20 % des rendements se situaient autour de 17,5 %. Le rendement annualisé moyen global de l’indice S&P 500 lorsque les taux étaient inférieurs à 3,5 % était de 10,8 %. À l’inverse, lorsque les taux étaient plus élevés, comme tels de la fin de 2023, le rendement annualisé moyen de l’indice était de 6,7 %.

Figure 2 : Rendements des actions américaines selon le niveau des taux des titres à revenu fixe

Rendements annualisés des actions sur 10 ans

Source : Groupe financier Connor, Clark & Lunn.

Malgré la récente baisse des taux, les prévisions de rendement à long terme des titres à revenu fixe demeurent plus élevées que ce que nous avons observé depuis un certain temps. Le niveau des taux au moment de la rédaction du présent article indique également la possibilité d’une baisse des rendements boursiers à long terme par rapport aux hautes performances antérieures.

En ce qui concerne les marchés privés, il est difficile d’établir des généralités, car les perspectives dépendent fortement de la stratégie de placement spécifique. Il est donc important de communiquer avec vos gestionnaires de marché privé pour comprendre leurs prévisions de rendement et évaluer le risque de contraintes de liquidité, telles que celles récemment observées dans certaines stratégies d’immobilier commercial.

Sur d’autres marchés privés, comme celui de la dette privée, le contexte actuel a probablement favorisé le potentiel de rendement relatif, ce qui pourrait susciter un intérêt accru de la part de tous les types d’investisseurs. Comme nous l’avons mentionné plus tôt, l’accent mis sur la transition énergétique pour faire face au risque climatique devrait stimuler l’intérêt pour les stratégies d’infrastructures énergétiques spécialisées. Les conditions sont également réunies aujourd’hui pour envisager des actifs plus liquides et à rendement plus élevé, comme les prêts hypothécaires commerciaux, qui peuvent profiter de la hausse actuelle des taux.

2024 : Garder le cap en période d’incertitude

Au moment d’examiner les résultats de 2023, votre comité accueillera probablement avec soulagement les solides rendements totaux positifs du portefeuille. Le quatrième trimestre a rappelé aux régimes de retraite à PD envisageant une stratégie de réduction du risque que l’occasion de tirer parti d’une situation financière plus saine ne durerait pas indéfiniment et que sous certains scénarios, la baisse des taux de rendement (et une augmentation subséquente du passif) pourrait l’emporter.

Le marché ayant enregistré les meilleures performances en 2023 a été celui des actions américaines à grande capitalisation, qui a profité de l’enthousiasme suscité par l’IA. Même si les répercussions positives de l’innovation technologique pourraient durer, cela se jouera dans un contexte économique, social et politique difficile, avec des incertitudes connexes. Les risques géopolitiques, y compris les élections américaines, les conflits au Moyen-Orient et en Europe, et la rivalité sino-américaine, pourraient avoir des répercussions importantes sur les perspectives à court terme des marchés en 2024.

Eu égard aux diverses dynamiques soulignées, assurez-vous que la question de savoir si votre profil risque-rendement est en phase avec vos objectifs soit bien abordée lors des réunions du comité.

Abonnez-vous aux mises à jour