Highways and metro trains in Jaipur, the Pink City.

Given the trend towards increasing deglobalization, friend-shoring, diversity and the acceleration of these themes post-pandemic, the focus on efficient and robust supply chains has intensified. Moving manufacturing plants to reduce risk, India is one of the main beneficiaries of the China+1 strategy.

The bottleneck of logistics infrastructure

India’s main issues are its logistic infrastructure and overall spending as a percentage of GDP. Currently, India spends approximately US$400 billion, 15% of GDP, compared to around 10% for the US/Europe and 9% for China. The logistics sector has a major impact on India’s cost, efficiency and manufacturing and exporting capacity. India is a major exporter of agricultural products, pharmaceuticals and textiles.

Government interventions

One of the major steps was the introduction of the Goods and Service Tax (GST) across India in July 2017. This moved the unorganized market to the organized market (an ongoing process), helping to reduce tax evasion and increase the traceability of merchandise from origin to destination. Today, a GST-registered operator cannot transport goods in a vehicle whose value exceeds Rs.50,000 without an eWay bill.

Revolutionizing toll payments with FASTag

Wait times between states were a major bottleneck due to the collection of taxes, verification and bribes. To solve the problem, the National Highway Authority of India (NHAI) implemented an electronic toll system called FASTag that enables drivers to pass through toll plazas without stopping for transactions. Using RFID technology, toll payments are made directly from the prepaid account linked to the toll owner. In 2016, 70% of tolls had the technology implemented; however, only 4.8% of total payments were collected via FASTag. To increase adoption, NHAI increased the non FASTag cost to 200%, which pushed users to adopt it to reduce costs. As of 2022, 96% of total payments were made through FASTag, increasing efficiency across the logistics industry.

Multi-modal transportation meeting diverse needs

The demand for logistics services in India is witnessing growth across various modes of transportation, including rail, road, air and sea. Rail freight, facilitated by initiatives like Dedicated Freight Corridors (DFC), is gaining traction due to its cost-effectiveness and reliability. Similarly, trucking remains a dominant mode for last-mile connectivity, driven by the e-commerce boom and expanding retail networks. Furthermore, the emergence of e-commerce giants has propelled demand for air and sea freight, necessitating efficient cargo handling and multimodal connectivity.

Several industries in India are heavily reliant on efficient logistics operations to sustain their growth momentum. E-commerce, retail, FMCG, automotive and pharmaceutical sectors are among the key beneficiaries, leveraging logistics to streamline supply chains, reduce lead times and enhance customer satisfaction. Additionally, the rapid expansion of cold chain logistics is enabling the seamless distribution of perishable goods, catering to evolving consumer preferences and market dynamics.

Ambitious growth plans for national infrastructure pipeline

In 2020, the Union Minister for Finance & Corporate Affairs released the Task Force’s Final Report on National Infrastructure Pipeline (NIP) for FY 20-25, with a target investment of US$1.4 trillion. Infrastructure projects are expected to be completed by 2025, with 21% from the private sector. Given that most transportation is done on the surface, India’s roads and highways have been a main focus, increasing from 6,061 kms in 2016 to 10,457 kms constructed in 2022.

With all these investments, the government estimates that India’s transportation and logistics sector is poised to grow at a compounded annual growth rate (CAGR) of around 4.5% from 2022 to 2050.

Major plans for Indian transport infrastructure
Diagram of major plans for India transport infrastructure, namely roads, airports, railways, ports and logistics and key enabling policies supporting the targets.
Source: Building the future: Infrastructure investment opportunities in India by EY Parthenon.

TCI Express: A logistic player benefiting from government spending

TCI Express provides delivery solutions in India and internationally. Most of the transportation is surface-related, although the company does offer air express. TCIEXP is one of the few companies that can deliver to every pin code in India due to its extensive network of sorting/delivery centres.

Capitalizing on the express segment boom

TCIEXP is part of the express segment of logistics, which has a CAGR of 12% and 18% for air and ground, respectively, during the last 10 years (Source: B&K Securities). The industry is dominated by the unorganized space, which represents 80%, where individuals own one to five trucks in their fleet, offering highly competitive services.

The organized space represents 20% of the industry and within it, 75% is owned by large competitors and 25% by SMEs. TCIEXP benefits from government interventions by being the lowest-cost producer within express logistics, allowing it to capture market share from those moving from unorganized to organized.

Asset-light model driving high returns

Operating as an asset-light business, the company doesn’t own its fleet; it outsources distribution to a third party, resulting in over 20+% ROIC. It retains loyalty by offering favourable terms such as return loads, creating loyalty amongst drivers. The company launched its first automated centre in India in 2023 and plans to open another four within the next two years, resulting in lower trucking wait times and increased inventory turnover for clients.

Is India’s logistics revolution a global turning point?

As the country invests heavily in infrastructure and embraces technology, it stands on the brink of transforming its supply chain capabilities. For businesses and policymakers alike, the challenge and opportunity lie in navigating these changes to foster growth and efficiency. How will India leverage this chance to become a leading hub for global trade? The world is watching, and the stakes are high.

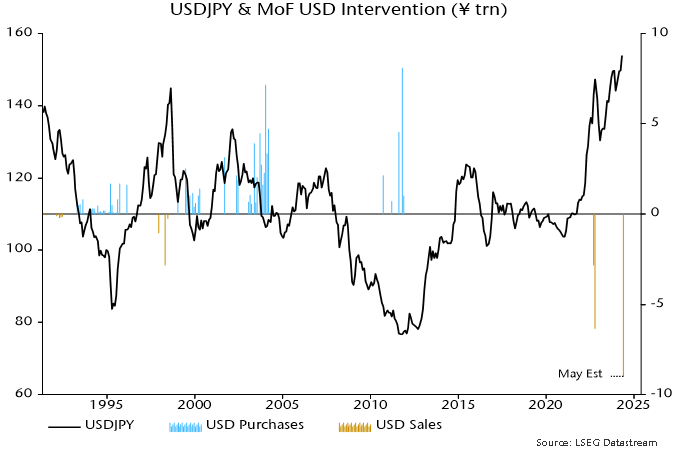
USD sales by monetary authorities in Japan, China and other Far East economies have probably topped $100 billion since April, exceeding intervention around the October 2022 dollar peak.

Market estimates are that JPY purchases / USD sales by the Bank of Japan on behalf of the Ministry of Finance on 29 April and 1 May totalled about ¥9 trillion / $ 57 billion. Official numbers covering the period from 26 April will be released next week.

Previous record monthly JPY purchases of ¥6.35 trn in October 2022 were associated with a USDJPY decline of 11.5% from October through January 2023 (month average data) – see chart 1.

Chart 1

Chart 1 showing USDJPY & MoF USD Intervention (¥ trn)

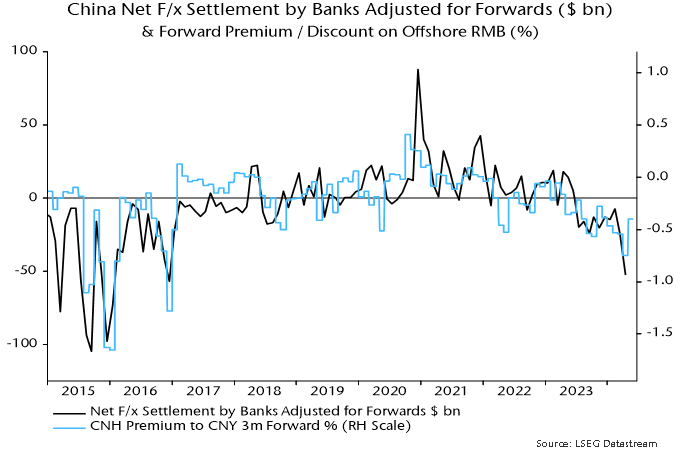
Chinese intervention is best measured by the sum of net foreign exchange settlement by banks and the change in their net forward position, since currency support operations are often conducted via state-owned financial institutions rather than by the PBoC using official reserves (h/t Brad Setser).

This series suggests USD sales of $53 billion in April, the largest since December 2016. Increased pressure for currency support had been signalled by a blow-out in the forward discount on the offshore RMB – chart 2.

Chart 2

Chart 2 showing China Net F/x Settlement by Banks Adjusted for Forwards ($ bn) & Forward Premium / Discount on Offshore RMB (%)

The Bank of Korea may have sold about $5 billion in April, judging from the change in value of reserves. With other Far East authorities also intervening, total USD sales may have exceeded $115 billion.

Intervention is more likely to be effective when supported by shifts in “fundamentals”.

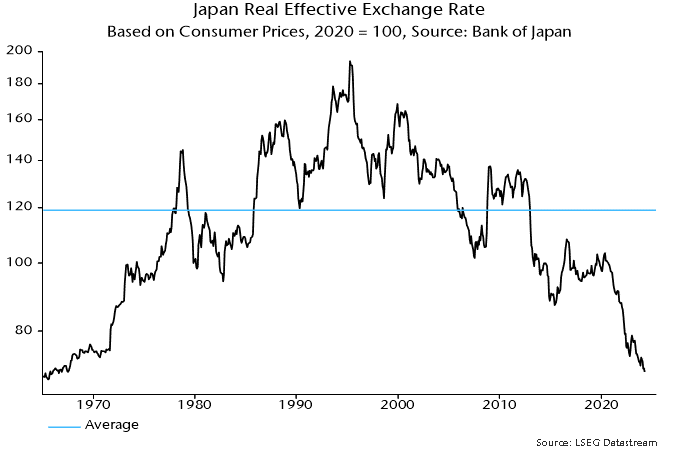
The Bank of Japan’s real effective rate index, based on consumer prices, is at its lowest level since the late 1960s – chart 3*.

Chart 3

Chart 3 showing Japan Real Effective Exchange Rate Based on Consumer Prices, 2020 = 100, Source: Bank of Japan

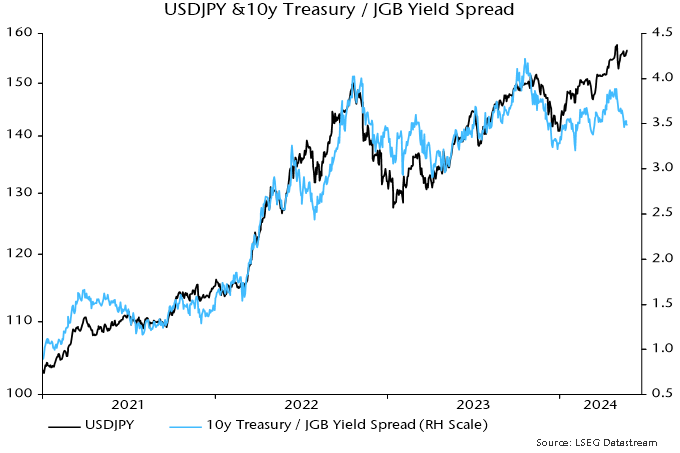
The USDJPY exchange rate has been tracking the 10-year US / Japan government yield spread but there was a negative divergence at the most recent dollar high – chart 4.

Chart 4

Chart 4 showing USDJPY & 10y Treasury / JGB Yield Spread

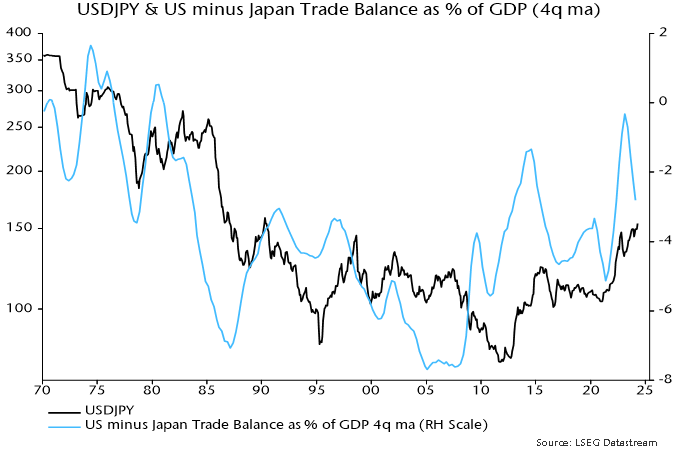
Major USDJPY turning points historically were usually preceded by a reversal in the US / Japan relative trade position, which peaked around a year ago – chart 5.

Chart 5

Chart 5 showing USDJPY & US minus Japan Trade Balance as % of GDP (4q ma)

Trade deficits have narrowed in both countries but Japan’s improvement has been sharper, reflecting greater sensitivity to lower energy costs.

US futures data show that speculators (i.e. non-commercials) have been (correctly) long the dollar since March 2021, i.e. for three years and two months. The record unbroken long position occurred between 2012 and 2016, lasting three years and three months before a major reversal – chart 6.

Chart 6

Chart 6 showing USDJPY & Speculative Futures Position* *Net Long as % of Open Interest

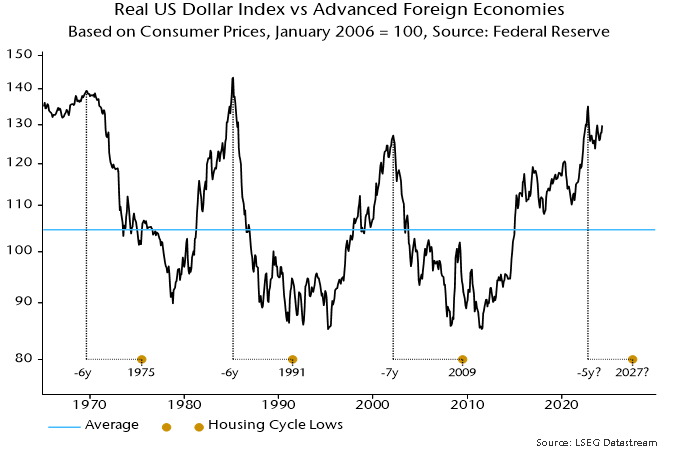
The Fed’s real dollar index against advanced foreign economies peaked in October 2022 at a 29% deviation from its long-run average, within the range at secular tops in August 1969, March 1985 and February 2002 – chart 7**. Those peaks occurred six to seven years before lows in the 18-year (average length) housing cycle. The dollar trended lower into and beyond those cycle troughs. Assuming a normal cycle length, another such low is scheduled for the late 2020s.

Chart 7

Chart 7 showing Real US Dollar Index vs Advanced Foreign Economies Based on Consumer Prices, January 2006 = 100, Source: Federal Reserve

*The BoJ index starts in 1970; earlier numbers were estimated using data on the nominal effective rate and Japanese / G7 consumer prices.

**The Fed index starts in 1973; earlier numbers were estimated using data on the nominal effective rate and US / G7 consumer prices.

Morrisson a fait part de sa plus grande réussite professionnelle de l’année dernière et de son objectif pour l’année à venir dans le dernier numéro du magazine Middle Market Growth.

Female engineer using a tablet computer at an electronics factory, monitoring the progress through online software.
Profiting as an investor occurs in the delta between expectations and reality. One example is the boom in enthusiasm for AI stocks being fuelled by blockbuster earnings of industry monopolies such as Nvidia consistently outpacing consensus forecasts.

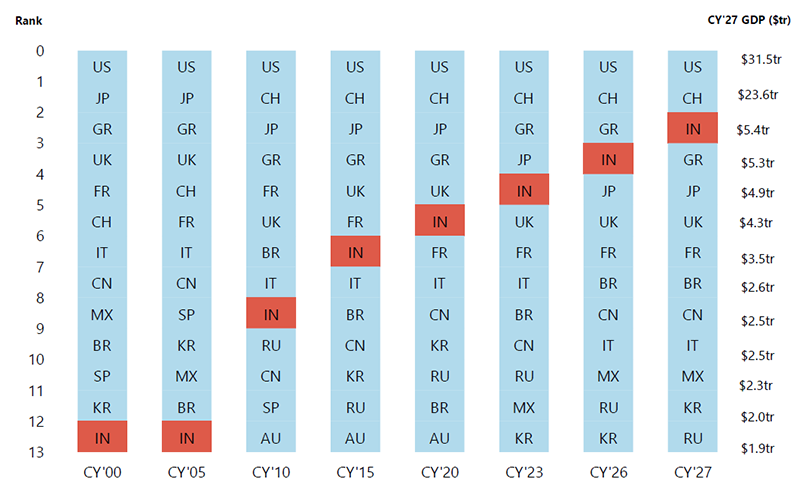
In emerging markets, India’s bull market stands out as the obvious example of this. India has long appeared perpetually expensive to investors relying on mean reversion tables. The problem with this approach is that expectations may be out of kilter with reality when there is structural change occurring – much like in the new AI frontier and the domain of the economy is expanding. The chart from Jefferies below illustrates this structural shift.

India is climbing the development ladder – on track to be the 3rd-largest economy globally
Bar graph showing India’s GDP growth from 2000 projected to 2027.
Source: Jefferies, Q1 2024.

A succession of reforms in Modi’s India is unlocking a virtuous circle of development, including:

  • Sanitation in every village empowering women in rural areas to become economic agents.
  • Establishing a nationwide digital payments network accessed through biometric identification, allowing even the illiterate to transact and access welfare payments.
  • That network allows the government to accurately calculate what taxes citizens owe, which has seen the state tax take double in around five years.
  • Higher government revenues alongside private investment are helping to fuel a new capex cycle, targeting electrification, ports, freight and telecommunications infrastructure.

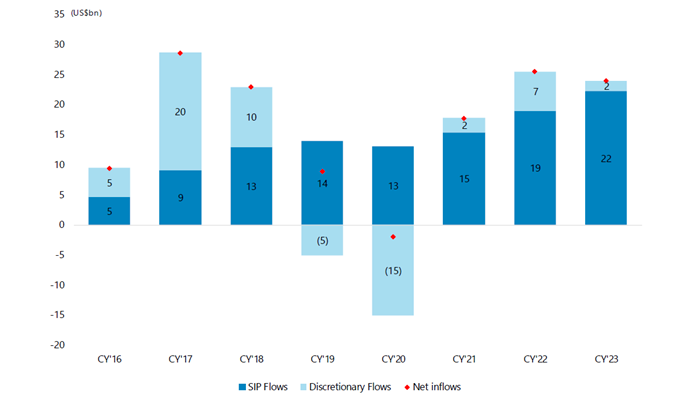
The self-reinforcing nature of these reforms fuels the growth of what will become an enormous Indian middle class, whose consumption habits will evolve as they become wealthier. This surge in new wealth is also fuelling the rise of domestic pension funds, which are biased to equities given India’s young population and long investment horizon.

Careful relying on mean reversion when there is structural change
Bar graph showing net inflows into equity mutual funds from 2016 to 2023.
Source: Jefferies, Q1 2024.

Local allocators are more incentivised than foreigners to drive Indian corporates to improve corporate governance and returns for minority shareholders. This feeds into improving domestic liquidity, where it is increasingly local allocators that set the price in Indian equities, not fund managers in London or New York.

As investment strategist Keith Woolcock pointed out a few months ago commenting on the AI boom, there are times when valuation is the “alpha and omega of investing but most often it is not.” The same applies to India, where simple mean reversion can mean that investors miss the potential for upside surprise when positive structural change is occurring.

Is the bear market over in China?

China presents us with the flipside of the above – 1) longer-run structural risks as institutional quality deteriorates under Xi Jinping, which risks the country getting stuck in the middle-income trap; 2) this deterioration depressing the animal spirits of consumers and entrepreneurs who are less confident about the future; and 3) the rigid commitment of authorities to fiscal and monetary orthodoxy even at the risk of a deflationary bust.

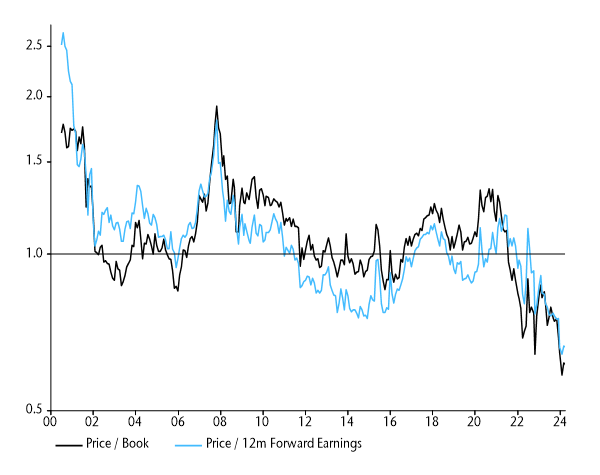
This gloomy backdrop has seen foreign investors abandon the market, with Chinese equities halving since 2021. At 10x CAPE, China now trades at a record discount to the rest of EM, pricing in a dire economic outlook.

China now trades at a record discount to the rest of EM
Line graph comparing the MSCI China Index price/book and forward P/E ratios to the MSCI EM ex China Index from 2000 to 2024.
Source: NS Partners, LSEG Datastream.

However, prices being driven to such depressed levels eventually exhausts the sellers to the point that a market can rebound even before a recovery in the economy or corporate earnings gain real steam.

Are we starting to see this in China?

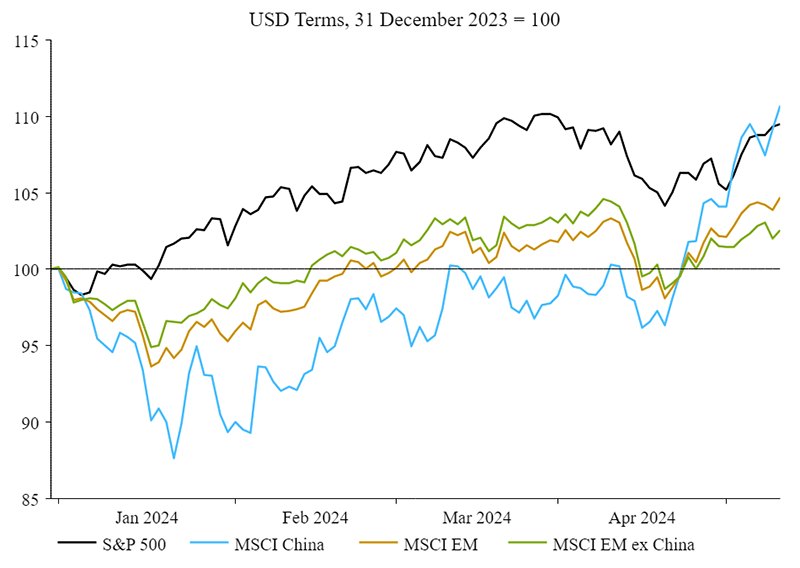
Chinese equities have outpaced even the S&P500 this year
Line graph comparing the performance of the S&P 500 Index, MSCI China Index, MSCI EM Index and MSCI EM ex China Index from January to May 2024.
Source: NS Partners, LSEG Datastream.

Chinese equities have so far outpaced even the US, including an S&P500 Index dominated by the Magnificent-7 tech giants.

We have been writing to our investors for some time about the gradual economic recovery taking place in China, the steady improvement in earnings growth among corporates, and ratcheting up of fiscal and monetary support (but without the stimulus bazooka). Animal spirits remain broadly depressed, and risks lurk within property and the banks. However, with much of this pain priced in and with positioning in China at such depressed levels, all it takes is for a slight pick up ahead of expectations to ignite a rally.

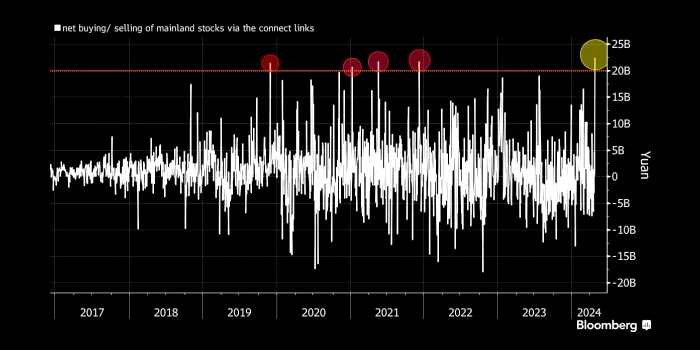
Short positioning in Chinese equities has begun to unwind (falling by a third in China A-shares over the period), while GEM managers tentatively reduce underweight positioning. Indeed, April was a record month for foreign flows into Chinese equities.

Foreign buying of China stocks tops record

Foreign flows into China equities from 2017 to 2024.
Source: Bloomberg.

There are a number of reasons to think that the rally can be sustained:

  • Positioning across GEM and global equity portfolios remains light, leaving plenty of headroom for allocators to add exposure and chase the positive momentum (forming a virtuous circle).
  • Policymakers, and most importantly Xi Jinping, have acknowledged the severity of the economic malaise and have pledged more aggressive measures to avoid a bust.
  • Company earnings are strengthening across several industries including travel, exporters and names aligned with key policy aims such as energy security, automation and import substitution.
  • The market is (finally) beginning to reward earnings beats.

This rally could carry on for some time. However, in contrast to India where we are more willing to run winners given the positive structural tailwinds driving the market, our bias is to be more conservative in China as the longer-term structural story remains negative.

China risks getting stuck in the middle-income trap so long as Xi continues to favour greater state control over rekindling the animal spirits and creative dynamism of entrepreneurs. However, much like in Japan’s lost decades, there were opportunities to take advantage of that delta between reality and depressed expectations, which precipitated sharp trading rallies. Also much like Japan, China’s deep universe of companies will offer up a rich opportunity set for active managers to generate alpha, even when running structurally lower exposure to the market.

“Gangbusters” UK GDP growth of 0.6% in Q1 may partly reflect inadequate adjustments for the leap year and early timing of Easter. In any case, the bigger story in recent national accounts data is nominal deceleration.

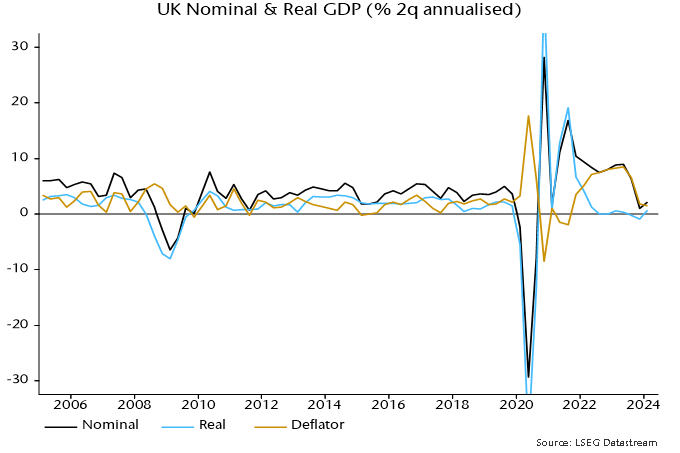
Nominal GDP rose at an annualised rate of 2.1% in Q4 and Q1 combined, down from 6.3% in the prior two quarters. With output momentum recovering slightly, the slowdown reflected a sharp fall in the rate of increase of the GDP deflator, from 6.6% annualised to 1.5% – see chart 1.

Chart 1

Chart 1 showing UK Nominal & Real GDP (% 2q annualised)

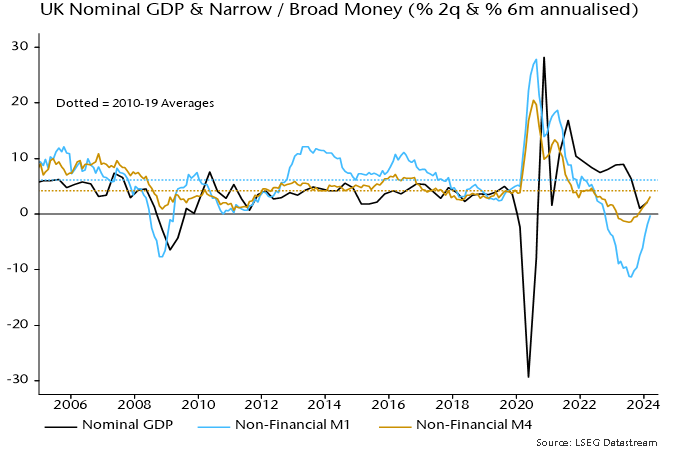
The drop in two-quarter nominal GDP momentum was signalled roughly a year ahead by falls in six-month broad and narrow money momentum into negative territory – chart 2. Money momentum has recovered since Q3 2023 but on both measures remains weaker than during the 2010s, when the GDP deflator rose at an average 1.8% pace.

Chart 2

Chart 2 showing UK Nominal GDP & Narrow / Broad Money (% 2q & % 6m annualised)

As an aside, the latest Monetary Policy Report contains a lengthy discussion of monetary developments and their relevance for policy. The strategy, as usual, is to damn with faint praise. While “broad money growth and inflation appear to have moved together over long cycles … it is harder to take an unambiguous signal about inflationary pressures from growth in the aggregate money data in isolation over shorter, policy-relevant, horizons.”

Really? Study chart 2. A directional leading relationship in rates of change is obvious. Except around the initial Covid lockdown, there are no examples of money momentum giving a seriously misleading message about future nominal GDP developments. As well as signalling the 2021-22 inflation surge, money trends warned of economic weakness / falling price pressures in 2008-09 and 2011-12, while contradicting recession forecasts following the Brexit referendum result. “Monetarists” were on the right side of the policy debate on all these occasions.

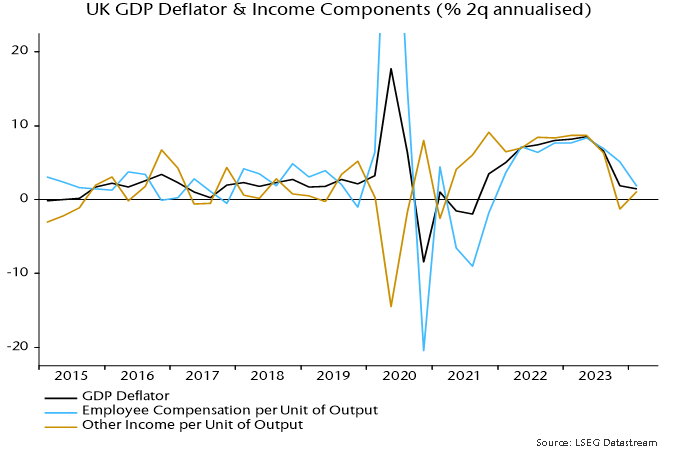
The income analysis of GDP allows movements in the GDP deflator to be attributed to changes in labour costs and broadly defined profits per unit of output. How has the recent sharp slowdown been achieved given supposedly sticky wage pressures?

According to the national accounts numbers, employee compensation per unit of output rose at an annualised rate of 1.8% in Q4 / Q1, down from 6.9% in the prior two quarters – chart 3. This slowdown is consistent with official earnings data and reflects a combination of 1) a moderation in regular earnings momentum, 2) a fall in bonus payments and 3) a pick-up in productivity (i.e. output per worker) as employment fell.

Chart 3

Chart 3 showing UK GDP Deflator & Income Components (% 2q annualised)

Profits and other “entrepreneurial” income per unit of output, meanwhile rose by only 1.1% annualised in the latest two quarters, versus 6.3% in Q2 / Q3 2023.

Domestic cost developments, therefore, are compatible with the inflation target while money growth, although recovering, remains too low. The “monetarist” view is that the MPC is behind the curve – again.

Save-on-Foods located in Town Centre, a newly constructed shopping centre in Calgary, Alberta.

Crestpoint Real Estate Investments Ltd., in partnership with the Trinity Retail Fund, is pleased to announce the completion of two new retail investments: Town Centre and the Cornerstone Retail Portfolio, both situated in and around Calgary, Alberta. These investments are strategically located, host a premium roster of well-known national tenants and are nestled near residential areas that attract substantial consumer traffic.

Town Centre, a newly constructed shopping centre spanning approximately 138,000 sq. ft. in the master-planned community of Trinity Hills near Canada Olympic Park, is anchored by Save-on-Foods and includes a variety of well-known national tenants, such as Dollarama, PetSmart, Bulk Barn and Sleep Country. Located near the Trans-Canada Highway and Sarcee Trail SW, the centre provides tenants with exposure to over 60,000 vehicles daily and is adjacent to a community projected to reach around 4,000 residential units.

The Cornerstone Retail Portfolio consists of two open-format, grocery-anchored retail properties in Olds and Okotoks, Alberta, measuring approximately 113,000 sq. ft. and 157,000 sq. ft., respectively. Combined, the two-asset portfolio covers 33 acres with a leasable area of approximately 270,000 sq. ft. About 98% of the space is leased to a premium roster of national tenants offering high-quality everyday essentials, including Sobeys, Canadian Tire, Staples, Dollarama, Mark’s and several leading banks. Both locations also benefit from their proximity to Walmart “Superstores.”

Crestpoint, on behalf of the Crestpoint Core Plus Real Estate Strategy (its open-end fund), has a 75% interest in Town Centre and the Cornerstone Retail Portfolio, with Trinity Retail Fund holding the remaining 25%. These acquisitions enhance the fund’s diversity and increase Crestpoint’s total assets under management to over $10 billion.

Bingham Canyon copper mine, largest man-made hole in the world, Utah, USA.

The new dynamics of the global materials market

We recently attended the BMO Global Metals, Mining & Critical Minerals 2024 Conference, the premier global event for the materials sector. Materials make up 8% of the MSCI Global Small Cap Index and 10% of the MSCI EAFE Small Cap Index. Mining conferences are like no other, featuring core shack displays and political representatives from various countries. The atmosphere was notably different this year, particularly with the decline in battery material prices. There was a noticeable shift of interest from car battery to electrical grid infrastructure materials.

Supply and demand at play in commodities prices

Returns in the materials sector generally correlate with the supply-demand dynamics of various commodity prices. Inflation typically indicates an overall demand driver. However, it has not been very impactful, as China, a major commodity buyer, is experiencing modest inflation growth. Commodity supply dynamics are highly influenced by regulatory events, including environmental, social, geopolitical factors, capital availability and project risks. Recently, we have observed events that could signal mid to long-term structural changes.

Copper and aluminum: metals on the move

Copper has been performing well due to both future demand and supply side momentum. Essential to data computing, it has been rebranded as “AI copper.” Additionally, the growth in electricity demand and closure of the world’s largest copper mine are factors pushing prices to new highs.

Aluminum can substitute copper, especially in electrical transmission, as its resistivity is 0.6 times that of copper such that aluminum wire is 66% larger. The prices of both commodities tend to correlate. Currently, the price spread between the two is considered large from a historical perspective, with copper trading at $4.57 and aluminum at $1.17, making aluminum an economically viable substitution.

Our investment in Alumina

Global Alpha is exposed to aluminum through our stake in Alumina (AWC AU). Based in Australia, the company is the largest producer of alumina metal, a key precursor to aluminum. AWC shareholders have recently agreed to accept the all-share acquisition proposal by Alcoa, its long-term operating partner. With a more vertically integrated operation, Alcoa plans to reduce overall costs by 10% within a short two-year period. Aluminum is also widely used in the aerospace sector, which provides another tailwind.

Gold and copper in traditional and emerging markets

Copper is often mined alongside gold. Gold, which had been out of favour since 2011, is seeing renewed interest and positive investor sentiment, driven by purchases from central banks in China and established investor circles, with both buying the bullion at a faster pace than in the past. This trade is a win-win. If China’s economy falters compared to its US counterpart, gold becomes a safe alternative. Conversely, if China’s economy outperforms, the race to distance itself from the US dollar intensifies. Despite China’s cryptocurrency ban, there are rumours that this commodity accumulation is in preparation for a devaluation of the yuan, though time will tell. Other countries, like Turkey and Poland, have also increased their gold reserves for similar geopolitical reasons.

Globally, we produce 3,100 tons of gold annually and it estimated that there are 205,000 tons of gold in circulation – half in jewelry, 25% in investments and 15% held by central banks. In 2023, China’s government bought a record 735 tons. The private sector net imported 1,411 tons, with an impressive 228 tons coming in just January of 2024.

The golden balance of central banks and global stock

For central banks, there is room to grow for China as it ranks fifth with 2,200 tons in its vaults today compared to the US at 8,100 tons. The below-ground stock of gold reserves is currently estimated at around 50,000 tons according to the US Geological Survey.

This equates to a 15-year mine life for the world’s gold demand. As gold deposits become increasingly difficult to locate, this global gold mine life will likely diminish rapidly. In this context, gold could become a strong competitor to digital currencies in the coming years as a safety alternative.

ALS Ltd. and commodity markets

Global Alpha is exposed to gold, copper and other commodities through ALS Ltd. (ALQ.AU). ALS is the market leader in mining assay management, helping companies with their sample testing requirements. With industry-leading margins in precious metals, ALS has achieved the necessary scale in all major global mining hubs, giving it significant competitive advantage. ALS also operates in the environmental and health care sectors, where it benefit from its global reach compared to smaller competitors.

Capitalizing on commodity upswings with Osisko Gold Royalties

We also own Osisko Gold Royalties (OR.CN). The company holds gold and base metal royalties in North America. Royalties are intriguing financial instruments as they are paid in product by miners and are largely unaffected by mining costs, allowing royalty companies to benefit from rising commodity prices. Last year, the company hired a highly reputable management team and simplified its structure by exiting all direct project investments.

Gold and iron ore stability vs. disruption

In the gold market, central banks act as fringe buyers and sellers and are the price setters. Although jewelry accounts for the bulk of market demand, consuming 2,000 tons annually, its growth is relatively muted and stable.

The same concept of stability and fringe actors applies to iron ore. The world consumes two billion tons per year and China-based mills account for 50% of that. Production of 1.1 billion tons is controlled by five companies with fairly stable output. Fringe producers contribute 300 million tons, including high-cost producers in China and Southeast Asia that have benefitted from robust pricing over the years. However, the iron ore price balance is poised for disruption as 200 million tons of low-cost production is expected to enter the market in 2026 from mega projects in Guinea and Australia.

Silver and palladium redefined

Other interesting points from the conference that could orient our research include insights on silver and palladium. It takes five times more palladium to build a hybrid than a regular car. Silver has now surpassed a 50% usage rate in industrial applications, prompting a reevaluation of its classification as a precious metal.

Beyond precious – the future of metals

All of these developments invite us to rethink the boundaries of “precious” in metals and the value of agility and foresight in investing. As markets shift and new technologies demand novel materials, our approach to commodities must also adapt. This not only offers opportunities for astute investors but also challenges us to anticipate changes and position ourselves advantageously for what lies ahead.

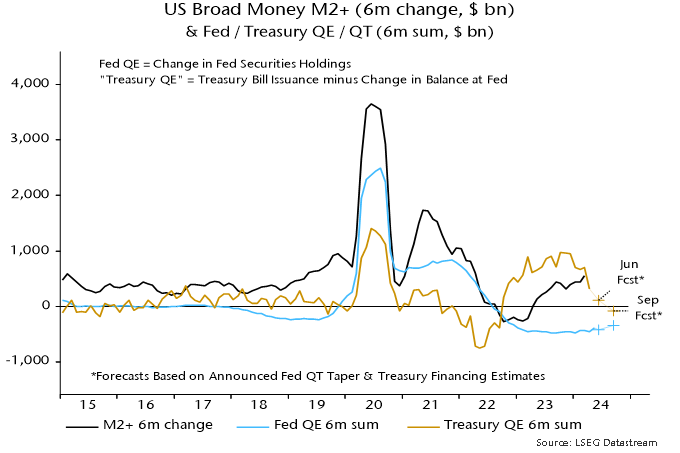
post in February argued that US Treasury plans to reduce reliance on bills to fund the deficit implied weaker monetary expansion from Q2, with possible negative implications for markets and economic prospects. This scenario remains on track.

The Treasury last week confirmed a reduction in the stock of Treasury bills in Q2 while signalling small-scale issuance in Q3.

Deficit financing via bills rather than coupon debt tends to boost the broad money stock because bills are mostly bought by money-creating institutions, i.e. banks and money funds. Their purchases are usually associated with expansion of their balance sheets, with a corresponding increase in monetary liabilities.

Broad money also tends to rise when the Treasury finances the deficit by running down its cash balance at the Fed.

Both effects were in play in 2023 / early 2024, resulting in a large monetary boost from Treasury operations that more than offset the Fed’s QT – see chart 1.

Chart 1

Chart 1 showing US Broad Money M2+ (6m change, $ bn) & Fed / Treasury QE / QT (6m sum, $ bn)

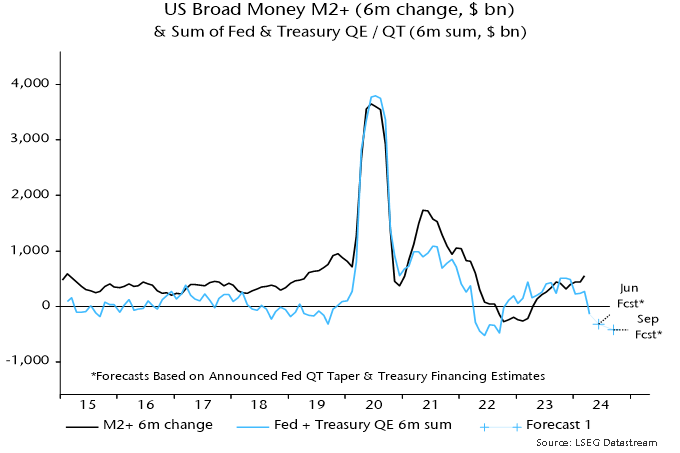
The latest Treasury estimates, however, imply a small negative impact in Q2 / Q3 combined. The earlier post argued that the Fed would need to halt QT to offset this shift. Last week’s taper announcement was insufficient, implying that the combined Treasury / Fed influence is likely to turn significantly contractionary – chart 2.

Chart 2

Chart 2 showing US Broad Money M2+ (6m change, $ bn) & Sum of Fed & Treasury QE / QT (6m sum, $ bn)

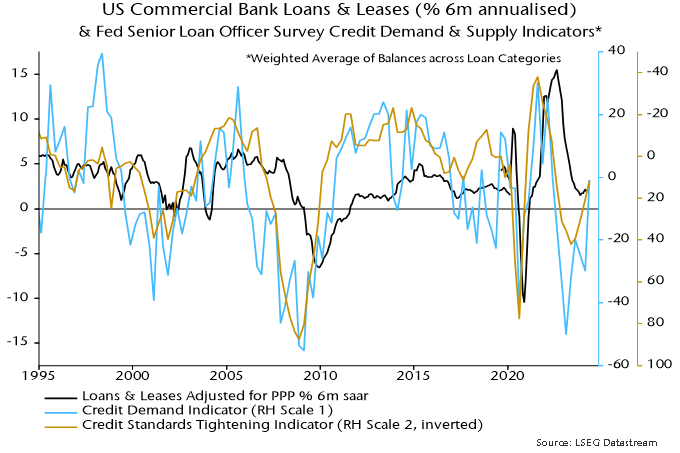
Will a revival in bank lending neutralise the Treasury / Fed drag? The Fed’s April senior loan officer survey was less negative but demand and supply balances remain soft by historical standards, arguing against a strong pick-up – chart 3.

Chart 3

Chart 3 showing US Commercial Bank Loans & Leases (% 6m annualised) & Fed Senior Loan Officer Survey Credit Demand & Supply Indicators* *Weighted Average of Balances across Loan Categories

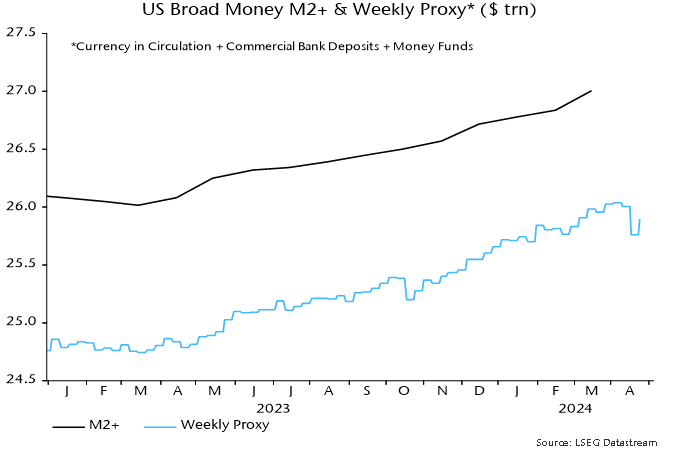
April monetary statistics will be released in late May but weekly numbers on currency, commercial bank deposits and money funds are consistent with emerging weakness  – chart 4.

Chart 4

Chart 4 showing US Broad Money M2+ & Weekly Proxy* ($ trn) *Currency in Circulation + Commercial Bank Deposits + Money Funds

Panneaux solaires sur un champ agricole par une journée ensoleillée.

La hausse des températures, attribuable à l’augmentation des niveaux de gaz à effet de serre (GES) dans notre atmosphère, jette une ombre sur l’avenir de notre planète. L’inaction pourrait avoir des conséquences désastreuses, créant un contexte de risques physiques et économiques. La cause fondamentale du problème est l’activité humaine, et plus particulièrement les émissions de dioxyde de carbone (CO2) provenant de la combustion de combustibles fossiles. La gravité de la situation retient l’attention à l’échelle mondiale, incitant les gouvernements du monde entier à s’engager à réduire les émissions de GES dans le cadre d’un effort collectif visant à freiner la hausse de la température de la Terre.

La solution à ce défi sans précédent va bien au-delà des promesses gouvernementales et des politiques publiques. Elle dépend également du soutien et de l’engagement proactif des entreprises, des investisseurs et de la population. La transition énergétique est un élément essentiel de la lutte contre les changements climatiques, qui implique une transition de la dépendance aux systèmes à base d’énergie fossile, comme le pétrole et le charbon, vers les énergies renouvelables comme l’énergie éolienne, l’énergie solaire et les technologies de stockage d’énergie à grande échelle. La transition vers des solutions énergétiques à plus faible intensité en carbone jouera un rôle déterminant dans tout plan d’action sur les changements climatiques. Le présent article fournit des renseignements généraux sur les enjeux et le rôle de la transition énergétique dans le contexte plus large des changements climatiques.

Comprendre les GES : La cause sous-jacente du réchauffement de la planète

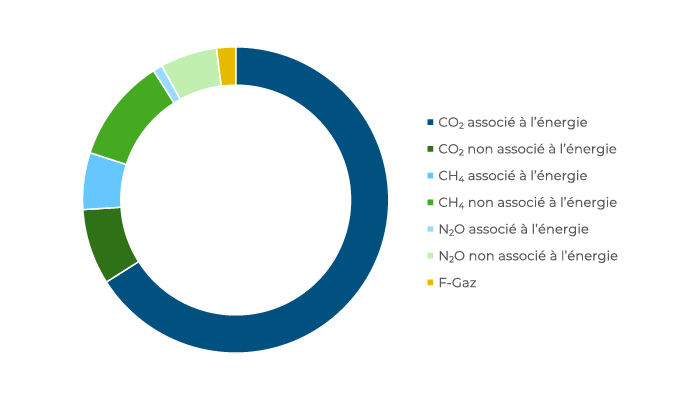
Le plan d’action sur les changements climatiques est principalement axé sur la lutte contre les émissions de CO2 associé à l’énergie dans l’atmosphère, qui représentent la majorité des émissions de GES (figure 1). Ces émissions de CO2 sont largement attribuables aux combustibles fossiles qui produisent notre électricité et nos systèmes de chauffage et de climatisation, et qui alimentent nos activités de transport. Les autres émissions liées à l’énergie comprennent le méthane (CH4) et l’oxyde de diazote (N2O), tandis que les GES non liés à l’énergie restants sont principalement associés à l’agriculture.

Figure 1 – Émissions mondiales de GES
Diagramme circulaire des émissions de gaz à effet de serre par type.
Source : Climate Watch, World Resources Institute (2016).

Il est important de garder à l’esprit que les GES ne sont pas nécessairement une mauvaise chose. En fait, ils fonctionnent comme une couverture thermique qui réchauffe la Terre et sont essentiels à la survie de l’espèce humaine. Sans les GES, notre planète serait inhabitable. Toutefois, l’augmentation des niveaux de GES limite l’efficacité de la couverture thermique et représente la préoccupation sous-jacente du réchauffement de la planète, et c’est la raison pour laquelle l’accent est mis sur la lutte contre les émissions de CO2 associées à l’énergie.

Transitions énergétiques à travers les siècles

Dans le passé, les transitions énergétiques étaient de longs processus alimentés par les forces combinées de la croissance économique et de l’augmentation de la demande d’énergie. La première transition majeure, qui s’est échelonnée sur plus d’un siècle, a eu lieu dans les années 1800, lorsque les biocarburants traditionnels (principalement le bois) ont été remplacés par le charbon. Au milieu des années 1970, un autre changement important a été annoncé avec le développement et l’adoption de produits pétroliers raffinés. Au cours des 30 années suivantes, les combustibles fossiles ont été la principale source d’énergie jusqu’aux 20 dernières années, alors que la dépendance au gaz naturel a augmenté.

Ces transitions passées étaient motivées par la prospérité économique et l’augmentation implicite de la consommation d’énergie dans les pays développés et en développement. La transition énergétique actuelle est différente et plus complexe. La réussite de la transition énergétique mondiale actuelle dépend de sa capacité à assurer l’accès à l’énergie pour favoriser la croissance économique et le développement, tout en s’attaquant à la décarbonisation pour atténuer les répercussions des changements climatiques.

Une plus grande menace à l’égard des changements climatiques

Les premières études sur les conséquences des changements climatiques se concentrent souvent sur les risques environnementaux, mais les conséquences négatives sont beaucoup plus larges, et comprennent les impacts physiques et répercussions de la transition qui touchent les collectivités, les entreprises, les marchés financiers et les citoyens.

Les changements climatiques à long terme entraînent une augmentation de la fréquence et de la gravité des événements extrêmes comme les tempêtes et les inondations. Ces événements peuvent causer des dommages et des perturbations aux résidences et aux entreprises, en plus des répercussions financières, comme une hausse des coûts d’assurance. À divers degrés, la plupart des secteurs devraient être touchés par les risques associés aux changements climatiques, et confrontés à des difficultés financières directes et indirectes en raison de dommages physiques, d’interruptions opérationnelles et de perturbations de la chaîne d’approvisionnement. La Banque d’Angleterre a également souligné que les conséquences des changements climatiques représentent une grave menace pour la stabilité du système financier en raison de leur nature étendue et de leur exposition généralisée aux institutions financières et aux propriétaires d’actifs.

La menace généralisée des changements climatiques a incité les gouvernements du monde entier à reconnaître la nécessité de favoriser les changements de comportement et de soutenir la transition énergétique. Des initiatives comme l’Accord de Paris conclu en 2015 fixent des objectifs à long terme pour la réduction des GES, les gouvernements ayant de plus en plus recours à des mesures d’incitation économiques et à des règlements pour encourager l’abandon des combustibles fossiles. Contrairement à la réponse mondiale concertée à la pandémie de COVID-19, la réponse aux changements climatiques manque d’uniformité en raison de facteurs économiques, politiques et sociaux variés dans différentes régions du monde. Toutefois, une meilleure coordination sera nécessaire pour atténuer et gérer la menace que représente le réchauffement de la planète.

Risques et occasions concernant la transition énergétique

Souvent, on aborde les risques et les occasions comme des concepts opposés. Toutefois, il ne s’agit pas nécessairement de concepts opposés; une occasion peut aider à gérer un risque particulier. Telle est la situation en ce qui concerne les changements climatiques et le rôle de la transition énergétique. Les occasions de transition dans le secteur de l’énergie peuvent toucher toutes les catégories d’actif et tous les secteurs, mais les occasions les plus importantes devraient provenir de stratégies d’infrastructures permettant d’offrir des solutions à faible émission de carbone.

La transition d’un système énergétique dépendant des combustibles fossiles vers des sources d’énergie plus propres et renouvelables nécessitera des investissements de billions de dollars, et cela pourrait être l’une des plus vastes et importantes occasions d’investissement des prochaines décennies. On s’attend à ce que les investissements annuels dans le secteur de la transition énergétique, qui sont actuellement d’environ 1 billion de dollars américains, dépassent en moyenne 3 fois ce montant au cours du reste de la décennie.*

L’ampleur de l’investissement supplémentaire alimentera la croissance des occasions dans un éventail d’actifs et d’entreprises d’infrastructures pendant de nombreuses années. De toute évidence, les solutions d’infrastructure comprendront le développement et la réalisation de projets d’énergie propre. Toutefois, en raison de l’importance du défi des changements climatiques, il sera nécessaire d’englober un univers beaucoup plus vaste d’actifs, y compris la facilitation des solutions d’infrastructures et la décarbonisation des infrastructures existantes.

Développer et instaurer une énergie plus propre

Pour les solutions d’infrastructures à faible émission de carbone, les occasions naturelles comprennent le développement et la construction de projets d’énergie propre renouvelable, comme les centrales d’énergie éolienne, solaire et hydroélectrique au fil de l’eau. Bien que l’on reconnaît maintenant l’importance des autres piliers dans la lutte contre les changements climatiques, les solutions d’énergie renouvelable ont conservé leur position de secteur le plus important en 2022.*

Mettre en place des solutions durables et favoriser les infrastructures

La transition énergétique s’étendra bien au-delà des systèmes énergétiques de base. Elle nécessitera la mise en œuvre d’une gamme de solutions durables, notamment la construction de systèmes de stockage dans des batteries, d’infrastructures de recharge de véhicules électriques et de systèmes de chauffage et de climatisation géothermique dont l’intensité en carbone est moins élevée que celle des chaudières à gaz classiques, pour réduire les émissions dans une plus large mesure.

Décarboniser les infrastructures existantes

L’autre pilier clé du domaine des actifs est la décarbonisation des infrastructures existantes, ce qui nécessite une approche active et pratique pour la transition des actifs des modèles d’affaires à forte intensité en carbone vers des solutions de rechange plus vertes appuyées par différentes stratégies, comme les changements apportés aux processus de production, l’électrification des systèmes, l’adoption de sources de carburant plus propres et l’utilisation du captage et du stockage du carbone. Par exemple, le financement de l’électrification d’une flotte de véhicules. Un autre investissement potentiel serait la transformation d’une infrastructure de production alimentée au gaz, où il serait possible de combiner, et finalement de remplacer, la charge d’alimentation du gaz naturel avec de l’hydrogène vert pour produire de l’électricité à faible teneur en carbone, et éventuellement, carboneutre.

La transition énergétique ne peut être couronnée de succès sans le financement et le leadership des propriétaires pour stimuler la transformation des infrastructures existantes. Bien que certains investisseurs pourraient prévoir d’emblée des exclusions pour des secteurs entiers, comme le charbon, le gaz naturel ou le pétrole, nous nous attendons à ce que bon nombre d’entre eux revoient leurs positions et adoptent une approche plus souple qui leur permettrait de profiter d’une certaine exposition lorsqu’un plan de transition crédible et réalisable est en cours pour l’investissement.

Saisir l’occasion de transition énergétique

Il devient de plus en plus important d’investir dans des infrastructures liées à la transition énergétique, et il est urgent d’investir des capitaux substantiels pour soutenir les efforts de décarbonisation et atteindre les objectifs mondiaux en matière de lutte contre les changements climatiques. Les investissements dans les infrastructures de transition énergétique offrent aux investisseurs institutionnels un accès à un éventail d’occasions et, comme la transition énergétique devrait avoir une incidence sur tous les secteurs et pays, il est impératif que les comités de placement gardent à l’esprit les risques et les occasions, ainsi que le rôle de la transition énergétique dans la lutte contre les changements climatiques.

*Source : BloombergNEF, Energy Transition Investment Trends 2023.

Documents sources :
Climate change: A primer for investors, LCP, 2021.
Energy Transition 101, World Economic Forum, 2020.
What is Energy Transition, S&P Global, 2020.

Abonnez-vous aux mises à jour

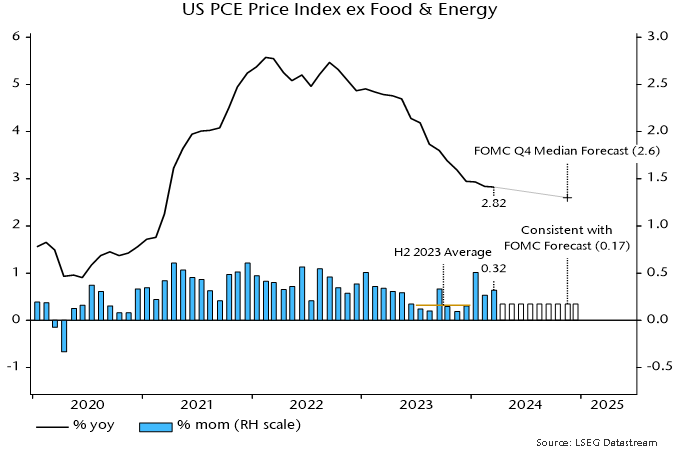
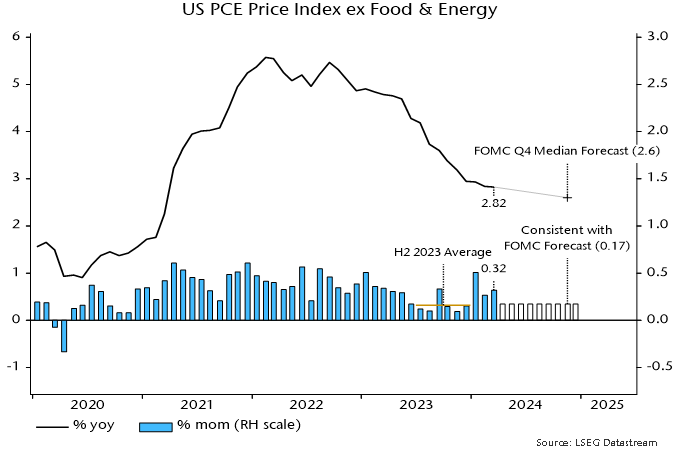
The Fed’s preferred core price measure – the PCE price index excluding food and energy – rose by an average 0.36% per month, equivalent to 4.4% annualised, over January-March.

The FOMC median projection in March was for annual core inflation to fall to 2.6% in Q4 2024. This would require the monthly index rise to step down to an average 0.17% over the remainder of the year – see chart 1.

Chart 1

Chart 1 showing US PCE Price Index ex Food & Energy

The judgement here is that such a slowdown is achievable and could be exceeded, based on the following considerations.

First, such performance was bettered in H2 2023, when the monthly rise averaged 0.155%, or 1.9% annualised, i.e. the requirement is within the range of recent experience.

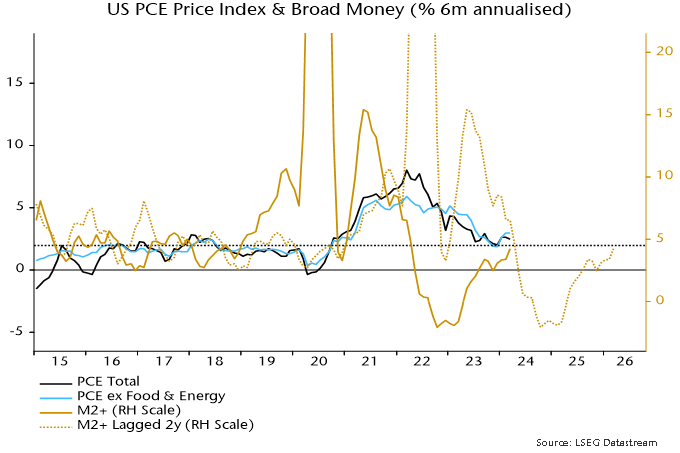
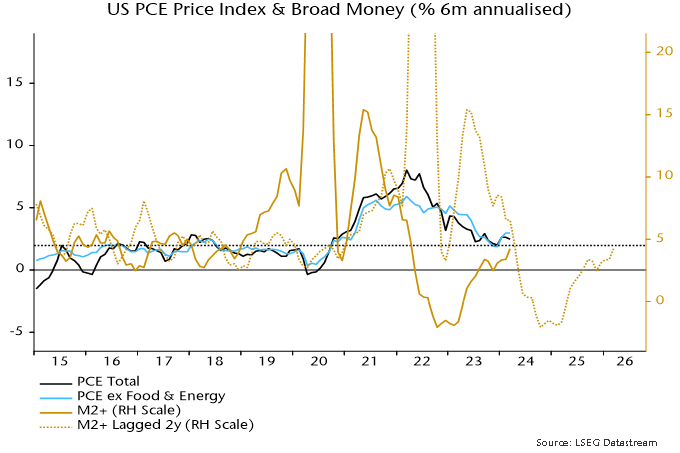
Secondly, the monetarist rule of thumb of a two-year lead from money to prices suggests a strong disinflationary impulse during H2 2024. From this perspective, any current “stickiness” may reflect the after-effects of a second pick-up in six-month broad money momentum in 2021, following the initial surge into mid-2020– see chart 2.

Chart 2

Chart 2 showing US PCE Price Index & Broad Money (% 6m annualised)

Momentum returned to a target-consistent 4-5% annualised in April 2022, subsequently turning negative and recovering only from March 2023, with the latest reading still sub-5%. Allowing for the usual lag, the suggestion is that six-month price momentum will move below 2% in H2 2024, remaining weak through next year.

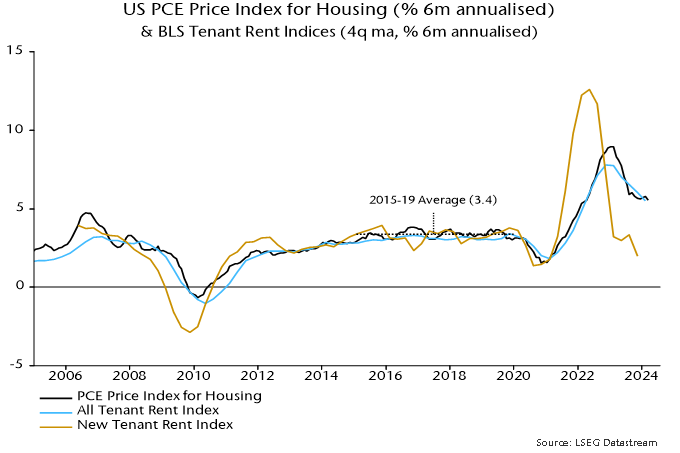
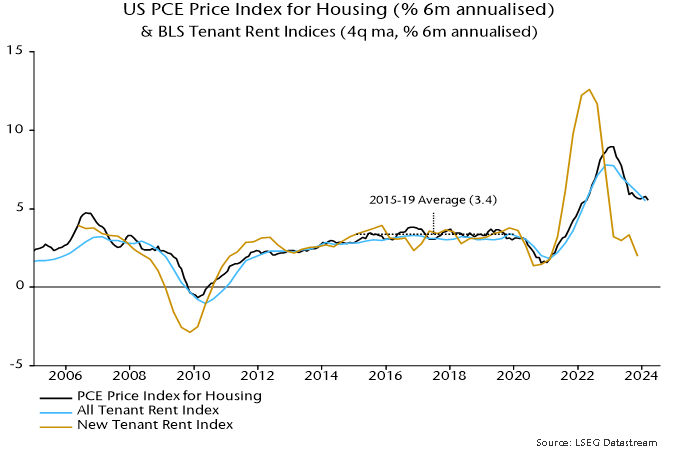
A third potential favourable influence is a speeding-up of the transmission of recent slower growth of timely measures of market rents to the PCE housing component. Six-month momentum of the latter was still up at 5.6% annualised in March but weakness in the BLS new tenant rent index through 2023 is consistent with a return to the pre-pandemic (i.e. 2015-19) average of 3.4% or lower – chart 3. With a weight of 17.5%, such a decline would subtract 3 bp from the monthly core PCE change.

Chart 3

Chart 3 showing US PCE Price Index for Housing (% 6m annualised) & BLS Tenant Rent Indices (4q ma, % 6m annualised)