Alors qu’à la fin de 2025, les commentaires sur les marchés portaient sur la durabilité des valorisations élevées des actions américaines à mégacapitalisation du secteur des technologies de l’information, les actions canadiennes ont affiché un rendement nettement supérieur, comme il est illustré ci-dessous. Ce phénomène ne s’est pas limité aux actions à grande capitalisation, l’indice des titres à petite capitalisation TSX ayant bondi de 50,2 %, surpassant l’indice Russell 2000 à 7,5 % en $ CA.
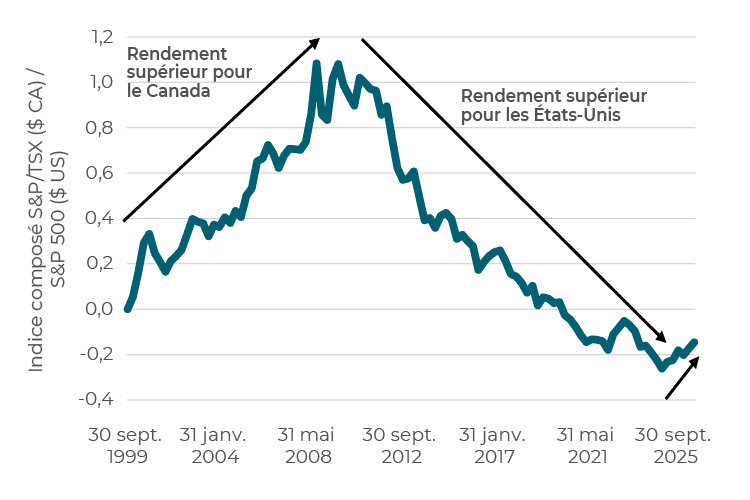
Solide année pour les actions canadiennes
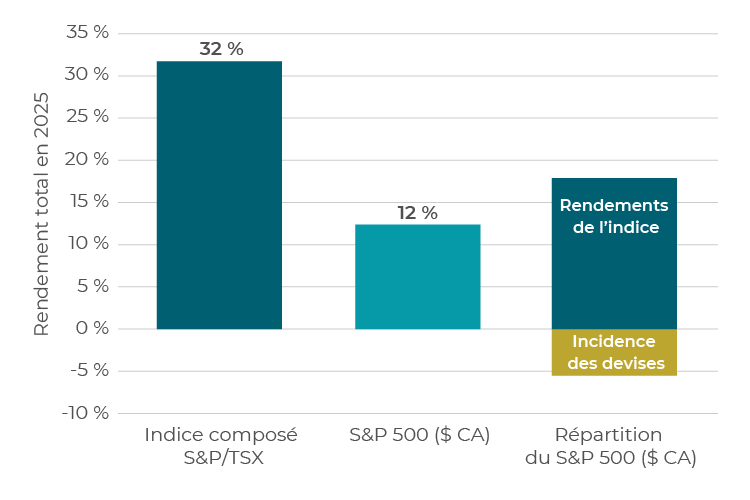
Source : S&P Global Intelligence.
Nous pourrions considérer 2025 comme un point d’inflexion positif pour l’économie canadienne, car plusieurs facteurs sont maintenant en place pour améliorer les perspectives de croissance future.
Rotation des meneurs du marché — souvent pour de longues périodes
L’histoire montre que les marchés boursiers canadiens et américains connaissent de longs cycles de surperformance et de sous-performance relatives. Les actions américaines ont inscrit des rendements supérieurs pendant plus de 10 ans après la crise financière mondiale jusqu’à tout récemment, tandis que les actions canadiennes ont inscrit des rendements supérieurs au cours des 10 années et plus qui ont suivi l’éclatement de la bulle technologique à la fin des années 1990 :
Rotation des meneurs du marché sur de longues périodes
Source : Bloomberg.
Les arguments en faveur d’une surperformance durable des actions canadiennes
Bien que les cycles de rendement relatifs soient difficiles à prévoir, plusieurs facteurs favorables devraient soutenir la surperformance du Canada à l’avenir.
1. L’économie canadienne à un point d’inflexion
La baisse de la productivité au Canada durant la décennie perdue de 2015 à 2025 est bien documentée, tout comme les défis auxquels l’économie intérieure est confrontée en raison de l’évolution du nationalisme et de la politique commerciale des États-Unis. Toutefois, nous pourrions considérer 2025 comme un point d’inflexion positif pour l’économie canadienne, car plusieurs facteurs sont maintenant en place pour améliorer les perspectives de croissance :
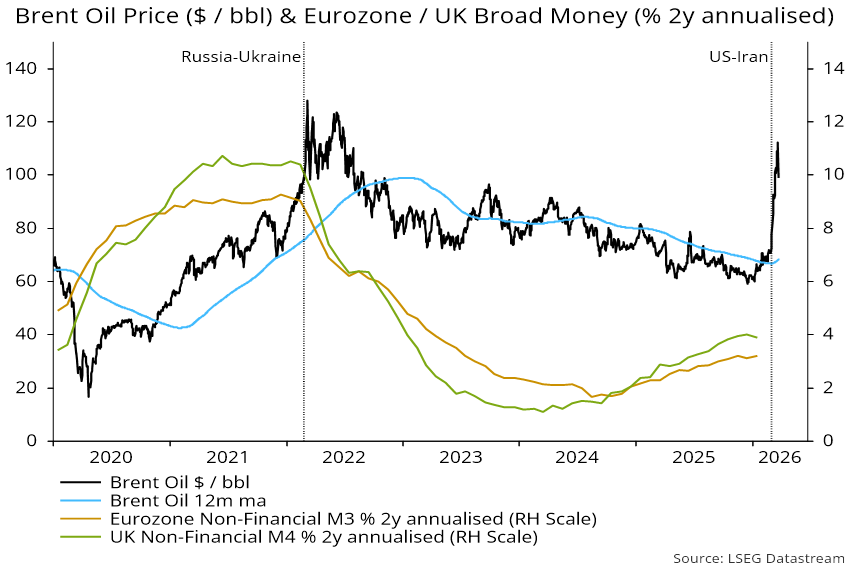
- Exposition structurelle aux secteurs de croissance à long terme : Le Canada a une exposition démesurée aux secteurs de l’énergie et des matériaux, qui sont essentiels à la hausse de la demande mondiale d’électricité. L’électrification, les infrastructures d’IA et les investissements dans les réseaux stimulent la demande soutenue de cuivre, de gaz naturel et d’uranium, tandis que des années de sous-investissement limitent l’offre. De plus, la démondialisation et les politiques commerciales protectionnistes augmentent le risque d’une hausse persistante de l’inflation, ce qui fait grimper les prix des métaux précieux.
- La politique budgétaire est passée d’un facteur défavorable à un facteur favorable : Les récentes mesures commerciales des États-Unis ont accéléré le changement d’approche budgétaire du Canada. Le nouveau gouvernement fédéral dirigé par le premier ministre Carney poursuit un programme plus axé sur la croissance et les entreprises, axé sur l’investissement, les dépenses ciblées et les allégements fiscaux. Nous estimons que ces mesures pourraient ajouter environ 40 pb à la croissance du PIB chaque année à moyen terme, ce qui représente un point d’inflexion économique évident.
- La politique monétaire est maintenant résolument favorable : La Banque du Canada a réduit les taux de près de 300 pb au cours des 18 derniers mois, ramenant résolument sa politique monétaire en territoire expansionniste. L’assouplissement des conditions financières devrait favoriser la croissance, les placements et les bénéfices sur le marché boursier canadien.
2. Dynamique intéressante des marchés boursiers
L’amélioration de la croissance économique ne se traduit pas toujours par une surperformance des marchés boursiers. L’indice composé S&P/TSX présente toutefois plusieurs caractéristiques uniques qui sont de bon augure pour son rendement futur :
Valorisations intéressantes et composition sectorielle intéressante
Le ratio C/B plus faible du TSX par rapport à l’indice S&P 500 est souvent attribué à sa plus faible exposition aux titres à grande croissance et à mégacapitalisation liés aux technologies de l’information. Bien que la pondération des titres technologiques soit beaucoup plus importante au sein de l’indice S&P 500, les investisseurs pourraient être surpris d’apprendre que presque tous les secteurs sont évalués de façon plus attrayante au sein de l’indice TSX, malgré des estimations très semblables pour la croissance des bénéfices en 2026, comme il est illustré ci-dessous :
Forte croissance prévue des bénéfices en 2026
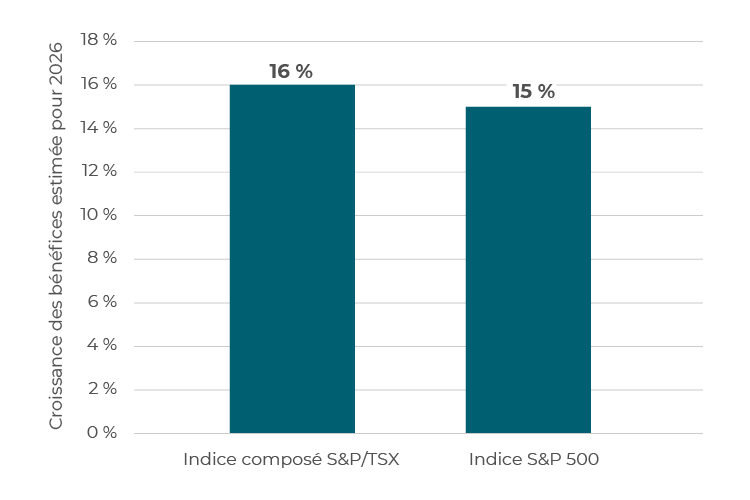
Source : Bloomberg au 31 décembre 2025.
 |
« Notre équipe est aussi enthousiaste que depuis au moins dix ans à l’égard des perspectives des actions canadiennes. Nous trouvons des occasions à grande, à moyenne et à petite capitalisation qui devraient continuer de profiter de l’émergence de plusieurs facteurs positifs à long terme. Le moment est bien choisi pour investir au Canada. »Michael McPhillips, gestionnaire de portefeuille, cochef des placements et directeur de la recherche, Stratégies fondamentales d’actions |
|---|
Les valorisations au Canada sont plus intéressantes au niveau des indices et des secteurs
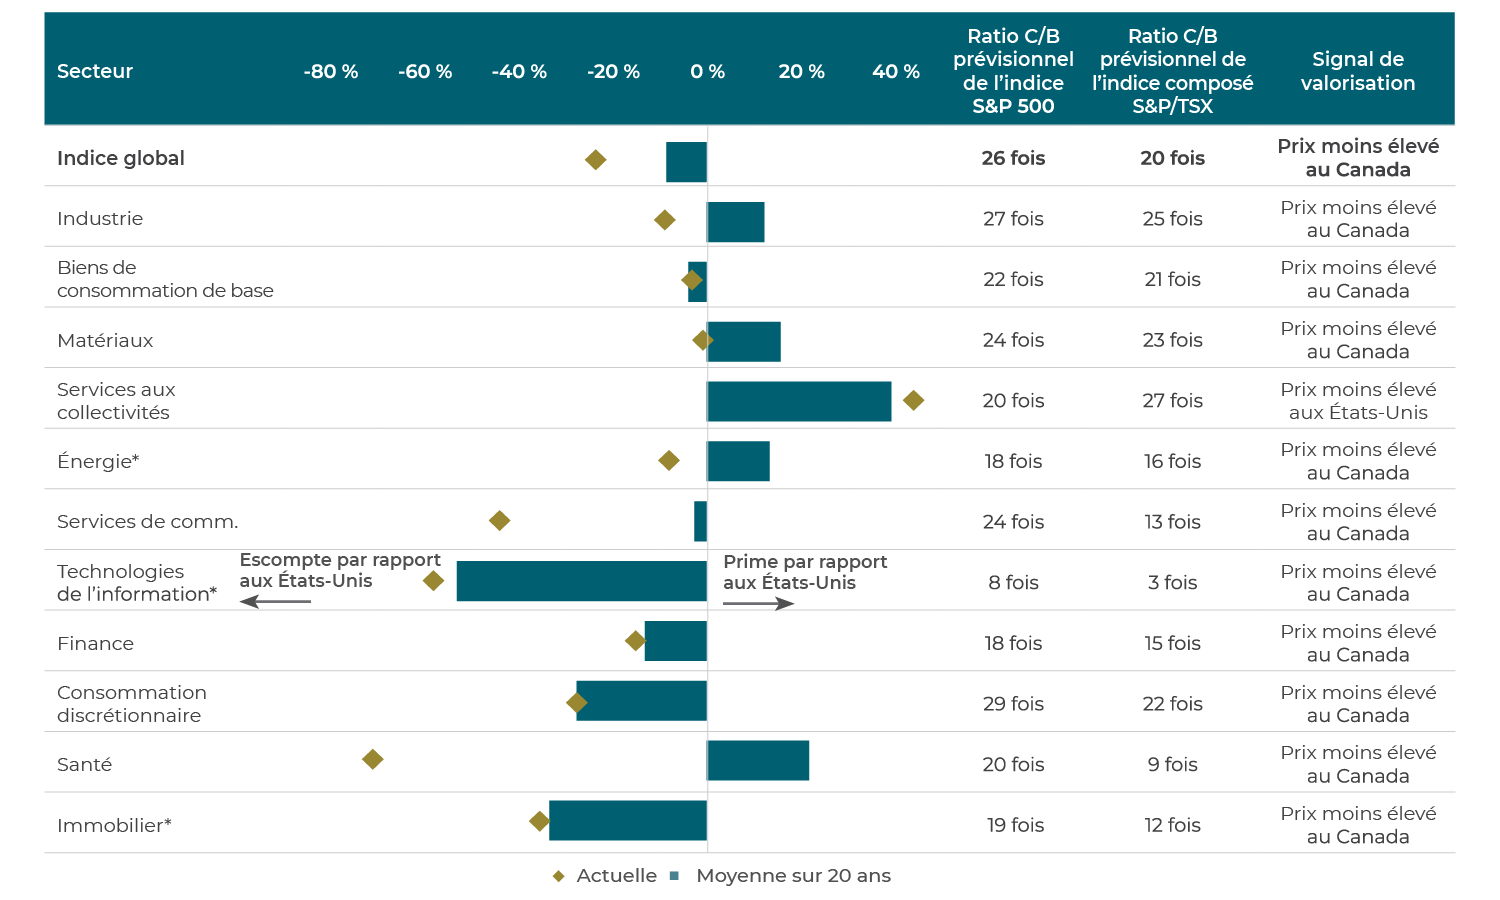
Source : Bloomberg, *pour l’immobilier à l’aide du ratio C/B prévisionnel, pour la technologie à l’aide du ratio VE/ventes prévisionnel, pour les services aux collectivités à l’aide du ratio VE/BAIIA prévisionnel et pour l’énergie à l’aide du ratio C/FT prévisionnel. Données au 31 décembre 2025.
Exposition démesurée à la production d’électricité et aux producteurs d’or
Le leadership des États-Unis dans le secteur des technologies s’ajoute à la vigueur des produits de base et des banques au Canada
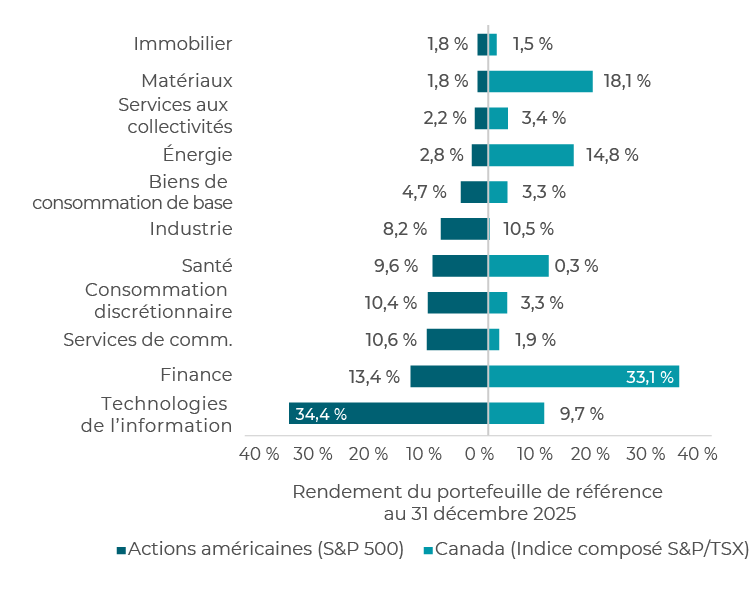
Source : S&P Global Market Intelligence.
Le tableau ci-dessus illustre les avantages qu’offrent les actions canadiennes sur le plan de la diversification aux investisseurs qui investissent dans des actions américaines, compte tenu des pondérations sectorielles très différentes et complémentaires. Au cours de la dernière décennie, l’exposition démesurée aux technologies de l’information a contribué à la surperformance du marché boursier américain.
Toutefois, nous nous attendons à ce que la forte représentation des sociétés liées à la production d’électricité et d’or sur les marchés boursiers canadiens contribue fortement au rendement :
Sociétés canadiennes en % du secteur MSCI Monde tous pays
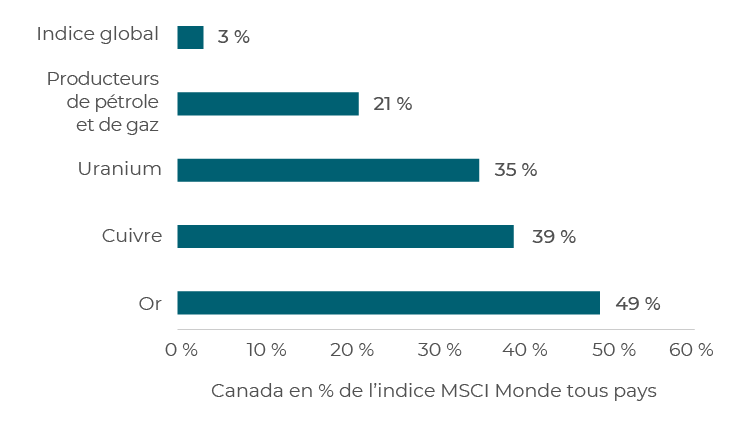
Source : S&P Global Intelligence au 31 décembre 2025.
Étant donné que les investisseurs mondiaux cherchent à accéder à ces types d’actifs et à diversifier leur exposition aux actions américaines, le rendement des investisseurs étrangers pourrait être favorable.
3. La stabilité de la monnaie est importante pour les investisseurs établis en dollars canadiens
Le risque de change est souvent sous-évalué jusqu’à ce qu’il devienne important. Au cours des 12 derniers mois seulement, le dollar canadien a progressé d’environ 10 % par rapport au dollar américain. Pour les investisseurs ayant un passif en dollars canadiens – caisses de retraite, fonds de dotation, fonds d’assurance ou besoins de dépenses au Canada –, cela représente une source importante de volatilité du portefeuille.
Au comptant $ CA/$ US
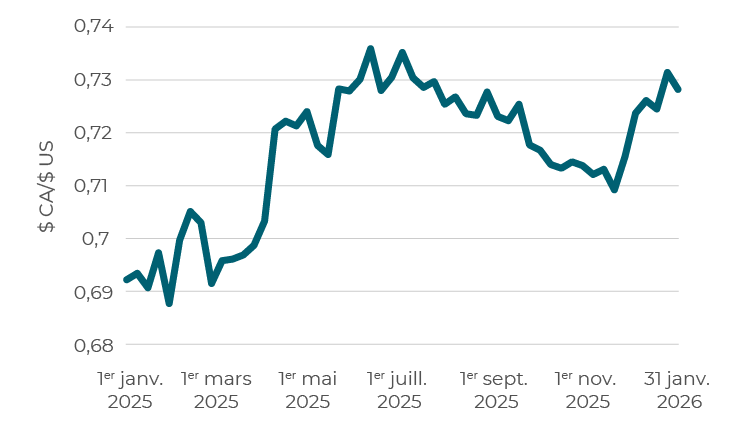
Source : Bloomberg.
Ce mouvement de change est principalement attribuable à deux facteurs. Premièrement, l’opinion moins favorable des investisseurs mondiaux à l’égard du dollar américain comme valeur refuge a entraîné une diversification dans le segment de l’or et d’autres actifs. La forte représentation des producteurs d’or et d’autres produits de base sur le marché boursier canadien a accentué cette vigueur du dollar canadien. Comme l’on s’attend à ce que chacune de ces tendances persiste, les monnaies pourraient demeurer un obstacle pour les investisseurs en dollars canadiens qui détiennent des actions américaines.
4. Un marché attrayant pour la gestion active
Comme c’est le cas pour presque tous les marchés liquides, les investisseurs en actions canadiennes peuvent choisir entre une exposition active et une exposition passive.
Nous croyons que les actions canadiennes représentent une occasion beaucoup plus intéressante pour les gestionnaires actifs que les actions américaines. Le fait d’utiliser la couverture des analystes comme indication de l’efficacité des cours des actions confirme certainement cette affirmation, comme il est illustré ci-dessous. Prenons l’exemple des bénéficiaires purs et simples de l’IA : NVIDIA cotée en bourse aux États-Unis est couverte par plus de 90 analystes du côté vendeur, contre seulement environ 18 pour Celestica, l’analogue canadien de l’IA. À mesure que la dispersion au sein des secteurs et entre les secteurs augmente dans un contexte de reprise économique inégale, nous nous attendons à ce que la sélection des titres soit un facteur de rendement de plus en plus important, et à ce que la gestion active soit particulièrement bien positionnée au Canada.
Le marché canadien est moins efficace
Moins d’analystes couvrent le marché canadien
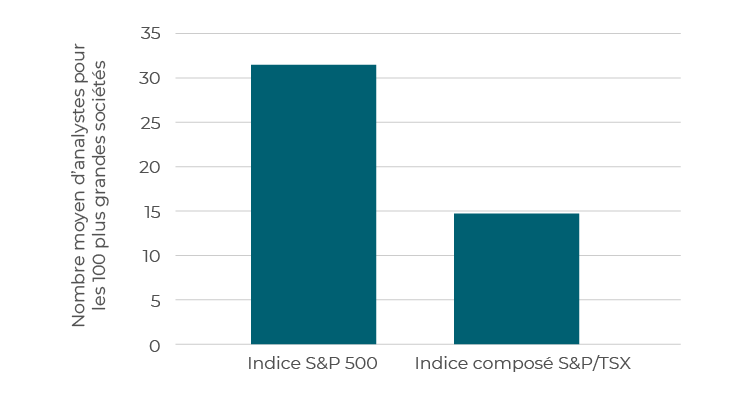
Source : Bloomberg. Données au 31 décembre 2025.
Risques pesant sur les perspectives
Le principal risque que nous surveillons est l’incertitude géopolitique accrue, en particulier en ce qui a trait à la renégociation de l’ACEUM. Bien que la rhétorique commerciale aux États-Unis se soit intensifiée et ait créé des poches de volatilité, l’incidence macroéconomique sur le Canada a été limitée jusqu’à maintenant. En particulier, le Canada a créé plus d’emplois par habitant qu’il n’en a perdu depuis le début de la présidence de Trump. Bien que les prochaines négociations de l’ACEUM soient susceptibles de générer un risque de nouvelles menaces tarifaires, la sensibilité politique de l’inflation et les pressions sur le coût de la vie au cours d’une année électorale de milieu de mandat aux États-Unis devraient limiter la portée de résultats nettement défavorables. Nous continuons de suivre de près l’évolution de la situation.
Le Canada éclipse l’ère Trump en matière d’emplois
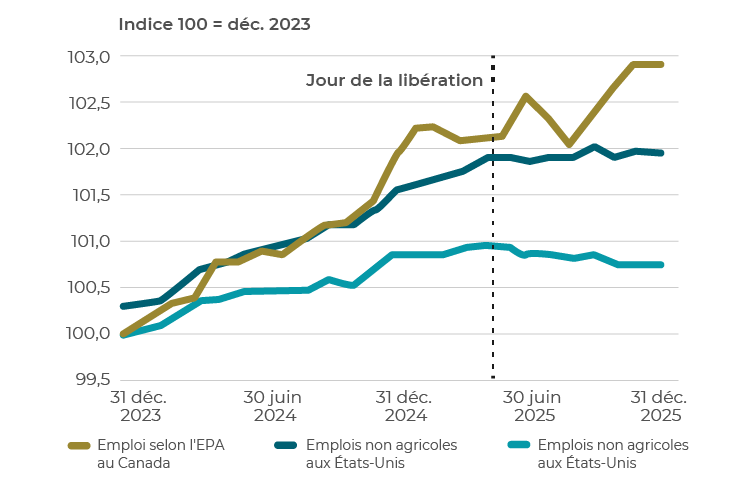
Sources : Services économiques Banque Scotia, Statistique Canada, Bureau of Labor Statistics.
Conclusion
Après une décennie dominée par les meneurs technologiques américains, un changement de régime est en cours à mesure que le contexte de placement s’élargit. Le marché boursier canadien est entièrement aligné sur la prochaine vague d’investissements mondiaux, offrant des valorisations intéressantes, une monnaie stable, une répartition sectorielle différenciée et un important effet de levier sur la demande croissante de produits de base. Dans un contexte structurellement favorable à la gestion active, les actions canadiennes méritent un renouvellement et peut-être une augmentation de leur pondération dans les portefeuilles mondiaux.
À propos de Gestion de placements Connor, Clark & Lunn Ltée
Fondée en 1982, Connor, Clark & Lunn est une société fermée de gestion de placements ayant à coeur d’offrir à sa clientèle diversifiée un service exceptionnel et une vaste gamme de solutions de placement intéressantes. Nous savons à quels défis sont confrontés les particuliers, les régimes de retraite, les entreprises, les fondations, les fonds communs de placement, les Premières Nations et d’autres organisations, et nous nous employons à répondre à leurs besoins en matière de placement en proposant une gamme exhaustive de stratégies de placement, qui réunit les catégories d’actif traditionnelles ou non de même qu’une diversité de styles quantitatifs et fondamentaux.
Le matériel sur ce site Web n’est présenté qu’à titre informatif; il ne doit pas être considéré comme une source de conseils en placement ou en finance. Par ailleurs, l’information sur ce site Web ne doit pas être interprétée comme une offre ou une sollicitation de la part d’une société membre du Groupe financier Connor, Clark & Lunn de fournir des services de gestion de placement ou de vendre ou d’acheter des produits.
Certains règlements en matière de valeurs mobilières interdisent la publication de renseignements spécifiques sur l’inscription des entités inscrites du Groupe financier Connor, Clark & Lunn. Pour en savoir plus, veuillez communiquer avec le service de la conformité de Connor, Clark & Lunn à [email protected] ou composer le 604-685-2020.