L’arrivée du charbon a déclenché la première grande transition énergétique et a alimenté l’industrie, les villes et le progrès pendant des centaines d’années. Ce n’est que dans les années 1970 que les produits pétroliers ont pris le devant de la scène et que les combustibles fossiles sont devenus le pilier de la vie moderne. Le gaz naturel a gagné en importance au cours des dernières décennies. Le monde est à l’aube d’une autre transformation énergétique, mais cette fois, il y a bien davantage en jeu. Les transitions énergétiques précédentes ont été alimentées par la croissance économique et une consommation en plein essor. Maintenant, le défi consiste à garantir l’accès à l’énergie pour tous, tout en réduisant d’urgence les émissions pour protéger notre planète.
L’enjeu
L’atmosphère terrestre est comme une serre, les gaz comme la vapeur d’eau, le dioxyde de carbone et l’oxyde nitreux agissant comme des parois invisibles. Ils laissent entrer la lumière du soleil et emprisonnent la chaleur, maintenant notre planète suffisamment chaude pour la vie. Sans eux, la Terre serait un désert gelé. À mesure que nous rejetons davantage de gaz à effet de serre dans l’atmosphère, la planète se réchauffe.
Le dioxyde de carbone est le principal contributeur du réchauffement, dépassant de loin les autres gaz. Cinq grands secteurs sont en cause : l’énergie, l’agriculture, l’industrie, la gestion des déchets et les changements d’affectation des terres. À lui seul, le secteur de l’énergie est responsable de 76 % des émissions, principalement issues de la production d’électricité et de chauffage, des transports et de l’industrie manufacturière.
Depuis le début de la révolution industrielle, le dioxyde de carbone atmosphérique a bondi de plus du tiers sous l’effet de l’activité humaine. Le réchauffement de la planète a atteint de nouveaux sommets en 2024, qui est devenue l’année la plus chaude jamais enregistrée, dépassant pour la première fois 1,5 °C au-dessus des niveaux préindustriels.
Les conséquences
Le réchauffement de la planète affecte une multitude de systèmes, dont les océans, le climat, les sources de nourriture et la santé.
- Fonte des calottes glaciaires : La glace du Groenland et de l’Antarctique est en train de fondre, libérant l’eau autrefois contenue dans les glaciers, ce qui engendre une élévation du niveau de la mer qui menace les communautés côtières.
- Conditions météorologiques extrêmes : Les températures plus chaudes modifient les conditions météorologiques, entraînant une intensification des tempêtes, des inondations, des feux de forêt et des sécheresses.
- Systèmes alimentaires : Les cultures peinent à pousser dans des sols déshydratés, l’eau se raréfie et les écosystèmes végétaux et animaux doivent migrer pour survivre.
- Santé urbaine : La chaleur persistante dans les villes épaissit l’air de smog, causant de graves problèmes de santé.
La chaleur persistante dans les villes épaissit l’air de smog, causant de graves problèmes de santé.
- Les risques liés à la transition comprennent l’incidence de l’adoption par les gouvernements de taxes sur le carbone ou de limites d’émissions strictes. Les sociétés pourraient voir leurs bénéfices diminuer du jour au lendemain. Les progrès technologiques pourraient rendre les systèmes énergétiques d’aujourd’hui obsolètes, ce qui forcerait les sociétés à innover sous peine de perdre du terrain. Tandis que les investisseurs et les consommateurs se tournent vers une plus grande durabilité, la réputation d’une société – et le cours de son action – pourrait fluctuer fortement si elle est perçue comme étant à la traîne en matière de lutte contre les changements climatiques.
- Les risques liés à l’adaptation impliquent que même des solutions bien intentionnées pourraient avoir leurs effets pervers. La construction de digues peut prémunir les villes contre la montée des eaux, mais aussi perturber de fragiles écosystèmes. Toute action peut avoir des conséquences imprévues.
Plan de lutte contre les changements climatiques
Les gouvernements du monde entier retroussent leurs manches. L’Accord de Paris a établi des objectifs ambitieux pour la réduction des gaz à effet de serre, que les pays cherchent maintenant à remplacer par des cibles encore plus strictes, la plupart visant la « zéro émission nette » d’ici 2050. Chaque nation doit présenter son plan pour la prochaine décennie, expliquant comment elle réduira ses émissions et s’adaptera aux impacts des changements climatiques, et de quelle aide elle a besoin pour ce faire.
La tarification du carbone prend de l’ampleur, une quarantaine de pays imposant maintenant une taxe sur la pollution carbone afin d’encourager les énergies plus propres et de financer des projets durables. L’objectif est d’empêcher les températures mondiales d’augmenter de plus de 2 °C par rapport aux niveaux préindustriels et, idéalement, de limiter cette hausse à seulement 1,5 °C.
Bien que 2024 ait été la première année où les températures mondiales ont dépassé 1,5 °C, la science climatique examine les moyennes à long terme, et non seulement les pics sur une seule année. En maintenant une température inférieure à 1,5 °C, nous pourrions éviter des points de bascule irréversibles, réduire les phénomènes météorologiques extrêmes et protéger l’approvisionnement alimentaire.
Le facteur humain
Le plan d’action climatique pose un autre défi : les êtres humains sont peu doués pour la planification à long terme. Nous avons tendance à nous concentrer sur ce qui se trouve juste devant nous, ce qui rend difficile le respect des objectifs climatiques à long terme, comme en témoignent le retrait des États-Unis de l’Accord de Paris à deux reprises, et l’abandon discret par le Régime de pensions du Canada de son objectif d’atteindre la carboneutralité d’ici 2050, dans la foulée du resserrement des règles entourant les déclarations environnementales.
Les gens ont tendance à accorder plus d’importance aux risques et aux avantages à court terme qu’à ceux qui se situent dans un avenir lointain. Le dernier Rapport sur les risques mondiaux du Forum économique mondial illustre ce biais. À l’horizon des dix prochaines années, les risques climatiques sont majoritaires au sein des cinq principaux risques identifiés. Toutefois, à l’horizon des deux prochaines années, un seul risque climatique se classe parmi ces risques prioritaires. Si nous continuons de penser à court terme, nous risquons de passer à côté de ce qui est vraiment important et de faire obstacle aux progrès réels dans la lutte contre les changements climatiques.
Le rôle des investisseurs
Les investisseurs institutionnels ont un rôle central à jouer dans l’issue de la saga des changements climatiques. En dirigeant les capitaux vers des projets d’énergie renouvelable et respectueux du climat, ces investisseurs ont le pouvoir d’accélérer la transition mondiale vers un avenir sobre en carbone. Par l’engagement actionnarial et le vote par procuration, ils peuvent inciter les sociétés à réduire leurs émissions et à être plus transparentes à l’égard des risques climatiques.
Les organismes de réglementation canadiens tirent la sonnette d’alarme, soulignant que les changements climatiques ne représentent pas seulement un risque environnemental, mais aussi un risque financier. Les plus récentes lignes directrices de l’Association canadienne des organismes de contrôle des régimes de retraite (ACOR) exhortent les conseils d’administration à prendre les risques climatiques au sérieux, avertissant que les risques physiques et ceux liés à la transition ne feront qu’augmenter au fil du temps. Une gestion efficace des risques implique de se tourner vers l’avenir et de se préparer à ce qui nous attend.
Des occasions à saisir
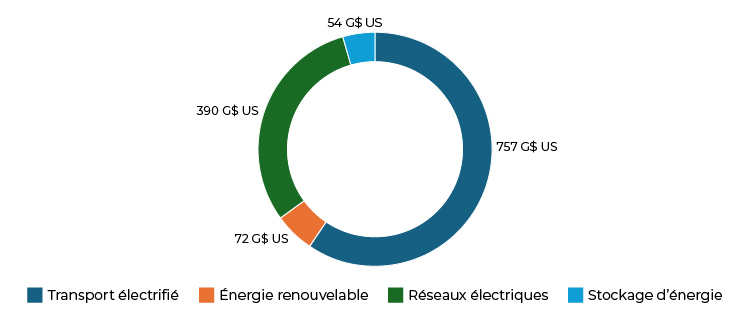
La transition énergétique n’est pas seulement une question de responsabilité, c’est aussi une opportunité. Les investissements dans les énergies renouvelables, les transports électriques, les réseaux électriques et le stockage d’énergie ont déjà attiré près 2 000 milliards de dollars américains, affichant une croissance de plus de 10 %, même en période difficile. La figure 1 montre où va l’argent, les réseaux électriques et de transport électrifié se taillant la part du lion.
Figure 1 – Où vont les investissements
Le passage aux énergies renouvelables n’est pas une voie toute tracée. Par exemple, même si le stockage par batterie s’améliore, de nombreux systèmes n’assurent que quelques heures d’autonomie, de sorte que des innovations sont nécessaires pour améliorer ce système. Bien que la technologie contribue à la lutte contre les changements climatiques, elle crée également des problèmes environnementaux et de productivité. Les infrastructures numériques et l’intelligence artificielle (IA) font augmenter la demande d’électricité. Les centres de données qui alimentent les modèles d’IA sont très énergivores, ce qui accroît la pression sur le réseau.
Les nouveaux secteurs émergents, tels que la géothermie et les carburants renouvelables, sont à la traîne par rapport aux secteurs plus matures, ne représentant que 7 % de l’investissement total et affichant une baisse importante par rapport aux années précédentes.
L’ampleur des investissements nécessaires dans les infrastructures est stupéfiante. Les routes, les aéroports, les centrales électriques, les services publics d’eau et les réseaux de télécommunications ont tous besoin d’importantes mises à niveau. Sans une augmentation des investissements, le monde pourrait faire face à un déficit d’infrastructures de 15 000 milliards de dollars américains d’ici 2040. Pour cette raison, les combustibles fossiles continueront de faire partie du portefeuille énergétique pendant de nombreuses années, malgré la baisse de leur consommation et la croissance rapide des énergies renouvelables. Le nucléaire fait aussi un retour en tant qu’option plus propre pour la production d’électricité à grande échelle, même s’il est coûteux et lent à mettre en place, ce qui limite son potentiel de contribution.
Passer à l’action
Les changements climatiques sont un risque que nous ne pouvons pas ignorer, mais ils constituent également une opportunité pour ceux qui sont prêts à agir. Les risques et les opportunités sont souvent perçus comme étant opposés. S’agissant des changements climatiques, toutefois, ils ne sont pas nécessairement en conflit, car une opportunité, comme investir dans les sources d’énergie renouvelable, peut jouer un rôle clé dans la gestion des risques liés au climat.
La transition énergétique exige des investissements, de l’innovation et du leadership. Les investisseurs ont un rôle crucial à jouer, et ceux qui se démarquent peuvent non seulement obtenir de solides rendements, mais aussi avoir une incidence durable sur la planète.