Save-on-Foods located in Town Centre, a newly constructed shopping centre in Calgary, Alberta.

Crestpoint Real Estate Investments Ltd., in partnership with the Trinity Retail Fund, is pleased to announce the completion of two new retail investments: Town Centre and the Cornerstone Retail Portfolio, both situated in and around Calgary, Alberta. These investments are strategically located, host a premium roster of well-known national tenants and are nestled near residential areas that attract substantial consumer traffic.

Town Centre, a newly constructed shopping centre spanning approximately 138,000 sq. ft. in the master-planned community of Trinity Hills near Canada Olympic Park, is anchored by Save-on-Foods and includes a variety of well-known national tenants, such as Dollarama, PetSmart, Bulk Barn and Sleep Country. Located near the Trans-Canada Highway and Sarcee Trail SW, the centre provides tenants with exposure to over 60,000 vehicles daily and is adjacent to a community projected to reach around 4,000 residential units.

The Cornerstone Retail Portfolio consists of two open-format, grocery-anchored retail properties in Olds and Okotoks, Alberta, measuring approximately 113,000 sq. ft. and 157,000 sq. ft., respectively. Combined, the two-asset portfolio covers 33 acres with a leasable area of approximately 270,000 sq. ft. About 98% of the space is leased to a premium roster of national tenants offering high-quality everyday essentials, including Sobeys, Canadian Tire, Staples, Dollarama, Mark’s and several leading banks. Both locations also benefit from their proximity to Walmart “Superstores.”

Crestpoint, on behalf of the Crestpoint Core Plus Real Estate Strategy (its open-end fund), has a 75% interest in Town Centre and the Cornerstone Retail Portfolio, with Trinity Retail Fund holding the remaining 25%. These acquisitions enhance the fund’s diversity and increase Crestpoint’s total assets under management to over $10 billion.

Bingham Canyon copper mine, largest man-made hole in the world, Utah, USA.

The new dynamics of the global materials market

We recently attended the BMO Global Metals, Mining & Critical Minerals 2024 Conference, the premier global event for the materials sector. Materials make up 8% of the MSCI Global Small Cap Index and 10% of the MSCI EAFE Small Cap Index. Mining conferences are like no other, featuring core shack displays and political representatives from various countries. The atmosphere was notably different this year, particularly with the decline in battery material prices. There was a noticeable shift of interest from car battery to electrical grid infrastructure materials.

Supply and demand at play in commodities prices

Returns in the materials sector generally correlate with the supply-demand dynamics of various commodity prices. Inflation typically indicates an overall demand driver. However, it has not been very impactful, as China, a major commodity buyer, is experiencing modest inflation growth. Commodity supply dynamics are highly influenced by regulatory events, including environmental, social, geopolitical factors, capital availability and project risks. Recently, we have observed events that could signal mid to long-term structural changes.

Copper and aluminum: metals on the move

Copper has been performing well due to both future demand and supply side momentum. Essential to data computing, it has been rebranded as “AI copper.” Additionally, the growth in electricity demand and closure of the world’s largest copper mine are factors pushing prices to new highs.

Aluminum can substitute copper, especially in electrical transmission, as its resistivity is 0.6 times that of copper such that aluminum wire is 66% larger. The prices of both commodities tend to correlate. Currently, the price spread between the two is considered large from a historical perspective, with copper trading at $4.57 and aluminum at $1.17, making aluminum an economically viable substitution.

Our investment in Alumina

Global Alpha is exposed to aluminum through our stake in Alumina (AWC AU). Based in Australia, the company is the largest producer of alumina metal, a key precursor to aluminum. AWC shareholders have recently agreed to accept the all-share acquisition proposal by Alcoa, its long-term operating partner. With a more vertically integrated operation, Alcoa plans to reduce overall costs by 10% within a short two-year period. Aluminum is also widely used in the aerospace sector, which provides another tailwind.

Gold and copper in traditional and emerging markets

Copper is often mined alongside gold. Gold, which had been out of favour since 2011, is seeing renewed interest and positive investor sentiment, driven by purchases from central banks in China and established investor circles, with both buying the bullion at a faster pace than in the past. This trade is a win-win. If China’s economy falters compared to its US counterpart, gold becomes a safe alternative. Conversely, if China’s economy outperforms, the race to distance itself from the US dollar intensifies. Despite China’s cryptocurrency ban, there are rumours that this commodity accumulation is in preparation for a devaluation of the yuan, though time will tell. Other countries, like Turkey and Poland, have also increased their gold reserves for similar geopolitical reasons.

Globally, we produce 3,100 tons of gold annually and it estimated that there are 205,000 tons of gold in circulation – half in jewelry, 25% in investments and 15% held by central banks. In 2023, China’s government bought a record 735 tons. The private sector net imported 1,411 tons, with an impressive 228 tons coming in just January of 2024.

The golden balance of central banks and global stock

For central banks, there is room to grow for China as it ranks fifth with 2,200 tons in its vaults today compared to the US at 8,100 tons. The below-ground stock of gold reserves is currently estimated at around 50,000 tons according to the US Geological Survey.

This equates to a 15-year mine life for the world’s gold demand. As gold deposits become increasingly difficult to locate, this global gold mine life will likely diminish rapidly. In this context, gold could become a strong competitor to digital currencies in the coming years as a safety alternative.

ALS Ltd. and commodity markets

Global Alpha is exposed to gold, copper and other commodities through ALS Ltd. (ALQ.AU). ALS is the market leader in mining assay management, helping companies with their sample testing requirements. With industry-leading margins in precious metals, ALS has achieved the necessary scale in all major global mining hubs, giving it significant competitive advantage. ALS also operates in the environmental and health care sectors, where it benefit from its global reach compared to smaller competitors.

Capitalizing on commodity upswings with Osisko Gold Royalties

We also own Osisko Gold Royalties (OR.CN). The company holds gold and base metal royalties in North America. Royalties are intriguing financial instruments as they are paid in product by miners and are largely unaffected by mining costs, allowing royalty companies to benefit from rising commodity prices. Last year, the company hired a highly reputable management team and simplified its structure by exiting all direct project investments.

Gold and iron ore stability vs. disruption

In the gold market, central banks act as fringe buyers and sellers and are the price setters. Although jewelry accounts for the bulk of market demand, consuming 2,000 tons annually, its growth is relatively muted and stable.

The same concept of stability and fringe actors applies to iron ore. The world consumes two billion tons per year and China-based mills account for 50% of that. Production of 1.1 billion tons is controlled by five companies with fairly stable output. Fringe producers contribute 300 million tons, including high-cost producers in China and Southeast Asia that have benefitted from robust pricing over the years. However, the iron ore price balance is poised for disruption as 200 million tons of low-cost production is expected to enter the market in 2026 from mega projects in Guinea and Australia.

Silver and palladium redefined

Other interesting points from the conference that could orient our research include insights on silver and palladium. It takes five times more palladium to build a hybrid than a regular car. Silver has now surpassed a 50% usage rate in industrial applications, prompting a reevaluation of its classification as a precious metal.

Beyond precious – the future of metals

All of these developments invite us to rethink the boundaries of “precious” in metals and the value of agility and foresight in investing. As markets shift and new technologies demand novel materials, our approach to commodities must also adapt. This not only offers opportunities for astute investors but also challenges us to anticipate changes and position ourselves advantageously for what lies ahead.

post in February argued that US Treasury plans to reduce reliance on bills to fund the deficit implied weaker monetary expansion from Q2, with possible negative implications for markets and economic prospects. This scenario remains on track.

The Treasury last week confirmed a reduction in the stock of Treasury bills in Q2 while signalling small-scale issuance in Q3.

Deficit financing via bills rather than coupon debt tends to boost the broad money stock because bills are mostly bought by money-creating institutions, i.e. banks and money funds. Their purchases are usually associated with expansion of their balance sheets, with a corresponding increase in monetary liabilities.

Broad money also tends to rise when the Treasury finances the deficit by running down its cash balance at the Fed.

Both effects were in play in 2023 / early 2024, resulting in a large monetary boost from Treasury operations that more than offset the Fed’s QT – see chart 1.

Chart 1

Chart 1 showing US Broad Money M2+ (6m change, $ bn) & Fed / Treasury QE / QT (6m sum, $ bn)

The latest Treasury estimates, however, imply a small negative impact in Q2 / Q3 combined. The earlier post argued that the Fed would need to halt QT to offset this shift. Last week’s taper announcement was insufficient, implying that the combined Treasury / Fed influence is likely to turn significantly contractionary – chart 2.

Chart 2

Chart 2 showing US Broad Money M2+ (6m change, $ bn) & Sum of Fed & Treasury QE / QT (6m sum, $ bn)

Will a revival in bank lending neutralise the Treasury / Fed drag? The Fed’s April senior loan officer survey was less negative but demand and supply balances remain soft by historical standards, arguing against a strong pick-up – chart 3.

Chart 3

Chart 3 showing US Commercial Bank Loans & Leases (% 6m annualised) & Fed Senior Loan Officer Survey Credit Demand & Supply Indicators* *Weighted Average of Balances across Loan Categories

April monetary statistics will be released in late May but weekly numbers on currency, commercial bank deposits and money funds are consistent with emerging weakness  – chart 4.

Chart 4

Chart 4 showing US Broad Money M2+ & Weekly Proxy* ($ trn) *Currency in Circulation + Commercial Bank Deposits + Money Funds

Panneaux solaires sur un champ agricole par une journée ensoleillée.

La hausse des températures, attribuable à l’augmentation des niveaux de gaz à effet de serre (GES) dans notre atmosphère, jette une ombre sur l’avenir de notre planète. L’inaction pourrait avoir des conséquences désastreuses, créant un contexte de risques physiques et économiques. La cause fondamentale du problème est l’activité humaine, et plus particulièrement les émissions de dioxyde de carbone (CO2) provenant de la combustion de combustibles fossiles. La gravité de la situation retient l’attention à l’échelle mondiale, incitant les gouvernements du monde entier à s’engager à réduire les émissions de GES dans le cadre d’un effort collectif visant à freiner la hausse de la température de la Terre.

La solution à ce défi sans précédent va bien au-delà des promesses gouvernementales et des politiques publiques. Elle dépend également du soutien et de l’engagement proactif des entreprises, des investisseurs et de la population. La transition énergétique est un élément essentiel de la lutte contre les changements climatiques, qui implique une transition de la dépendance aux systèmes à base d’énergie fossile, comme le pétrole et le charbon, vers les énergies renouvelables comme l’énergie éolienne, l’énergie solaire et les technologies de stockage d’énergie à grande échelle. La transition vers des solutions énergétiques à plus faible intensité en carbone jouera un rôle déterminant dans tout plan d’action sur les changements climatiques. Le présent article fournit des renseignements généraux sur les enjeux et le rôle de la transition énergétique dans le contexte plus large des changements climatiques.

Comprendre les GES : La cause sous-jacente du réchauffement de la planète

Le plan d’action sur les changements climatiques est principalement axé sur la lutte contre les émissions de CO2 associé à l’énergie dans l’atmosphère, qui représentent la majorité des émissions de GES (figure 1). Ces émissions de CO2 sont largement attribuables aux combustibles fossiles qui produisent notre électricité et nos systèmes de chauffage et de climatisation, et qui alimentent nos activités de transport. Les autres émissions liées à l’énergie comprennent le méthane (CH4) et l’oxyde de diazote (N2O), tandis que les GES non liés à l’énergie restants sont principalement associés à l’agriculture.

Figure 1 – Émissions mondiales de GES
Diagramme circulaire des émissions de gaz à effet de serre par type.
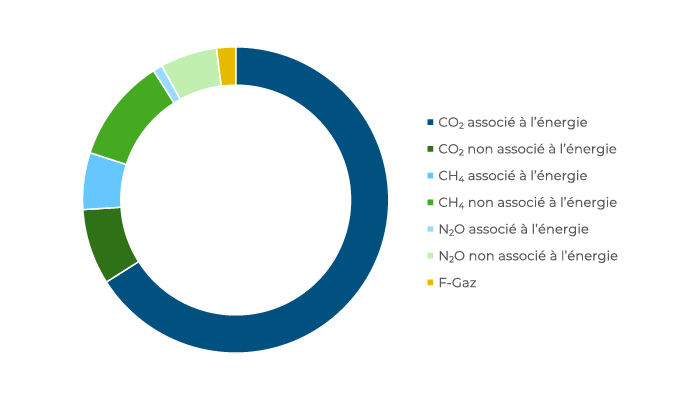
Source : Climate Watch, World Resources Institute (2016).

Il est important de garder à l’esprit que les GES ne sont pas nécessairement une mauvaise chose. En fait, ils fonctionnent comme une couverture thermique qui réchauffe la Terre et sont essentiels à la survie de l’espèce humaine. Sans les GES, notre planète serait inhabitable. Toutefois, l’augmentation des niveaux de GES limite l’efficacité de la couverture thermique et représente la préoccupation sous-jacente du réchauffement de la planète, et c’est la raison pour laquelle l’accent est mis sur la lutte contre les émissions de CO2 associées à l’énergie.

Transitions énergétiques à travers les siècles

Dans le passé, les transitions énergétiques étaient de longs processus alimentés par les forces combinées de la croissance économique et de l’augmentation de la demande d’énergie. La première transition majeure, qui s’est échelonnée sur plus d’un siècle, a eu lieu dans les années 1800, lorsque les biocarburants traditionnels (principalement le bois) ont été remplacés par le charbon. Au milieu des années 1970, un autre changement important a été annoncé avec le développement et l’adoption de produits pétroliers raffinés. Au cours des 30 années suivantes, les combustibles fossiles ont été la principale source d’énergie jusqu’aux 20 dernières années, alors que la dépendance au gaz naturel a augmenté.

Ces transitions passées étaient motivées par la prospérité économique et l’augmentation implicite de la consommation d’énergie dans les pays développés et en développement. La transition énergétique actuelle est différente et plus complexe. La réussite de la transition énergétique mondiale actuelle dépend de sa capacité à assurer l’accès à l’énergie pour favoriser la croissance économique et le développement, tout en s’attaquant à la décarbonisation pour atténuer les répercussions des changements climatiques.

Une plus grande menace à l’égard des changements climatiques

Les premières études sur les conséquences des changements climatiques se concentrent souvent sur les risques environnementaux, mais les conséquences négatives sont beaucoup plus larges, et comprennent les impacts physiques et répercussions de la transition qui touchent les collectivités, les entreprises, les marchés financiers et les citoyens.

Les changements climatiques à long terme entraînent une augmentation de la fréquence et de la gravité des événements extrêmes comme les tempêtes et les inondations. Ces événements peuvent causer des dommages et des perturbations aux résidences et aux entreprises, en plus des répercussions financières, comme une hausse des coûts d’assurance. À divers degrés, la plupart des secteurs devraient être touchés par les risques associés aux changements climatiques, et confrontés à des difficultés financières directes et indirectes en raison de dommages physiques, d’interruptions opérationnelles et de perturbations de la chaîne d’approvisionnement. La Banque d’Angleterre a également souligné que les conséquences des changements climatiques représentent une grave menace pour la stabilité du système financier en raison de leur nature étendue et de leur exposition généralisée aux institutions financières et aux propriétaires d’actifs.

La menace généralisée des changements climatiques a incité les gouvernements du monde entier à reconnaître la nécessité de favoriser les changements de comportement et de soutenir la transition énergétique. Des initiatives comme l’Accord de Paris conclu en 2015 fixent des objectifs à long terme pour la réduction des GES, les gouvernements ayant de plus en plus recours à des mesures d’incitation économiques et à des règlements pour encourager l’abandon des combustibles fossiles. Contrairement à la réponse mondiale concertée à la pandémie de COVID-19, la réponse aux changements climatiques manque d’uniformité en raison de facteurs économiques, politiques et sociaux variés dans différentes régions du monde. Toutefois, une meilleure coordination sera nécessaire pour atténuer et gérer la menace que représente le réchauffement de la planète.

Risques et occasions concernant la transition énergétique

Souvent, on aborde les risques et les occasions comme des concepts opposés. Toutefois, il ne s’agit pas nécessairement de concepts opposés; une occasion peut aider à gérer un risque particulier. Telle est la situation en ce qui concerne les changements climatiques et le rôle de la transition énergétique. Les occasions de transition dans le secteur de l’énergie peuvent toucher toutes les catégories d’actif et tous les secteurs, mais les occasions les plus importantes devraient provenir de stratégies d’infrastructures permettant d’offrir des solutions à faible émission de carbone.

La transition d’un système énergétique dépendant des combustibles fossiles vers des sources d’énergie plus propres et renouvelables nécessitera des investissements de billions de dollars, et cela pourrait être l’une des plus vastes et importantes occasions d’investissement des prochaines décennies. On s’attend à ce que les investissements annuels dans le secteur de la transition énergétique, qui sont actuellement d’environ 1 billion de dollars américains, dépassent en moyenne 3 fois ce montant au cours du reste de la décennie.*

L’ampleur de l’investissement supplémentaire alimentera la croissance des occasions dans un éventail d’actifs et d’entreprises d’infrastructures pendant de nombreuses années. De toute évidence, les solutions d’infrastructure comprendront le développement et la réalisation de projets d’énergie propre. Toutefois, en raison de l’importance du défi des changements climatiques, il sera nécessaire d’englober un univers beaucoup plus vaste d’actifs, y compris la facilitation des solutions d’infrastructures et la décarbonisation des infrastructures existantes.

Développer et instaurer une énergie plus propre

Pour les solutions d’infrastructures à faible émission de carbone, les occasions naturelles comprennent le développement et la construction de projets d’énergie propre renouvelable, comme les centrales d’énergie éolienne, solaire et hydroélectrique au fil de l’eau. Bien que l’on reconnaît maintenant l’importance des autres piliers dans la lutte contre les changements climatiques, les solutions d’énergie renouvelable ont conservé leur position de secteur le plus important en 2022.*

Mettre en place des solutions durables et favoriser les infrastructures

La transition énergétique s’étendra bien au-delà des systèmes énergétiques de base. Elle nécessitera la mise en œuvre d’une gamme de solutions durables, notamment la construction de systèmes de stockage dans des batteries, d’infrastructures de recharge de véhicules électriques et de systèmes de chauffage et de climatisation géothermique dont l’intensité en carbone est moins élevée que celle des chaudières à gaz classiques, pour réduire les émissions dans une plus large mesure.

Décarboniser les infrastructures existantes

L’autre pilier clé du domaine des actifs est la décarbonisation des infrastructures existantes, ce qui nécessite une approche active et pratique pour la transition des actifs des modèles d’affaires à forte intensité en carbone vers des solutions de rechange plus vertes appuyées par différentes stratégies, comme les changements apportés aux processus de production, l’électrification des systèmes, l’adoption de sources de carburant plus propres et l’utilisation du captage et du stockage du carbone. Par exemple, le financement de l’électrification d’une flotte de véhicules. Un autre investissement potentiel serait la transformation d’une infrastructure de production alimentée au gaz, où il serait possible de combiner, et finalement de remplacer, la charge d’alimentation du gaz naturel avec de l’hydrogène vert pour produire de l’électricité à faible teneur en carbone, et éventuellement, carboneutre.

La transition énergétique ne peut être couronnée de succès sans le financement et le leadership des propriétaires pour stimuler la transformation des infrastructures existantes. Bien que certains investisseurs pourraient prévoir d’emblée des exclusions pour des secteurs entiers, comme le charbon, le gaz naturel ou le pétrole, nous nous attendons à ce que bon nombre d’entre eux revoient leurs positions et adoptent une approche plus souple qui leur permettrait de profiter d’une certaine exposition lorsqu’un plan de transition crédible et réalisable est en cours pour l’investissement.

Saisir l’occasion de transition énergétique

Il devient de plus en plus important d’investir dans des infrastructures liées à la transition énergétique, et il est urgent d’investir des capitaux substantiels pour soutenir les efforts de décarbonisation et atteindre les objectifs mondiaux en matière de lutte contre les changements climatiques. Les investissements dans les infrastructures de transition énergétique offrent aux investisseurs institutionnels un accès à un éventail d’occasions et, comme la transition énergétique devrait avoir une incidence sur tous les secteurs et pays, il est impératif que les comités de placement gardent à l’esprit les risques et les occasions, ainsi que le rôle de la transition énergétique dans la lutte contre les changements climatiques.

*Source : BloombergNEF, Energy Transition Investment Trends 2023.

Documents sources :
Climate change: A primer for investors, LCP, 2021.
Energy Transition 101, World Economic Forum, 2020.
What is Energy Transition, S&P Global, 2020.

Abonnez-vous aux mises à jour

The Fed’s preferred core price measure – the PCE price index excluding food and energy – rose by an average 0.36% per month, equivalent to 4.4% annualised, over January-March.

The FOMC median projection in March was for annual core inflation to fall to 2.6% in Q4 2024. This would require the monthly index rise to step down to an average 0.17% over the remainder of the year – see chart 1.

Chart 1

Chart 1 showing US PCE Price Index ex Food & Energy

The judgement here is that such a slowdown is achievable and could be exceeded, based on the following considerations.

First, such performance was bettered in H2 2023, when the monthly rise averaged 0.155%, or 1.9% annualised, i.e. the requirement is within the range of recent experience.

Secondly, the monetarist rule of thumb of a two-year lead from money to prices suggests a strong disinflationary impulse during H2 2024. From this perspective, any current “stickiness” may reflect the after-effects of a second pick-up in six-month broad money momentum in 2021, following the initial surge into mid-2020– see chart 2.

Chart 2

Chart 2 showing US PCE Price Index & Broad Money (% 6m annualised)

Momentum returned to a target-consistent 4-5% annualised in April 2022, subsequently turning negative and recovering only from March 2023, with the latest reading still sub-5%. Allowing for the usual lag, the suggestion is that six-month price momentum will move below 2% in H2 2024, remaining weak through next year.

A third potential favourable influence is a speeding-up of the transmission of recent slower growth of timely measures of market rents to the PCE housing component. Six-month momentum of the latter was still up at 5.6% annualised in March but weakness in the BLS new tenant rent index through 2023 is consistent with a return to the pre-pandemic (i.e. 2015-19) average of 3.4% or lower – chart 3. With a weight of 17.5%, such a decline would subtract 3 bp from the monthly core PCE change.

Chart 3

Chart 3 showing US PCE Price Index for Housing (% 6m annualised) & BLS Tenant Rent Indices (4q ma, % 6m annualised)

Image alt text: Upper left: Old Town Warsaw, Poland during sunset. Lower right: Sunrise over The Blue Mosque, Istanbul, Turkey.

In March, our team embarked on a two-week trip to two of the most dynamic economies within Emerging Markets: Poland and Turkey. During our visit, we engaged with companies spanning a variety of industries – from construction and renewable energy to waste management, IT, commercial services, airlines and airport operators. Also, we gained insights into the consumer sector, meeting with leaders in production and distribution for a wide range of consumer products, including confectionery, fast food, denim, automotive, electronics, soft drinks and beer. The trip’s objective was not only to check up on existing holdings but also to identify nascent opportunities and understand the challenges these businesses face.

Poland’s optimistic outlook

It has been a year since our previous visit to Poland. During that visit, we observed consumers struggling with high inflation, wage growth continuing to decline, public concerns around the upcoming parliamentary elections and hopes for a swift resolution to the war in Ukraine, which would bring peace and vast opportunities for Polish companies.

We were happy to see a rise in optimism regarding these concerns during our latest visit. Most of our interviewees were more bullish this time around. Post the parliamentary elections, we sensed a renewed optimism as a pro-European Union (EU) coalition regained power. The new Polish government seems committed to mending relations with the EU, having successfully unblocked the first tranche of €76 billion frozen by the European Commission due to legal concerns after judicial reforms by the former government. Since joining the union, Poland has been a significant beneficiary of EU funds, receiving approximately €164 billion from 2004 to 2020. For context, Poland’s GDP was €750 billion last year. These substantial financial inflows have contributed to various crucial projects across the country, enhancing infrastructure and improving structural economic growth and overall wellbeing​. No wonder these EU funds are expected to drive economic growth for several years to come. Coming in the form of grants and low-interest loans, this financing is mainly for funding infrastructure and renewable energy projects.

Contrary to last year, this time we saw consumers in Poland enjoying strong real wage growth of around 10%, with no labour market slowdown. With inflation easing to low single digits in the first quarter of 2024, these factors create a conducive backdrop for the robust recovery of Polish consumers. Growing disposable income is likely to not only rebuild their savings but also drive rebound in consumption.

However, the road ahead may be bumpy due to potential inflation spikes in the second half of 2024 on the back of higher energy prices, a VAT hike on groceries, fulfillment of costly pre-election commitments, domestic political tensions and the potential escalation of the ongoing war in Ukraine. The war remains one of the major risks to the region and was a frequent topic in our conversations, not only with corporate executives but also with ordinary citizens. Centuries of conflict between Poland and Russia have left deep scars in the psyche of the average Polish citizen.

Turkish economic reforms and investor confidence

In Turkey, a surprising pivot to orthodox monetary policy last year reignited hopes for economic normalization, buoyed the local stock market and turned foreigners in net buyers for the first time since 2019. Committed to controlling escalating inflation, the central bank raised its key policy rate from 8.5% in June 2023 to a staggering 50% in March 2024. Moreover, the monetary authority signaled its readiness for further rate hikes if necessary. Investors welcomed the government’s adoption of market-friendly measures, which drove the Turkish stock market higher by over 30% in US-dollar terms since the first hike last summer. Simultaneously, foreign reserves have started to recover, sovereign credit spreads have tightened to multi-year lows and the current account balance is expected to get meaningful support from the tourism season starting in May.

Although the recent municipal elections marked a significant defeat for the current leadership, President Erdogan reiterated policy continuity and his commitment to an economic turnaround program in the second half of the year. With no elections for the next four years, the government has time to tackle inflation and achieve long-awaited results. However, this requires the implementation of further austerity measures, including fiscal ones. Current market expectations see inflation peaking in May above 70% before declining to 30%-40% by year-end. However, potential new rounds of minimum wage hikes, premature rate cuts and higher energy prices continue to threaten the turnaround policy and could derail efforts to reduce inflation and improve the trade balance.

Nearshoring opportunities

Despite being influenced by very different forces, Poland and Turkey share some commonalities. In the last few years, the term “nearshoring” has become strongly associated with Mexico and Vietnam. We explored the impact on the Mexican economy in a previous commentary. However, Poland and Turkey have turned out to be underappreciated beneficiaries of supply chain shifts toward near- or friendshoring as a way to reduce reliance on China. Nearshoring opportunities repeatedly came up in our discussions with corporates in both countries. We see Poland as a launching pad for opportunities into Western Europe and hard-to-access markets in the east like Hungary, Romania and Bulgaria. Similarly, Turkey offers a gateway to explore opportunities in CIS countries and less liquid frontier markets. We highlight one such opportunity below.

As bottom-up investors, we focus our macroeconomic analysis primarily on enhancing the risk management aspect of our portfolio management. When investing in highly turbulent economies, we prefer to stick to companies that we believe can succeed even when their domestic economies face challenges. Additionally, we look to benefit from a possible decline in country risk premiums in the event of macro normalization.

Investment spotlight: Coca-Cola Icecek and Mo-BRUK

Our largest position in Turkey is Coca-Cola Icecek (CCOLA TI), a coke bottler. In the last 20 years, the company has evolved from a single-country operator to the third-largest coke bottler globally, with a footprint spanning 12 countries and 600 million people. Icecek generates less than 30% of its EBITDA in Turkey, with Pakistan, Kazakhstan, Uzbekistan and another eight countries in the Middle East and Central Asia accounting for the major part of the business. Robust strategic alignment with The Coca-Cola Company, combined with Icecek’s proven record of successful integration, positions it as the preferred partner for further consolidation of Coca-Cola’s bottling operations in the region.

Bangladesh is the recent addition to Icecek’s portfolio. It is a country with over 170 million people and a heavily underpenetrated non-alcoholic beverage industry poised for double-digit volume growth over the next decade. This positions Icecek well to replicate its successful strategy of distribution network enhancement to ensure product availability, build infrastructure and enrich merchandise offerings. Leveraging its leading brand portfolio and a highly experienced management team, Icecek is set to continue capitalizing on the vast potential of its markets.

Mo-BRUK (MBR PW) is a waste management company in Poland specialized in processing hazardous waste. The founding family established the business more than 30 years ago and has built a strong franchise in an industry characterized by high entry barriers. The company does not operate landfills and focuses solely on processing waste. EU regulations on waste management create significant tailwinds for the industry in Poland, as the country must undertake considerable efforts to meet EU objectives. Due to its specialization in hazardous waste and limited competition due to entry barriers, Mo-BRUK enjoys superior business economics. High margins are driven by volume growth and technology improvements, as well as price hikes due to limited capacities in the country. In terms of growth strategy, the company is conducting several expansion projects within available permits. At the same time, it is filing for new permits. Remediation of the illegal landfills or so-called ecological bombs represents an attractive business for Mo-BRUK, but it is highly dependent on the budget allocation by municipalities. The cadence of such projects is erratic, but the company intends to participate in all tenders as they are announced. Additionally, the management team sees multiple consolidation opportunities in the country. In late-2023, Mo-BRUK acquired two independent operators that not only provided the company with scarce permits but also expanded its footprint in northern Poland.

Bird's eye view over the beach of the coastal side of Mombasa, Kenya at sunrise.

The strategy focuses on investing in frontier and emerging market companies that our team expects will benefit from demographic trends, changing consumer behaviour, policy and regulatory reform, and technological advancements.

Below, we explore some of the key factors influencing returns and share observations on the portfolio and the markets.

Financial Services Portfolio

The strategy saw strong returns from financial services, driven by the financial technology portion of the portfolio. The primary driver of returns at the security level was Kenya’s Safaricom PLC, the country’s leading telecommunication and mobile money services provider, whose share price appreciated by nearly 60% in US dollars in the quarter. This strong share-price performance is largely attributed to a decline in the risk premium attached to Kenyan assets.

Like many frontier and lower-income emerging markets, Kenya’s fiscal and balance of payments position was severely compromised over the last four years as it grappled with a host of global challenges, including high and volatile commodity prices, supply chain tightness, rising interest rates, and a strong US dollar. Domestically, successive droughts and the election of a new government in August 2022 created further uncertainty and negatively impacted consumer confidence (note: agriculture contributes over 30% to Kenya’s GDP and employs over 40% of the total population). Consequently, Kenya was all but shut out of international capital markets, impairing its ability to issue hard currency debt to finance its growing liabilities and leading to a 20% depreciation in the Kenyan Shilling against the US Dollar in 2023. The country’s fortunes began to turn around at the beginning of 2024 as it took advantage of a window of opportunity to issue its first Eurobond since 2021. Kenya enticed investors by offering a relatively lucrative yield of 11.0%, which was oversubscribed five times and ultimately raised US$1.5 billion at a tightened yield of 10.375% with a 10-year maturity. The government’s decision to pay up for capital has so far proven to be the right one as concerns quickly abated over the level of FX reserves and the country’s ability to service a US$2.0 billion Eurobond maturing in June 2024. The result was a compression in yields across the curve and a restored confidence in the Shilling, which, as of the date of writing, is the world’s best-performing currency versus the US dollar (~19% appreciation in the quarter). The significant appreciation in the currency is bringing imported inflation down, and with the start of the rainy season and a better harvest, it should serve to further subdue inflation through lower food prices.

As would be expected, the improvement in Kenya’s economic prospects was swiftly reflected in the share price of Safaricom as well as the broader market. Through M-Pesa, Safaricom is particularly geared to economic activity as it is the dominant platform through which its ~32 million active customers (~60% of Kenya’s population) transact using services like peer-to-peer transfers, bill payments, remittances, and borrowing and saving. In the year ending December 2023, M-Pesa facilitated ~$280 billion of transaction value (nearly 3x Kenya’s GDP), a number that is expected to grow as economic activity picks up and as many of the use cases that management is rolling out are adopted by its large and scaled base of customers and merchants.

Another notable contributor to the period’s returns from the financial technology portfolio was Kazakhstan’s Kaspi.kz, a company we have written extensively about in a previous post. Over the last three years, Kaspi’s management team have been working on a plan to move the company’s share listing venue from London (LSE) to the Nasdaq. Kaspi’s shares have been relatively illiquid on the LSE, with one-year average daily traded value of US$2.8 million, a low percentage of the free-float market capitalisation of over US$3.0 billion. Management have long made the case that the LSE listing undervalued their shares and that the right home for Kaspi as a technology company is the Nasdaq. True to their word, management pulled off the listing in January this year to become the first Kazakh company to list on the Nasdaq (the shares were subsequently delisted from the LSE). Since the listing, daily traded value averaged US$43.0 million, ~15x what it used to trade on the LSE. It is too early to say whether that liquidity boost will underpin a higher multiple on the shares as management hopes, but we are confident in their ability to execute operationally and believe that this will ultimately drive long-term shareholder value. The Nasdaq listing has also been celebrated by the President of Kazakhstan, which we believe should only help reinforce Kaspi’s national champion status and strategic importance to the country’s ambition to draw in foreign direct investment.

Consumer Portfolio

The strategy’s consumer portfolio delivered good performance this quarter, driven by the Philippines’ Century Pacific Food Inc. and Indonesia’s Sido Muncul (Sido). Century Pacific is the largest canned food company in the Philippines, with an 85% and a 52% share in seafood (tuna and sardines) and meat, respectively. Over the last few years, Century’s management have successfully executed an entry into the dairy category, with market share as of end of 2023 reaching ~28% in powdered milk (from 2% in 2016), a strong number two and lagging only behind Nestle, the market leader with a ~60% share.

The milk category is in its infancy in the Philippines, with annual consumption per capita at the bottom of the list among Asian countries. Management believes that milk consumption is at an inflection point and have positioned the company strongly to benefit from the growth in the category over the next decade. The diversification and resilience of Century’s portfolio have served it well in the last twelve months; Filipino consumers have experienced considerable pressure on their disposable incomes from a rise in rice prices and high interest rates which has led them to trade down to categories that offer more value for money. Simultaneously, softer input prices allowed Century to increase its gross profit margins and invest in advertising and promotions to drive demand and reinforce the equity of its brands while thoughtfully increasing dividend payout to shareholders. Momentum seems to also be building in other parts of the Century portfolio, including coconut water where the company announced an expansion of its agreement with The Vita Coco Company, alternative meats where it is now in 1,800 Walmart locations in the US, and pet food where it is making inroads in modern retail doors in the Philippines.

Sido, the herbal medicine company that we have discussed extensively in the past, emerged from a difficult 2023 with a strong exit performance in the last quarter of the year and a promising outlook for the first half of 2024. Sido is one of the most profitable consumer health companies in the world, with EBITDA margins above 44% and return on capital ratios that are consistently in the range of high 20%s to low 30%s. This profitability underpins high cash conversion and allows the company to continually run a zero-debt balance sheet. More recently, the controlling shareholder Irwan family bought out the full 17% stake of Affinity Equity Partners, a private equity investor that had come to the end of its investment cycle in the company. The transaction was done at a 30% premium to the three-month average price, signalling confidence from the family in the prospects of the business, and removing the overhang on the shares that typically arises with late-stage private equity ownership of public companies in our markets.

 Outlook

After three difficult years, we are observing an improvement in the environment for the strategy. We sense more optimism in our discussions with the majority of portfolio companies on their operations and outlook for their businesses. We also see a growing opportunity set for the strategy as investability returns to markets like Kenya, Egypt, Pakistan, and Bangladesh. We also see more opportunities emerging out of ASEAN markets like Malaysia and Thailand, and Middle Eastern markets like the UAE. This has been reflected in the strategy’s cash levels, which have reached a three-year low as of the end of the quarter.

We look forward to continuing to update you on the strategy over the rest of the year.

Silhouette of an oil pump station during sunset in Qatar.

MENA equity markets rounded up the first quarter of 2024 with returns of 3.2% (for the S&P Pan Arabian Index Total Return), ahead of the MSCI Emerging Markets Index, which was up 2.3% in the same period.

While Index-level returns were fairly muted, underlying performance and market activity levels remained robust. In Saudi Arabia, the performance divergence theme that we discussed in past letters picked up pace in the quarter, with the MSCI Saudi Midcap Index gaining 10.1%, outperforming the broader MSCI Saudi Index by ~8.0%. Accompanying this performance was a significant increase in liquidity on the exchange, with average daily traded value (ADTV) in the quarter reaching ~US$2.4 billion, higher by 68% (or nearly US$1.0 billion) compared to the ADTV for the full year of 2023. This surge in liquidity appears to be driven by a combination of domestic and foreign institutional flows, increased primary market activity drawing in new capital, and perhaps most interestingly, the emergence of high-frequency trading (HFT) as a new type of market participant. Estimates from HSBC suggest that HFT contribution to ADTV reached ~15% in March 2024 compared to low single digits in 2023. HFT contribution in our opinion is likely to materially grow in the mix over the next few quarters, driven by the stock exchange’s initiative to provide co-location services and an increase in the market’s capacity to accommodate additional liquidity through increases in free float and new listings. For comparison, HFT’s contribution to Turkey’s stock exchange volumes currently ranges between 25% and 30%. Capital market development in the region, and particularly in Saudi, is a powerful theme that the strategy has expressed through various position sizes depending on valuation through Saudi Tadawul Group, the stock exchange holding company which itself is a listed company on the market.

Another theme the strategy has been building exposure to over the last few quarters is Qatar’s liquified natural gas (LNG) value chain, which received a boost from Qatar Energy’s announcement in February of a capacity expansion plan that will add 16 million metric tons to annual capacity, taking it to 142 million tons by 2030. As the world’s lowest-cost producer of natural gas, with a lifting cost of US$0.30 per MMBTU compared to a range of US$3.0 to US$5.0 globally, Qatar is well-positioned to capitalize on its reserves over the next decade. Emboldened by this cost advantage and the US government’s decision to pause LNG export approvals until after the 2024 elections, Qatar seems intent on getting the most out of its reserves in the next decade. By keeping production high, Qatar will reinforce its position as the lowest-cost supplier to growing Asian markets and secure its role as a key player in the recalibration of energy supply chains that is taking place following the Russia-Ukraine war.

Qatar Gas Transport Company Ltd. (QGTS), the owner and operator of the world’s largest LNG shipping fleet, is a primary beneficiary of this theme. This was recently validated by the awarding of a contract for the addition of 25 conventional size LNG carriers (to an existing fleet of 74 vessels) by Qatar Energy following February’s capacity expansion announcement.

A key event in the quarter was the devaluation of the Egyptian Pound (EGP) in the first week of March. The Central Bank of Egypt (CBE) and the government of Egypt finally capitulated and devalued the currency from just above 30/USD to 50/USD after having held the rate at the former level since January 2023. The devaluation came two weeks after the government sealed a mega property deal with one of Abu Dhabi’s sovereign wealth funds that broadly involved a land sale in exchange for US$35 billion, of which US$14 billion would be in direct cash transfers and US$11 billion in a debt swap on existing UAE debt to Egypt. This substantial deal, equivalent to nearly 10% of Egypt’s GDP, has the immediate effect of reducing Egypt’s external debt by 7%. The floatation of the EGP following the Abu Dhabi deal has unlocked further funding from the IMF, which upsized its loan agreement with Egypt from US$3 billion to US$8 billion. The devaluation and improvement in Egypt’s external balances have opened up the foreign exchange market and cleared the backlog that had built up over the last 12 months. This should bring Egypt back from the brink of an MSCI reclassification from “Emerging” to “Frontier” or “Standalone” as we had seen from FTSE, which removed its special treatment classification following the devaluation.

While there is a lot to cheer about, those familiar with Egypt have seen this scenario before. Our recent conversations with companies suggest there is still a high degree of uncertainty among businesses and consumers. High interest rates (12-month T-bills are ~26% as of the date of writing) and limited progress on the reform front from the government will likely weigh on real earnings growth and keep valuation multiples fairly low. Egypt needs to demonstrate a willingness to make bold reforms that stimulate growth and attract foreign direct investment to break its cycle of reliance on friendly governments and multilateral agencies. In the absence of such reforms, the prospects for a multi-year earnings growth cycle in Egypt seem remote. That being said, we do see a window to potentially generate returns in Egypt in the next six to twelve months as US-dollar returns are likely to be protected over that timeframe given the recent devaluation. We believe the UAE’s Al Ansari Financial Services is an interesting way to play the reopening of the FX market in Egypt through the recovery in remittance flows from the UAE to Egypt. At its peak, Egypt was the third-largest FX corridor for Al Ansari, and thus the potential for an earnings recovery in the second half of 2024 is strong as volumes recover from a near halt in 2023. Under the right conditions, we also anticipate the strategy increasing our ownership of Egypt-listed businesses, details of which we will share if we make material investments there.

We look forward to continuing to update you on the strategy throughout the year.

UK house prices were an estimated 52% expensive relative to history at the end of 2023, based on a comparison with rents and the real yield on index-linked gilts, a competing inflation-protected asset.

The degree of overvaluation is below previous extremes and does not imply that house prices need to fall by an equivalent magnitude, or even at all – the deviation could be eliminated by rental growth and a reversal of the recent rise in real yields.

The ratio of the average house price to average earnings is conventionally used to assess valuation. Chart 1 shows an economy-wide version of this ratio – the estimated value of the housing stock divided by aggregate household disposable income.

Chart 1

Chart 1 showing Ratio of UK House Prices to Household Income* *Value of Housing Stock Divided by Gross Disposable Income of Households

The secular rise in the ratio is usually ascribed to such factors as increasing credit availability, population growth and undersupply due to planning and other constraints.

The use of earnings as a yardstick is questionable: it would be odd to assess the valuation of an equity market by reference to the income of investors. A better approach is to compare house prices with the value of services provided – proxied by rents – using an appropriate discount rate.

A simple valuation metric based on this approach is the gap between the rental yield on housing and the real yield on longer-term index-linked gilts. Index-linked rather than conventional bonds are the appropriate reference because housing is expected to provide inflation protection over the longer term.

The rental yield series, shown in chart 2, is derived from national accounts data by dividing the sum of actual and imputed rents by an estimate of the value of the housing stock*. The measure, therefore, is comprehensive, including owner-occupied and public housing as well as private rented accommodation.

Chart 2

Chart 2 showing UK Housing Rental Yield & 5y+ Index-Linked Gilt Yield

The index-linked yield series starts in 1983 – the first such gilt was issued in 1981 – so the rental / index-linked yield gap has 41 years of history. In contrast to the house price to income ratio, the gap appears to be stationary / mean-reverting. The average (mean) gap over this period was 4.96 pp. The deviation from this average is the basis of the estimate of over- / undervaluation in a particular year.

The gap indicates that housing was undervalued as recently as in 2021 but only because index-linked yields had fallen to a record negative.

The drop in the yield gap to an estimated 3.27% at end-2023 – implying housing overvaluation of 52% – was driven by index-linked yields returning to positive territory. The rental yield was little changed between 2021 and 2023.

Current overvaluation compares with prior extremes of 74% in 2007 and 105% in 1988 – chart 3. These extremes marked peaks of the 18-year housing cycle, with another top due around 2025.

Chart 3

Chart 3 showing Ratio of UK House Prices to Implied Fair Value* *Based on Rental Yield / Index-Linked Yield Gap

The suggestion is that, unless index-linked yields revert to negative, housing will perform poorly relative to history over the longer term, although prices may be supported over the next 1-2 years as the housing cycle upswing crests.

*The current series for actual and imputed rents begin in 1985; earlier numbers were estimated by linking to previous vintages. The value of the housing stock was calculated by adding the value of dwellings and an estimate of the value of associated land. The latter estimate was derived by applying the ratio of land value to dwellings value for households to the value of dwellings owned by all sectors. The resulting series begins in 1995; earlier numbers were estimated by linking to a previous vintage series for the value of the residential housing stock including land.

Aerial view of a drinking water treatment plant.

One of the 17 Sustainable Development Goals (SDG 6) established by United Nations (UN) is Clean Water and Sanitation, which aims to ensure the availability and sustainable management of water and sanitation for all.

The water crisis is unprecedented

In 2022, 2.2 billion people (27% of world’s population) lacked safely managed drinking water – meaning water that is accessible at home, available and safe. Additionally, 3.5 billion people lacked safely managed sanitation – meaning access to a toilet or latrine that leads to the treatment or safe disposal of excreta. Two billion people did not have access at home to a handwashing facility with soap and water. Demand for water has outpaced population growth due to urbanization and increasing water needs from agriculture, industry and the energy sector. Climate change has exacerbated water scarcity. According to the UN, global freshwater demand is predicted to exceed supply by 40% by 2030.

Water sustainability is complex

Water is at the core of sustainable development and critical for socioeconomic development, healthy ecosystems and human survival itself. Water sustainability refers to the availability of freshwater for human consumption and use in agriculture and industrial processes.

Substantial efforts are required from all stakeholders, including legal and regulatory measures, water pricing and funding. Investments are needed for both water infrastructure and technologies that result in healthier ecosystems, climate-resilient irrigation, improved water storage and higher water reuse rates.

Water investment opportunities are enormous

According to the World Bank, to meet the SDG 6 by 2030, investments must increase sixfold from the current level. Global investment in the water sector needs to exceed $1.37 trillion.

In the US, the Bipartisan Infrastructure Law, passed in 2021, delivers more than $50 billion to the Environmental Protection Agency (EPA) to improve the nation’s drinking water, wastewater and stormwater infrastructure – the single-largest investment in water that the federal government has ever made.

 The European Investment Bank, one of the largest lenders to the global water sector, has invested more than €86 billion in over 1,700 projects, making water security and climate change adaptation a priority. In 2023 alone, it invested about €4.1 billion in the sector.

At Global Alpha, we invest in a few pure plays in water treatment and distribution.

Kurita Water Industries Ltd. (6370 JP)

Founded in 1949, Kurita Water is Japan’s largest industrial water treatment company, offering water treatment facilities, water treatment chemicals and maintenance services. It has over 20,000 customers in Japan. Overseas expansion is progressing well in the US and China, driven by favourable demand and the company’s excellent reputation.

Kurita Water is a technology-driven company with a strong intellectual property portfolio that boasts over 4,000 patents in various water treatment technologies. Core technologies include  anticorrosion, dispersion (to absorb and disperse fine crystals in water to prevent them from sticking to the water system), agglomeration (to aggregate fine dirt particles and impurities in water into larger sized particles that are easier to treat), sterilization and antibacterial, biological treatment, adsorption (using activated carbon and other materials to adsorb and remove ions, organic matter and other impurities dissolved in water), deionization, membrane separation and surface treatment (for semiconductor and LCD manufacturing).

Metawater Co. Ltd. (9551 JP)

Formed in 2008 through the merger of the water environment divisions of NGK and Fuji Electric, Metawater is a leading engineering firm in Japan for water treatment, sewage treatment and waste treatment facilities. It is the first company in Japan to integrate machinery and electricity design in the water treatment field, to achieve optimal efficiency.

Most of Metawater’s customers are public entities. A growing number of its projects are based on Public-Private Partnership (PPP). In fact, Metawater has over 40% market share in such PPP projects in Japan. Outsourcing opportunities through PPP are huge. For example, among Japan’s 4,000 public water treatment plants, only 10% are outsourced. Among 2,000 public sewage treatment plants, only about half are outsourced.

Mueller Water Products (MWA US)

Founded in 1857, Mueller Water Products is a leading manufacturer of water infrastructure, flow control, metering and leak detection products in water and gas distribution networks in North America. Its main products are valves, hydrants, pipe fittings and ductile iron pipes.

The company has one of the largest installed bases of iron gate valves and fire hydrants in the US. The entry barrier is high due to the large switching cost for municipal customers. The business is very resilient, because about two-thirds of its sales are related to utilities repair and replacement.

Primo Water Corporation (PRMW US)

Founded in 1952, Primo Water is a leading North America-focused water solutions provider that operates largely under a recurring revenue model in the large format water category (defined as three gallons or greater). Its water dispensers are sold through approximately 10,800 retail locations and online. It offers water delivery services direct to customers. Customers can also exchange empty bottles at its recycling centres or refill at self-service stations. Primo Water not only provides high-quality water, but also helps reduce landfill waste. One five-gallon Primo Water bottle is sanitized up to 40 times and then recycled, saving over 1,500 single-serve bottles.

Zurn Elkay Water (ZWS US)

Zurn Elkay Water, founded in 1892, is another brand you might be familiar with. In 2022, Zurn Water Solutions and Elkay Manufacturing merged to form Zurn Elkay Water. While Zurn is strong in providing engineered water solutions mainly for the construction market, Elkay’s drinking water solutions include water fountains and the more popular water bottle fillers seen at airports, hospitals and schools. In 2023, two billion gallons of safe, clean filtered water were delivered by its filters, equivalent to the elimination of 18 billion single-use plastic water bottles. Elkay water filters have industry-leading standards and are certified to NSF/ANSI 42, 53 and 401 for the reduction of harmful contaminants, including lead, PFOA/PFOS, microplastics, cysts and Class I particulates.

Is water the new gold?

In Turkmenistan, where 80% of its land is desert, “A Drop of Water Is a Grain of Gold” is a national holiday observed annually on the first Sunday in April. It was established in 1995 to raise awareness about the nationwide water crisis and encourage the development of long-term sustainable solutions.

We believe the water sector presents significant and long-term investment opportunities due to increasingly favourable regulations and innovative new technologies.