The Bank of England’s QT programme has been fiscally expensive, is contributing to worrying monetary weakness and wasn’t required on operational grounds.
The Bank estimates that cumulative QT to date has raised 10-year gilt yields by 15-25 bp, up from 10-20 bp a year ago. Gross gilt issuance in 2025-26 is projected by the DMO at £299 bn. Assuming a 20 bp yield impact across the curve, the implied boost to the annual interest cost of the issued gilts is £600 mn.
To emphasise, this is a repeating cost locked in for the life of the securities.
QT started in February 2022. Gross gilt issuance in 2022-23, 2023-24 and 2024-25 combined was £686 bn. Assuming a smaller 15 bp yield impact of QT in those years, the implied extra interest cost on those gilts is £1.0 bn pa.
So the total boost to the interest bill to date could be £1.6 bn pa.
QT could continue through the end of 2026-27. It will have to stop when bank reserves, currently £674 bn, fall into the “preferred minimum range”, previously assessed by the Bank to lie between £345bn and £490bn. Reserves are being reduced by repayments under the term funding scheme as well as by QT. Still, QT could continue at its current pace for another 18 months before reserves reach the middle of the target range.
The yield boost, presumably, will persist at least until the flow of QT is halted. So there could be an additional QT interest bill of £500 mn pa from gilts issued in 2026-27, pushing the total above £2 bn pa.
QT involves the public sector selling additional gilts across the maturity spectrum to repay bank reserves, which earn Bank rate. With the curve disinverting, this currently involves a net interest loss, to be added to the numbers above.
Furthermore, active QT crystallises valuation losses, requiring additional gilt issuance to finance an increased Treasury grant to the Bank.
What were / are the justifications for QT to balance against these fiscal costs?
A “monetarist” argument is that QT was necessary to correct an “excess” stock of money left over from the 2020-21 fiscal / QE splurge.
However, annual broad money growth – as measured by non-financial M4 – had already fallen back to about 5% when QT began in early 2022, subsequently turning negative in 2023.
The previous monetary excess has by now passed fully into prices / activity (mostly the former). The ratio of broad money to nominal GDP has fallen below its end-2019 level and is further beneath its pre-pandemic trend (noted in the May and August Monetary Policy Reports).
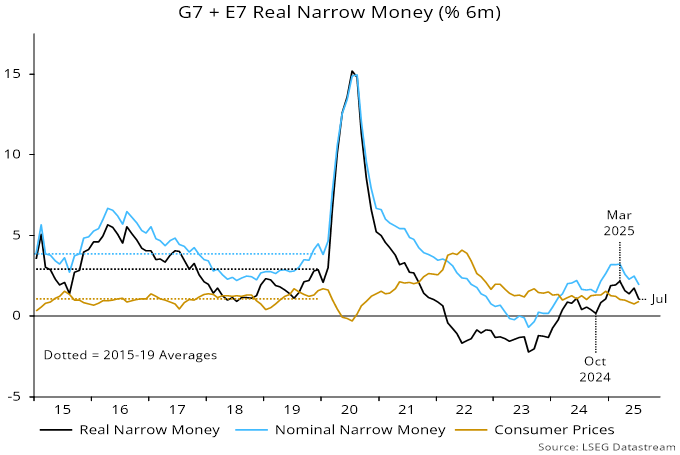
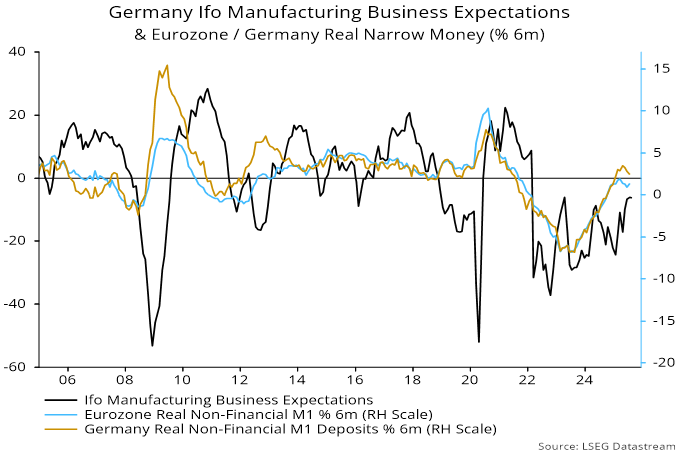
Current money trends, moreover, are worryingly weak: non-financial M4 rose at a 3.0% annualised pace in the six months to June, below the 4-5% pa judged here to be consistent with medium-term achievement of the 2% inflation target. (This judgement assumes potential GDP expansion of c.1.5% pa and a 1% pa trend fall in velocity.)
An alternative debt management argument is that QT was / is necessary to reduce the sensitivity of government finances to future changes in Bank rate. According to this view, QE was a reckless policy because it dramatically shortened the maturity of public sector debt (by replacing gilt liabilities with bank reserves), resulting in enormous losses when Bank rate was subsequently raised significantly.
The issue is whether a desirable reduction in the future volatility of interest costs warrants incurring an additional fiscal loss now. It would, obviously, be preferable to undertake a maturity extension when gilts are in a bull market, not a grinding bear.
The Bank’s justification for QT is that a reduction in its balance sheet has been necessary to free up headroom to respond to future economic / financial emergencies. This is unconvincing for several reasons.
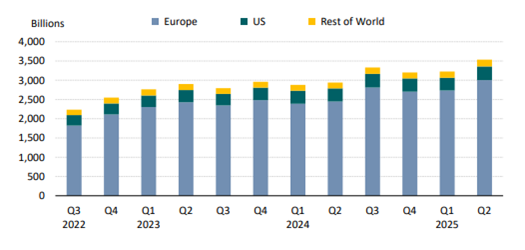
First, repayments under the term funding scheme have reduced the balance sheet significantly, with £80 bn of loans still outstanding – see chart 1.
Chart 1
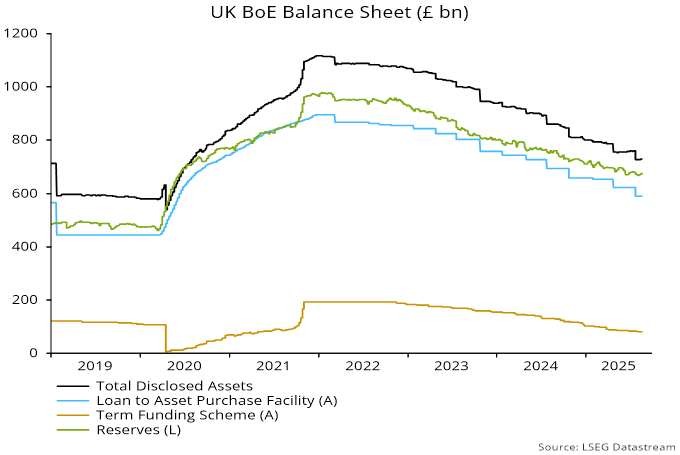
Secondly, the balance sheet would have shrunk considerably relative to nominal GDP and public sector debt even without QT. The asset purchase facility has fallen from 37% of GDP at end-2021 to 20% currently. It would be at 30% if the stock of asset purchases had been maintained at its maximum.
More importantly, the concept of “headroom” as applied to a central bank balance sheet is dubious, and the Bank was far from reaching any form of constraint even when the balance sheet was at its peak.
The maximum Bank share of the stock of gilts was 41%, compared with a 53% peak in the Bank of Japan’s share of outstanding JGBs. Should their holdings of government securities become excessive, central banks have unlimited capacity to lend against private collateral, with appropriate haircuts.
The QE / QT experience raises uncomfortable questions about Bank independence and accountability. Should the MPC attempt to balance monetary policy and operational goals against possible fiscal costs of its actions? If not, who bears responsibility when large losses are incurred?


 Gestion privée Connor, Clark & Lunn Ltée (Gestion privée CC&L) est heureuse d’annoncer que Cameron Smith se joindra à son équipe de direction à titre de directeur général, Gestion des ventes le 2 septembre 2025.