UK real money contraction warned of 2022 economic stagnation and 2023 recession. Weakness has abated but real money measures have yet to resume expansion, casting doubt on hopes of a sustainable economic recovery.

The latest ONS numbers are consistent with a recession having started in Q2 2023. Among key features of the GDP release:

  • Gross value added (GVA) at basic prices peaked in Q1 2023, falling by 0.03% in Q2, 0.16% in Q3 and 0.34% in Q4.
  • The cumulative decline in GVA / GDP of 0.5% between Q2 and Q4 is inconsistent with a description of the economy as “flatlining”.
  • Similarly, claims that the consumer has been holding up are no longer tenable given a 1.0% cumulative contraction in household consumption between Q2 and Q4.
  • GDP / GVA fell by 0.2% and 0.3% respectively in the year to Q4, meeting a stronger recession definition than the two-quarter rule (in contrast to Japanese GDP also released today).
  • Nominal as well as real GDP fell in Q4, with the GDP deflator rising at a 2.0% annualised pace between Q2 and Q4.

The suggestion of cyclical peak in Q1 2023 is supported by the LFS employment measure, which reached a high in the three-month period centred on March. (The LFS aggregate is 10% larger than the PAYE employment series, reflecting coverage of self-employment.) Aggregate hours worked also peaked then, falling 1.5% through November.

Real money measures began to contract in H2 2021. GDP stagnated from Q2 2022, consistent with the usual lag. The six-month rates of decline of real narrow and broad money reached a peak in March 2023, warning of H2 economic contraction – see chart 1.

Chart 1

Chart 1 showing UK GDP & Real Narrow / Broad Money (% 6m)

Six-month real money momentum has recovered significantly but has yet to turn positive. Slowing inflation has been a key driver, while nominal broad money is no longer contracting. Economic weakness may abate in H1 2024 but current monetary trends appear inconsistent with a meaningful recovery. Early rate cuts are urgently required to limit still-significant downside risk and head off an extended inflation undershoot.

Recent US equity market buoyancy is likely to be related to a rebound in broad money momentum during H2 2023. The previous post argued that this was driven by monetary financing of the federal deficit – specifically, large-scale issuance of Treasury bills that were bought mainly by money funds and banks.

A more contentious interpretation is that the Treasury has been operating a form of QE that has overridden the monetary effects of the Fed’s QT.

The federal deficit can be financed by running down the Treasury’s cash balance at the Fed or issuing bills / coupon debt. The first option injects money directly. Issuing bills is also likely to expand broad money, since money funds and banks usually absorb the bulk of new supply. Coupon issuance usually has the smallest monetary impact because coupon debt is purchased mainly by non-banks.

So a summary measure of the monetary influence of financing operations is the difference between Treasury bill issuance and the change in the Treasury balance at the Fed – henceforth “Treasury QE”.

Chart 1 shows six-month running totals of Fed QE / QT and the suggested Treasury monetary impact along with the six-month change in broad money. The sum of the Fed and Treasury series “explains” most of the variation in money momentum in recent years – chart 2.

Chart 1

Chart 1 showing US Broad Money M2+ (6m change, $ bn) & Fed / Treasury QE / QT (6m sum, $ bn) Fed QE = Change in Fed Securities Holdings “Treasury QE” = Treasury Bill Issuance minus Change in Balance at Fed

Chart 2

Chart 2 showing US Broad Money M2+ (6m change, $ bn) & Sum of Fed & Treasury QE / QT (6m sum, $ bn)

“Treasury QE” was a major contributor to the 2020 monetary surge and became significant again in late 2022 / early 2023, mainly reflecting a run-down of the Treasury’s cash balance. Following suspension of the debt ceiling in June 2023, the Treasury rebuilt the balance but the monetary impact was more than offset by bumper bill issuance – see the previous post for details.

The Treasury’s recently released financing plans imply a swing from expansion to contraction during H1 2024. The cash balance at the Fed is targeted to fall from $769 billion at end-2023 to $750 billion at end-Q1, remaining at this level at end-Q2. The stock of bills, meanwhile, is projected to rise by $442 billion in Q1 but fall by $245 billion in Q2. “Treasury QE” would remain strong at $461 billion in Q1 – far ahead of expected Fed QT of about $240 billion – but a dramatic shift would occur in Q2, with “QT” of $245 billion.

If Fed QT were to continue at its current pace, the suggestion is that the six-month change in broad money would return to negative territory by mid-year, unless other monetary counterparts were to show offsetting strength – chart 2.

Note that the above argument is distinct from the notion that ongoing Fed QT risks pushing reserve balances and / or deposits at the overnight reverse repo (ON RRP) facility below the level required for money market stability. The possibility of a broad money shortage due to a withdrawal of Treasury monetary support would remain even if the minimum reserves / ON RRP level proves to be lower than feared. The two risks, however, could interact.

A possible conclusion is that markets face a monetary air pocket in Q2 unless the Fed halts QT at its March meeting. A cynic might speculate that the Treasury’s financing plans are designed to increase pressure for an early Fed cessation, which might be followed by a H2 resumption of bill financing to swell monetary support ahead of the November election.

The six-month rate of change of US broad money has recovered from negative territory in early 2023 to 3.9% annualised in December – close to an average of 4.2% over 2010-19, when economic performance was generally favourable.

Does this signal that the economy has adjusted to higher interest rates and monetary conditions are no longer particularly restrictive, in turn suggesting less need for Fed easing?

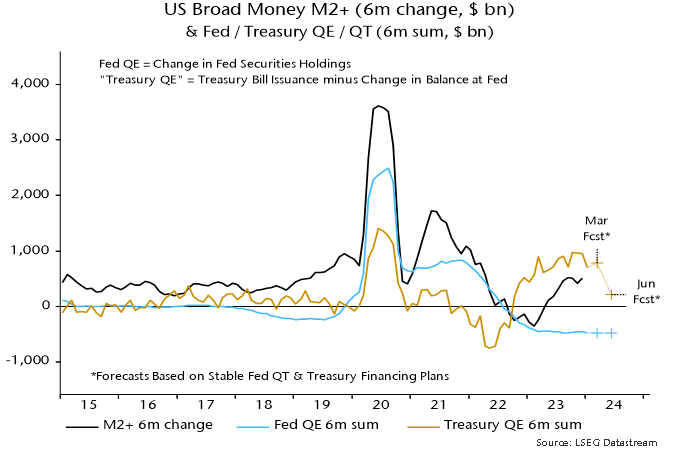
The analysis below of the “credit counterparts” to monetary expansion indicates that the recent revival has been driven by exceptionally large-scale purchases of Treasury bills by money market funds.

Such buying will fall back but its recent importance highlights a larger point. If the fiscal deficit remains at its current level (or rises further), and the Treasury continues to choose to fund a large proportion of the deficit by expanding the Treasury bill issue, the contribution of deficit financing to monetary growth is likely to be significant, even assuming no return to QE. In this scenario, a higher average level of interest rates may be necessary to constrain money growth to a pace – of perhaps 4-5% pa – compatible with trend economic expansion and on-target inflation.

On the suggestion that the recovery in money growth obviates the need for policy easing, a key point is that the effects of prior monetary restriction are still feeding through and may not be fully apparent for another year or more. Rate cuts are likely to be warranted to cushion near-term economic weakness and avert an inflation undershoot.

The numbers quoted above for US broad money expansion refer to the “M2+” measure calculated here, which adds large time deposits at commercial banks and institutional money funds to the official M2 measure. The inclusion of these items is important as they capture a significant proportion of money holdings of non-financial businesses and non-bank financial institutions. As previously discussed, US business money holdings have been rising rapidly in recent quarters, resulting in six-month momentum of M2+ diverging positively from that of M2 since late 2022, i.e. M2 is understating broad money growth at present.

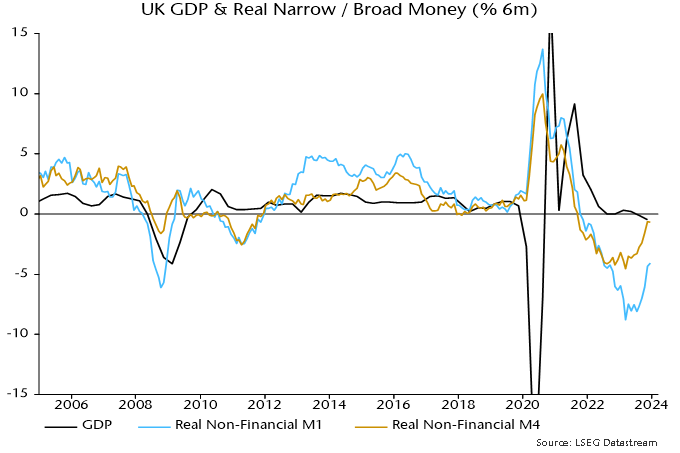
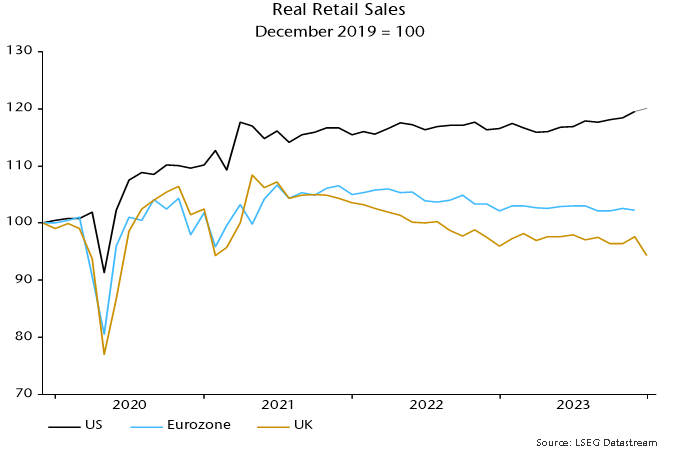
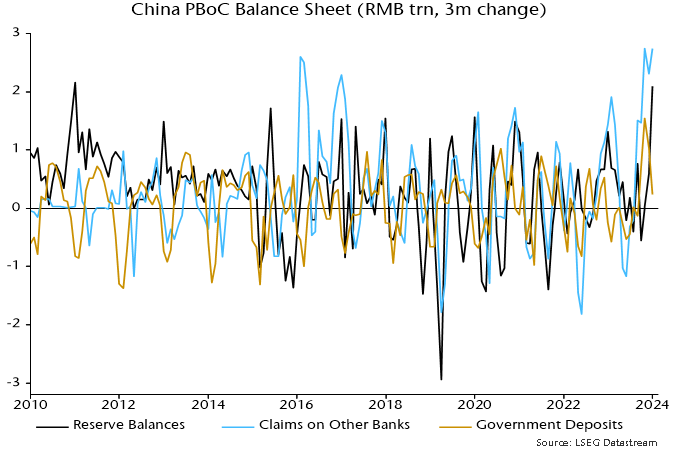
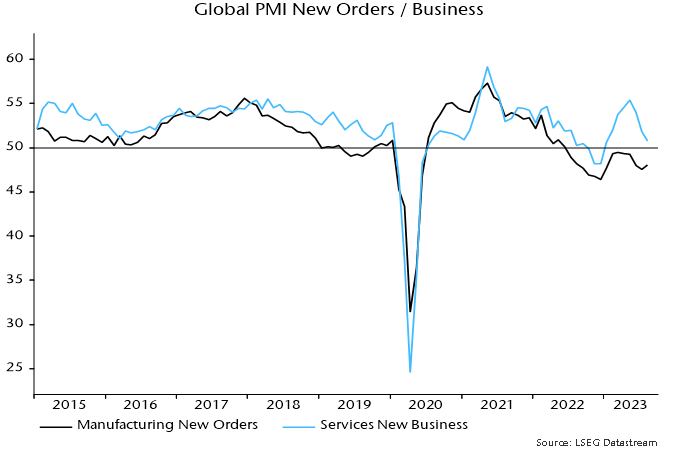
Six-month broad money momentum has recovered by much more and to a higher level in the US than in the Eurozone and UK – see chart 1.

Chart 1

Chart 1 showing Broad Money (% 6m annualised)

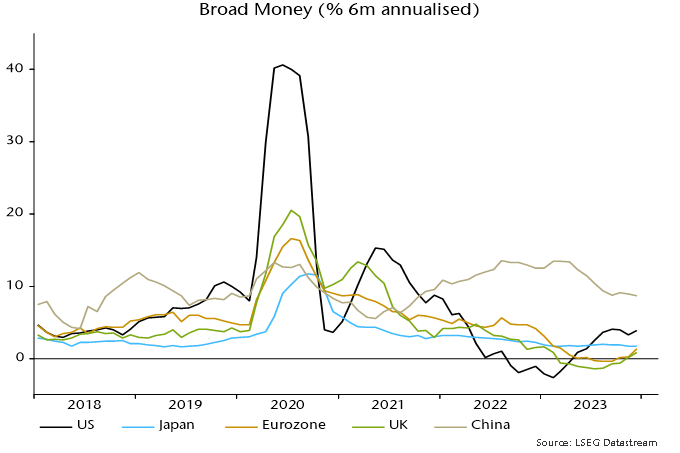
The credit counterparts analysis links changes in broad money to movements in other items on the monetary sector’s balance sheet, the US monetary sector being defined as the Fed, commercial banks and other depository institutions, and money funds. The following simple formulation is used for the analysis here:

Change in broad money = monetary financing of federal deficit + change in commercial banks’ loans and leases + other counterparts (residual)

Monetary financing of federal deficit = net purchases of Treasury securities by Fed, commercial banks and money funds – change in Treasury general account balance at Fed

The table shows the contribution of these items to the six-month change in M2+, not annualised, in December 2022 and December 2023.

Table 1 showing the contribution of these items to the six-month change in M2+, not annualised, in December 2022 and December 2023

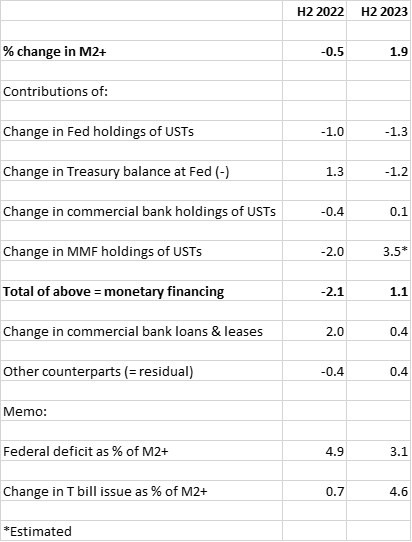
The positive swing in six-month momentum between the two periods was driven by monetary deficit financing and, in particular, a huge change in money funds’ transactions in Treasuries, from selling in H2 2022 to exceptionally large-scale buying in H2 2023.

What caused this turnaround? Following the suspension of the debt ceiling in June 2023, the Treasury issued a net $1.21 trillion of Treasury bills in H2 2023, up from $170 billion in H2 2022 and the second-highest half-year amount ever (after H1 2020).

Money funds and commercial banks are natural buyers of Treasury bills because of the maturity structure of their liabilities. The market mechanism that induced them to increase demand was a rise in Treasury bill yields relative to other short-term rates, including the emergence of a premium over the Fed’s overnight reverse repo rate.

Money funds moved $1.1 trillion out of the Fed facility during H2 2023, buying an estimated $900 billion of Treasury securities and placing the remainder (and an additional amount) in the private repo market (with those funds probably also used to buy Treasuries, suggesting further indirect monetary financing).

Money funds’ Treasury buying is likely to slow dramatically in H1 2024, for two reasons. First, expansion of the Treasury bill issue will be scaled back to $200 billion (from $1.21 trillion in H2 2023), according to refunding plans. Secondly, money funds’ balance in the Fed facility was down to $800 billion at end-2023 (from $2.3 trillion a year earlier), with a further decline in early 2024. The rate of Treasury bill purchases will plausibly slow as the balance approaches exhaustion.

It would, however, be misleading to suggest that purchases of Treasuries by money funds and banks face a constraint in terms of the availability of investible resources. The first-round effect of the fiscal deficit is to swell the broad money stock, i.e. it creates the liquidity necessary to absorb associated debt issuance. If new Treasuries are sold to non-banks, the monetary boost is reversed. If, alternatively, money-holders choose to retain their higher balances, banks and money funds have additional funds with which to buy Treasuries. The money creation due to the deficit then remains unsterilised.

How large a boost could this private form of monetary financing give to broad money growth over the medium term? The federal deficit was $1.78 trillion in calendar 2023, equivalent to 6.5% of GDP and 6.8% of the M2+ stock at end-2022. Suppose that 1) the deficit remains stable as a proportion of the money stock, 2) it is half-financed via Treasury bills and 3) money funds and banks take up half of the issued bills. Assuming no QE / QT and a stable Treasury balance at the Fed, monetary deficit financing would contribute 1.7 pp to annual M2+ growth.

For comparison, Treasury buying by money funds and banks contributed 0.6 pp to average annual growth of M2+ over 2010-19.

Suggested conclusions are: 1) prior monetary weakness will be the dominant influence on economic developments over the next few quarters; 2) the recovery in broad money growth is likely to stall in H1 2024; and 3) a persistent large fiscal deficit could cause funding indigestion and force a renewed increase in reliance on bill financing (or, in the extreme, a resumption of QE), in turn posing an upside risk to medium-term money growth and inflation.

US consumers have trounced the Europeans – again. US personal consumption rose by 9.7% between Q4 2019 and Q3 2023 versus a 0.5% increase in the Eurozone and a 1.6% fall in the UK – see chart 1.

Chart 1

Chart 1 showing Real Personal Consumption Q4 2019 = 100

The divergence probably widened in Q4, judging from retail sales. US sales rose solidly into year-end as Eurozone turnover flatlined (through November) and UK sales hit a new low – chart 2.

Chart 2

Chart 2 showing Real Retail Sales December 2019 = 100

Faster growth of US real personal disposable income explains just over half of the US / Eurozone consumption divergence over Q4 2019-Q3 2023 and about one-third of the US / UK difference. The remainder reflects contrasting saving behaviour.

The US personal saving rate fell by 2.3 pp between Q4 2019 and Q3 2023 versus rises of 1.4 and 4.3 pp in the Eurozone and UK respectively – chart 3*.

Chart 3

Chart 3 showing Gross Personal Saving Ratios Dotted = Q4 2019

What explains the willingness of US households to consume more out of their income than before the pandemic, both in absolute terms and relative to Europeans?

A “monetarist” view is that divergent saving behaviour is related to the magnitude of the boost to household money balances from pandemic-era monetary and fiscal stimulus.

The rise in the ratio of household broad money to disposable income from Q4 2019 was larger and peaked later in the US than in the Eurozone and UK – chart 4.

Chart 4

Chart 4 showing Household Broad Money to Disposable Income Ratios Dotted = Q4 2019

Households with “excess” money balances adjust by spending more on consumption or investment (housing), adding to non-monetary financial assets and / or reducing debt. The larger US excess has probably resulted in a bigger and more sustained boost to consumption than in Europe.

To the extent that monetary adjustment involves higher consumption, the saving rate will be lower than otherwise until the ratio of money balances to income is restored to an “equilibrium” level.

Judging how much of a consumption boost remains requires an estimate of “equilibrium”. As chart 4 shows, the ratio of household broad money to income is below its Q4 2019 level in the Eurozone but still higher in the US and, to a lesser extent, UK.

A superior approach, however, may be to compare money to income ratios with their pre-pandemic trends, since the ratios tend to rise over time as wealth grows faster than income.

On this basis, money demand may now be acting to restrain consumption in the Eurozone / UK, while US excess money balances are now modest and on course to be removed during 2024 – chart 5.

Chart 5

Chart 5 showing Household Broad Money to Disposable Income Ratios Dotted = 2010-19 Trends

The US money to income ratio peaked in Q1 2022, a quarter ahead of the low in the saving rate. The saving rate had risen by 1 pp by Q3 2023 and may increase further as the excess money effect wanes.

*The headline measure of the US personal saving rate is calculated net of depreciation. A gross measure is used here to align with European convention.

China’s economic woes partly reflect restrictive monetary policy. The latest money numbers suggest still-deteriorating prospects and urgent need for a policy reversal. It is unclear whether such a pivot is under way.

Two-quarter growth of nominal GDP (own seasonal adjustment) remained historically weak at 2.7% annualised in Q4, after 2.6% in Q3. Official real GDP numbers show a recovery in two-quarter growth from 3.6% annualised to 4.7%, so the implication is that GDP prices fell at a faster rate (1.9% annualised versus 1.0%) – see chart 1.

Chart 1

Chart 1 showing China Nominal & Real GDP (% 2q annualised)

The stabilisation of two-quarter nominal GDP growth in H2 2023 mirrors sideways movement of six-month narrow and broad money growth during H1. Money trends, however, weakened sharply during H2, suggesting a further slowdown in nominal / real GDP in H1 2024 – chart 2.

Chart 2

Chart 2 showing China Nominal GDP & Narrow / Broad Money (% 6m)

Six-month narrow money momentum turned negative in late 2023 and is challenging the record low reached at end-2014. Weakness then rang policy alarm bells, contributing to an aggressive easing shift in 2015 that succeeded in reflating the economy and stocks.

Monetary optimists note that broad money growth is above the level reached then and in the middle of its range in recent years. A widening narrow / broad money divergence, however, suggests a faster rate of decline of broad money velocity, plausibly related to structural weakness in real estate and lack of confidence in policy.

Will the economy and markets be rescued by 2015-style easing? Developments in 2023 don’t inspire hope. The PBoC loosened policy during H1 but a new upswing in term money rates began soon after the appointment of new Governor Pan Gongsheng in July, with three-month SHIBOR closing 2023 at a 32-month high – chart 3.

Chart 3

Chart 3 showing China Interest Rates

Another change under Governor Pan has been the suspension of publication of the PBoC’s informative quarterly surveys of entrepreneurs, consumers and bankers – the Q3 surveys were never released and Q4 results would normally have appeared by now.

A possible interpretation is that the PBoC has switched to prioritising currency stability, managing rates higher to discourage capital outflows while passing the baton of economic support to fiscal policy (and withdrawing from providing information on economic developments).

Foreign exchange reserves were boosted by valuation effects in late 2023 (weaker US dollar, rally in Treasuries) but settlements data suggest sustained intervention to support the currency during H2, consistent with a persistent sizeable forward discount on the offshore RMB – chart 4.

Chart 4

Chart 4 showing China Foreign Currency Reserves (mom change, $ bn)

Fiscal stimulus focused on government-directed investment is unlikely to be sufficient to reverse economic weakness without accompanying monetary accommodation to lift private sector confidence and broad money velocity.

Are there any signs of the PBoC pivoting back to easing? One glimmer is that its lending to the banking system continued to expand rapidly in late 2023, which, together with a slower rise in government deposits at the PBoC, resulted in the second-largest quarterly rise in bank reserves on record – chart 5.

Chart 5

Chart 5 showing China PBoC Balance Sheet (RMB trn, 3m change)

The PBoC’s injections, however, may have been intended to moderate rather than reverse the rise in money rates. Three-month SHIBOR eased in early January but has stalled since – chart 3. Recent renewed US dollar strength may bolster the hard-liners.

Corporate businesspeople shaking hands in an office.

Recent market movements have been driven by a decline in bond yields and a repricing of a more optimistic scenario, where growth is resilient and inflation figures are falling fast. While mid-term trends look supportive, persistently high inflation could point to later interest rate cuts than markets currently expect.

Small caps shine in Europe

We believe that growth will remain steady in 2024 despite potential economic contractions in some regions during the first half of the year. European small caps continue to look attractive compared to their larger counterparts. As illustrated below, small caps are near their largest historical discount relative to large caps. Several industries still trade at very low valuations and could benefit from a potential re-rating. We believe the end of the destocking phase combined with lower interest rates should help in regaining momentum for European small caps.

P/E of STOXX small caps vs STOXX large caps

Source: Goldman Sachs.

Wage growth: a silver lining

Real wage growth is another indicator showing positive signs. An increase in wage growth could be beneficial for consumers and the broader economy. Companies’ responses to growing labour costs will be a key determinant for financial markets in 2024. Companies with strong pricing power should be able to raise prices again. Others might scale back labour, cut investments or accept lower profits. In summary, we expect earnings growth to be erratic and modest in 2024.

Factor investing in a dry liquidity climate

Regarding factor investing, liquidity has dried up in 2023 and small caps are underinvested in compared with other asset classes. According to JP Morgan, small caps in Europe have experienced their worst 23-month outflows in the last 15 years. However, November’s positive inflows may indicate a shift toward a more optimistic sentiment. A return to more normalized monetary policy should gradually improve liquidity and investment flows during 2024. Much like the adage “cash is king,” investors are likely to continue rewarding companies with decent dividends and buybacks.

M&A: the untapped potential for small caps

M&A activity is another potential catalyst that would favour smaller companies. M&A in 2023 has been low, as shown by the chart below, with a 70% decrease primarily due to fewer foreign buyers. Corporate sentiment, equity valuations and monetary conditions are key drivers of M&A activity. Reasonable equity valuations along with a normalizing monetary policy should enhance corporate sentiment toward M&A. With positive sentiment and plenty of balance sheet resources, a potential pickup in M&A could greatly benefit smaller companies.

Sources: Goldman Sachs, Bloomberg.

Navigating tomorrow’s market

As small caps gain traction and M&A activity hints at resurgence, the market presents a complex puzzle. The real insight emerges in piecing together these fragments to understand where the next wave of growth will come from.

This is the first of a series of short posts focusing on whether incoming economic news supports or contradicts the forecast of a global “hard landing” suggested by monetary trends. 

Flash results suggest that the global composite PMI new orders index – a timely indicator of demand momentum – fell for a fourth month in September, consistent with the monetary signal of a slide into early 2024, at least. 

The flash results, available for the US, Japan, Eurozone, UK and Australia, imply a decline through 50 to the lowest level since December, assuming no change in all other countries in the global aggregate – see chart 1. 

Chart 1

Chart 1 showing Global Composite PMI New Orders & G7 + E7 Real Narrow Money (% 6m)

Weakness in the flash surveys was driven by a further slowdown in services new business, with manufacturing new orders little changed – chart 2.

Chart 2

Chart 2 showing Global PMI New Orders / Business

Any hopes of manufacturing stabilisation, however, may be dashed by full September results incorporating China and other emerging economies. The equity analysts’ earnings revisions ratio correlates with Chinese manufacturing PMI new orders and weakened sharply this month – chart 3. 

Chart 3

Chart 3 showing China NBS Manufacturing PMI New Orders & IBES China Earnings Revisions Ratio

Renewed deterioration in Chinese / Asian manufacturing is also suggested by the Korean FKI survey for September, showing a relapse in the assessment of business prospects to the weakest since February – chart 4.

Chart 4

Chart 4 showing Global Manufacturing PMI New Orders & Korea FKI Manufacturing Business Prospects

Global six-month real narrow money momentum is estimated to have broken to a new low in August, reinforcing pessimism here about economic prospects and casting strong doubt on now widely-held “soft landing” hopes. 

Real money momentum bottomed in July 2022, recovered during H2 but suffered a relapse in early 2023, retesting the 2022 low in April. The relapse has been reflected in a renewed downswing in economic momentum, as proxied by global composite PMI new orders – see chart 1. 

Chart 1

Chart 1 showing Global Composite PMI New Orders & G7 + E7 Real Narrow Money (% 6m)

A tentative stabilisation of real money momentum over the summer suggested that PMI new orders would bottom out around year-end. The further move down in August, if confirmed, signals deeper and more extended economic weakness. 

The August estimate is based on monetary data covering 70% the global (i.e. G7 plus E7) aggregate and near-complete CPI results. 

The suggested fall to a new low reflects both additional nominal money weakness and an oil-price-driven recovery in six-month CPI momentum – chart 2. 

Chart 2

Chart 2 showing G7 + E7 Narrow Money & Consumer Prices (% 6m)

The ongoing oil price rally suggests a further near-term rise in headline CPI momentum – chart 3. A core slowdown, however, is expected to continue and may accelerate as higher oil costs squeeze spending on other items. 

Chart 3

Chart 3 showing G7 + E7 Consumer Prices & Commodity Prices (% 6m)

The further fall in real narrow money momentum has been driven mainly by China and India – chart 4. An earlier post attributed Chinese monetary weakness to misguided policy tightening in late 2022, which has since been partially reversed. Chinese August money numbers suggest greater damage from the misstep than previously assumed, implying a more urgent need for additional policy easing. 

Chart 4

Chart 4 showing Real Narrow Money (% 6m) Early Reporters

An August estimate of global industrial output is not yet available but a large negative differential between six-month rates of change of real narrow money and output is likely to have persisted – chart 5. 

Chart 5

Chart 5 showing G7 + E7 Industrial Output & Real Narrow Money (% 6m)

As previously noted, global equities have underperformed cash since this differential turned negative in early 2022 (allowing for reporting lags), despite a rally over the last 12 months. 

Why was weakness compressed into the first nine months of 2022, with a subsequent strong rebound? 

One explanation is that the Ukraine invasion and associated immediate further upward pressure on energy prices exaggerated the market response to monetary deterioration. Positioning and sentiment reached oversold extremes in late 2022, creating the potential for a relief rally as energy markets adjusted and prices fell back. 

Another possibility – admittedly difficult to assess – is that the “excess” money backdrop has been less unfavourable than suggested by the six-month momentum differential shown in chart 5, because of the existence of an overhang from the 2020-21 monetary surge. An excess stock of money, in other words, may have persisted despite the flow turning negative. 

The ratio of the stock of real narrow money to industrial output has trended higher over time, with the increase reflected in rising real asset prices and wealth – chart 6. 

Chart 6

Chart 6 showing Ratio of G7 + E7 Real Narrow Money to Industrial Output* & 2000-19 Log-Linear Trend *Index, June 1995 = 1.0

A huge overshoot in 2020-21 has been correcting since late 2021 but the ratio was still above its pre-pandemic trend at end-2022, i.e. the negative flow differential had not fully offset the prior period of excess.

The stock and flow signals, however, are now aligned: the real money / output ratio moved below trend in early 2023 and its July level was the lowest since February 2020 before the policy response to the pandemic and subsequent monetary surge.

NASA image of a huge hurricane between Florida & Cuba.

This week, Global Alpha is looking at the increased frequency of natural disasters and how climate change is affecting the insurance industry.

The recent wildfires in Hawaii, the deadliest in over 100 years, is the latest in a long line of severe natural disasters. The town of Lahaina was hardest hit as damage assessment maps indicate over 2,200 buildings were destroyed or suffered some harm. Rebuilding Lahaina has been estimated to cost $5.5 billion.

Just this past Friday, a significant earthquake registering 6.8 on the Richter scale shook Morocco, leading to early estimates of over 2,800 casualties and causing severe damage to historic sites in Marrakesh. This comes after an event in February this year when Turkey and Syria were hit by an earthquake measuring 7.8 on the Richter, followed by aftershocks reaching up to 7.5. In that catastrophe, thousands of buildings collapsed, resulting in thousands of injuries and tens of thousands of deaths. It became the deadliest global disaster since 2010 and ranks as the 11th deadliest event in recorded history. Beyond the loss of life, financial assessments from the government of Turkey, the World Bank, the UN and the EU estimate the economic loss at around $91 billion, making it the 11th most costly disaster globally, after adjusting for inflation. Both events have underscored the need for stricter enforcement of modern building codes. In Syria and Turkey, a number of the buildings that fell, including newer multi-story residential structures, should have had sufficient structural integrity to mitigate significant fatalities.

Closer to home, there has been an extended period of wildfire activity across many Canadian provinces. While many of the wildfires occurred in remote regions far from major population centres, total insured losses are expected to reach several hundred million dollars and thick smoke caused hazardous air conditions in the Northeast. In June, New York and Montreal both recorded the worst air quality in the world.

Overall, the first half of 2023 experienced the highest economic impact from catastrophes since 2011, and the fifth highest on record, with the highest ever number of at least $1 billion insured loss events (18 versus the historical average of 7).

The end result is that insurers are choosing to limit exposure in some markets. Reinsurance companies are raising their rates to insurers to help cover losses above certain levels. These higher rates get passed on to consumers and other insurance buyers. Recently, State Farm and Allstate announced they are no longer providing insurance in California, the most populated US state. Reasons for their withdrawal include increased catastrophe exposure, construction costs and the reinsurance market. A similar situation is unfolding in hurricane-prone Florida, where property insurance costs are skyrocketing and Farmers Insurance pulled out of the state altogether, citing increased risk exposure.

Global Alpha holds two insurers: RLI Corp. (RLI.US) and Vienna Insurance Group (VIG.AV).

RLI is a specialty insurance company with more than 50 years of experience serving the property, casualty and surety markets. RLI focuses on niche markets that need deep and unique underwriting expertise. The company operates on both an admitted and non-admitted basis with exposures predominately in the US. RLI had some exposure to the Hawaiian wildfires primarily due to homeowner insurance in the state and recently announced its loss estimates. Although preliminary in nature, RLI estimates pretax net catastrophe losses of $65 million to $75 million related to 200 structures. These losses will be reflected in Q3-2023 results. RLI regularly monitors and attempts to manage exposure to catastrophes by limiting concentrations of locations insured to acceptable levels and by purchasing reinsurance. Catastrophe exposure models can help assess risk, but are inherently uncertain due to the sporadic observations of actual events.

Vienna Insurance Group offers insurance solutions in the property and casualty, life and health business across approximately 30 countries in Central and Eastern Europe. Vienna has a climate change strategy that provides general principles for dealing with climate change and guidelines for investments and insurance operating business. One of the first initiatives was to eliminate investments in the coal sector and significantly limit insurance coverage for new coal mining and coal-fired power plant projects. The company’s scenario analysis highlights the main natural risks as flooding, winter storms and summer (hail) storms. Science is expecting the risk of flooding and hailstorms to increase. The 2021 flooding in Bernd, Germany led to unexpectedly large losses while the same year also saw severe hailstorms in Austria and a tornado in the Czech Republic. As for winter storms, the risk is expected to increase in some countries and decrease in others. Vienna offers insurance coverage in Turkey, albeit in the less affected western part of the country. Nonetheless the company announced an expected gross impact (including active reinsurance) of €170 million.

The world is currently observing a warmer El Nino phase that often leads to shifting rainfall patterns in different parts of the world. For example, more flood-related losses have been reported in Europe, the Middle East and Africa during El Nino phases. Insurance companies have always been concerned with potential losses due to natural risks. Global warming is highlighting the critical nature of this problem. As we confront a world where the frequency and severity of natural events are exacerbated by climate shifts, the question becomes: are insurance models robust enough to adapt, or will we find ourselves financially unprepared for the evolving landscape of risk?

A “double dip” in the global economy suggested by monetary trends appears to be playing out, with weakness likely to intensify into late 2023. 

The global composite PMI new orders index – a timely coincident indicator – continued its decline from a May peak last month. A relapse had been suggested by a fall in six-month real narrow money momentum from December 2022 – see chart 1. 

Chart 1

Chart 1 showing Global Composite PMI New Orders & G7 + E7 Real Narrow Money (% 6m)

The year-to-date low in real money momentum occurred in April but there was little recovery through July and another decline is possible. The suggestion is that the PMI will fall further into Q4 and remain weak into early 2024. 

As expected, the composite PMI fall is being driven by services converging down towards weak manufacturing – chart 2. The August decline in services new business reflected a plunge in demand for financial services and a further consumer slowdown, with a partial offset from a minor recovery in business services after a larger July drop – chart 3. 

Chart 2

Chart 2 showing Global PMI New Orders / Business

Chart 3

Chart 3 showing Global Services PMI New Business

The ending of the services mini-boom, which fuelled recent employment gains, suggests a faster loosening of labour markets. Unemployment rates have reached 12+ month highs in the US, France, the UK and Canada, while a rise appears to be under way in Japan – chart 4. 

Chart 4

Chart 4 showing Unemployment Rates

Previous posts suggested that a bottoming out of the stockbuilding cycle would support manufacturing new orders later in 2023. The cycle downswing, however, could be extended by delayed inventory cut-backs in the Eurozone: stockbuilding bounced back in Q2 as final demand contracted sharply, with recent adjustment lagging far behind the US / UK – chart 5. 

Chart 5

Chart 5 showing Stockbuilding as % of GDP