A post in October gave a hopeful view of Chinese prospects, noting that “excess” money had accumulated and could flow into equities and the economy if policy-makers signalled a commitment to expansion.
The consensus is now optimistic, believing that property market support measures and the removal of pandemic control restrictions will result in strong economic acceleration through 2023. Yet the latest money / credit data signal caution.
Globally, Chinese reopening is expected to be reflationary. Reopening, however, will release supply as well as demand. The former effect could dominate, resulting in additional downward pressure on Chinese export prices.
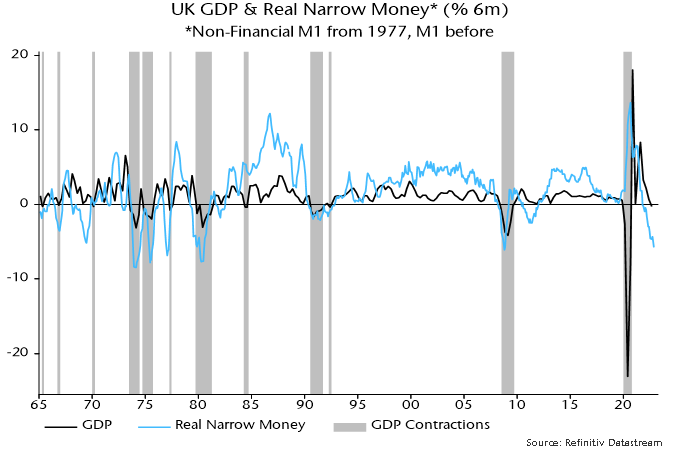
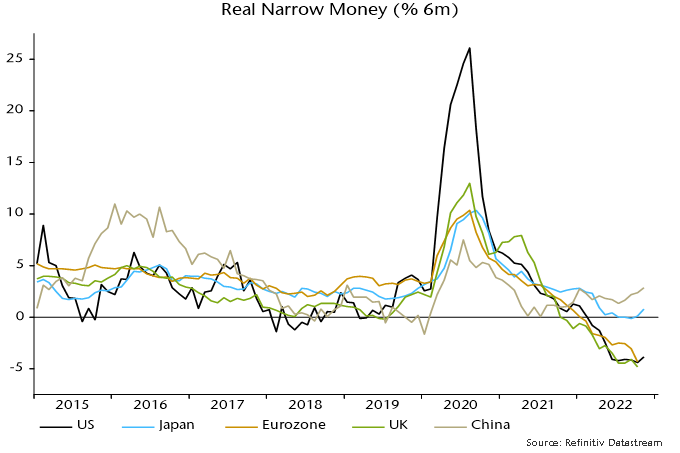
Six-month growth of true M1 peaked in July 2022, falling back to its March level in December – see chart 1. This suggests a slowing of underlying nominal GDP momentum from Q2. The levels of nominal and real narrow money growth are modest by historical standards.
Chart 1
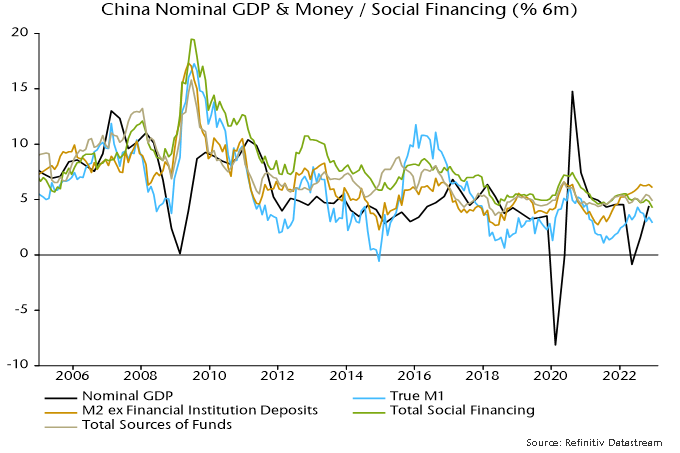
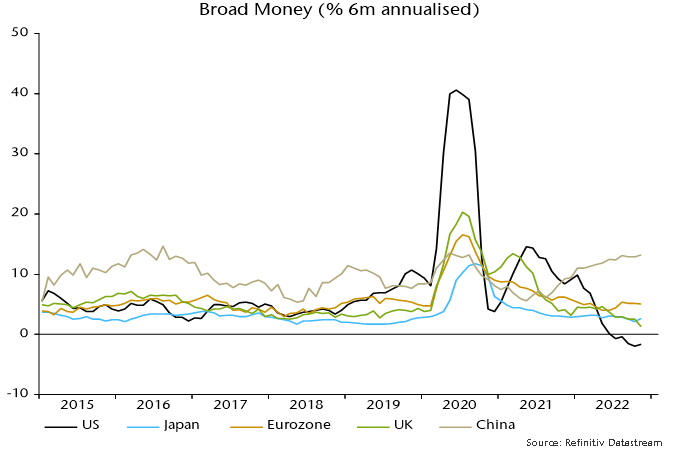
Broad money trends are stronger, with six-month growth of the favoured measure here – M2 excluding deposits of non-bank financial institutions – ending 2022 near the top of its range in recent years. Money, however, needs to shift from time deposits into M1 to signal rising confidence and spending intentions.
Broad money growth may have been inflated by a switch out of wealth management products and other bank liabilities into deposits. The total stock of bank funding has been growing less strongly, with minimal acceleration since 2021 – chart 1.
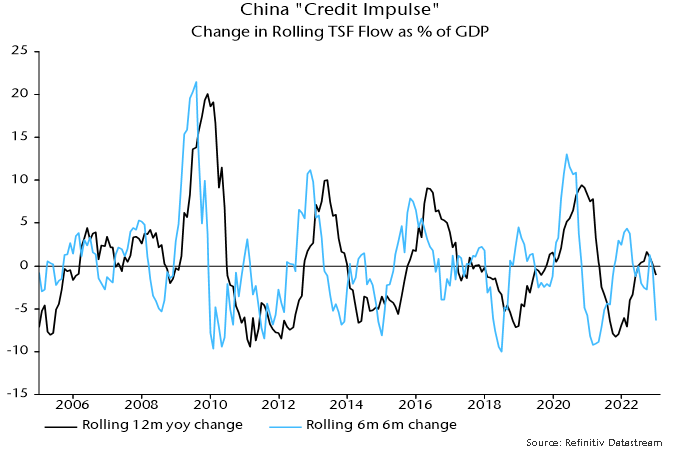
Many analysts follow the “credit impulse” – the rate of change of credit growth, usually expressed relative to GDP. This often gives the same message as narrow money trends (but is judged here to be less reliable) and also suggests a loss of economic momentum – chart 2.
Chart 2
Bulls argue that excess household savings will fuel a consumption boom, drawing parallels with G7 experience following reopenings. Chinese households did not receive stimulus checks or direct wage support and the excess is likely to be considerably smaller, implying less pent-up demand.
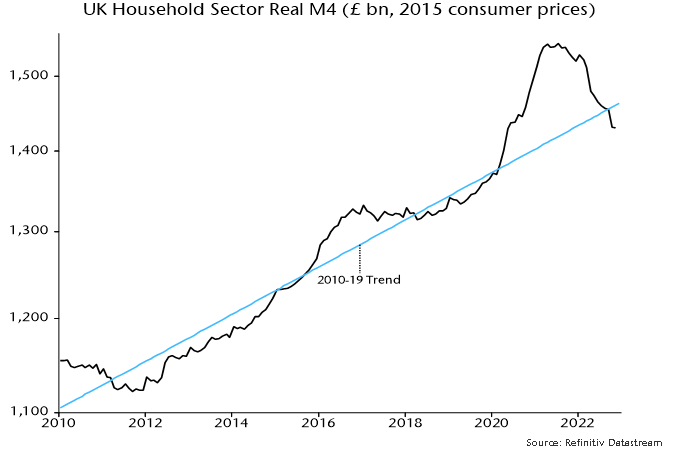
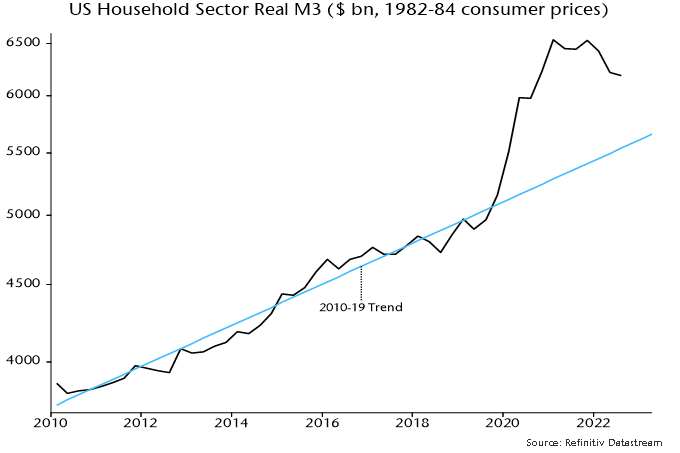
Supporting this view, household real M2 deposits in December were 8% above their pre-pandemic trend (and may have been inflated by the early timing of the Chinese New Year) – chart 3. US household real M3 holdings reached a peak 24% overshoot of the comparable trend in March 2021 – chart 4.
Chart 3
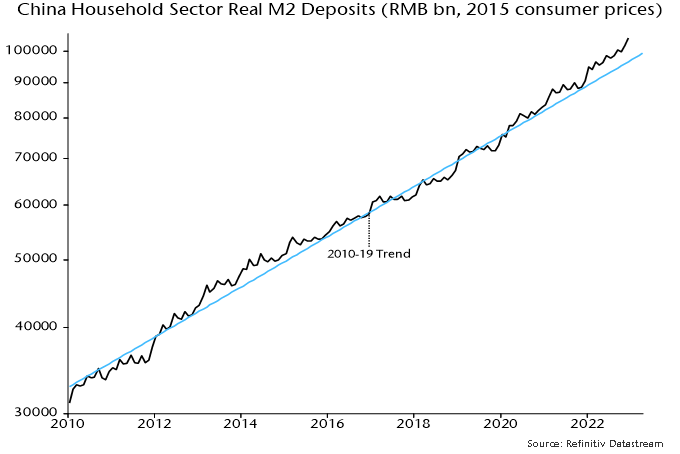
Chart 4
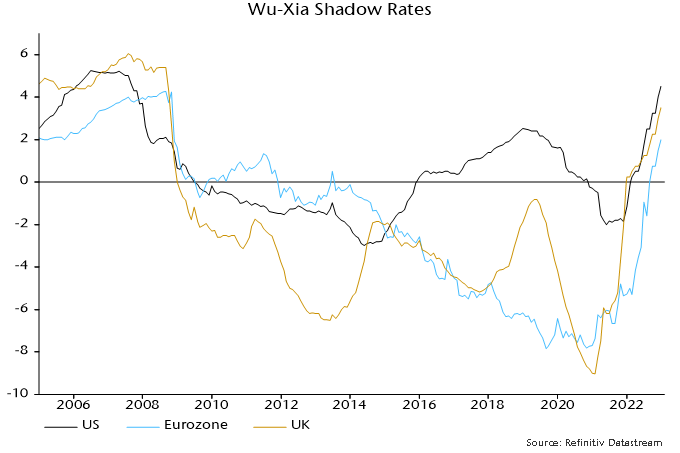
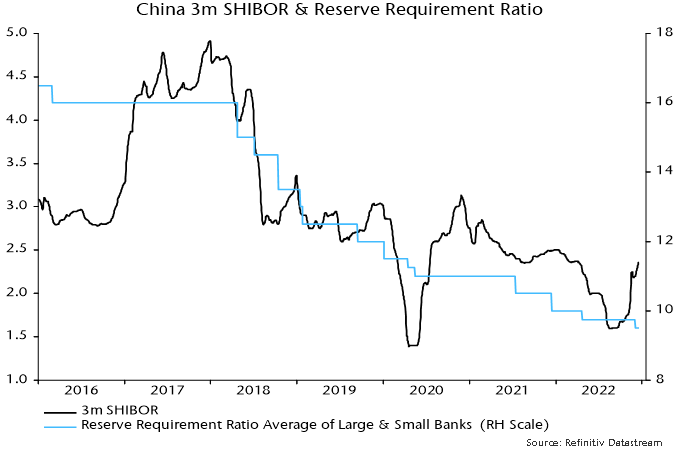
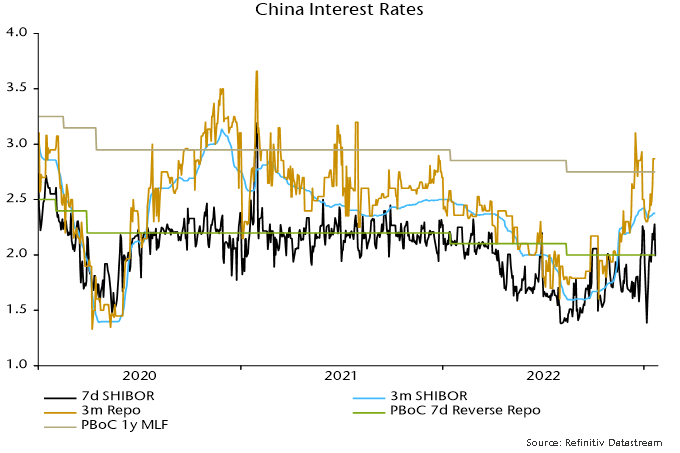
Fed policy remained expansionary as pandemic drags faded. The PBoC, by contrast, appears concerned about inflationary risks from rapid reopening and has engineered or at least tolerated a significant rise in term money rates. The increase in late 2022 was universally dismissed by China specialists as a year-end phenomenon unrelated to any policy shift but a minor fall in early January has since given way to another rise – chart 5.
Chart 5
The view here is that the reopening boost to domestic demand will be modest and biased towards services. For goods, supply expansion due to reduced disruption may outweigh the lift to demand.
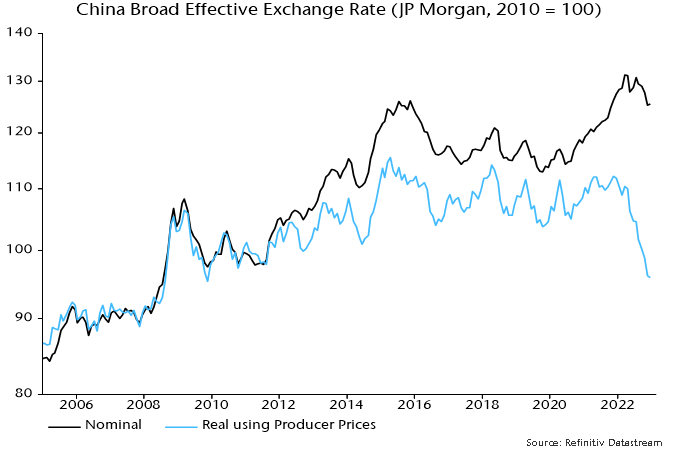
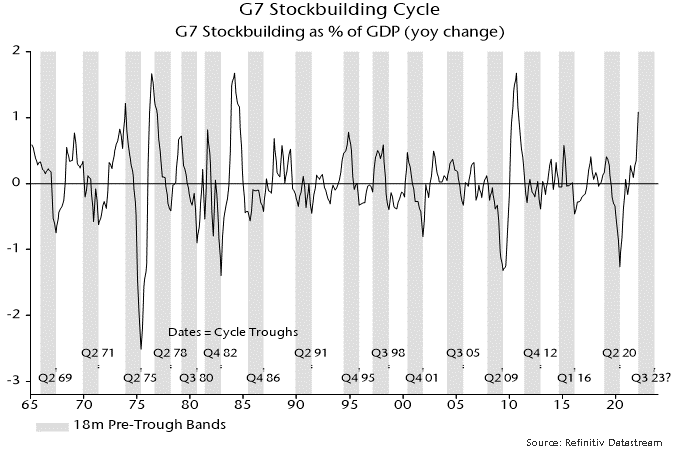
Global trade moved into contraction in late 2022, partly reflecting an accelerating downswing in the global stockbuilding cycle. With supply constraints easing, Chinese exporters are likely to cut prices to increase market share, especially given the super-competitive level of the RMB – chart 6.
Chart 6