Summary
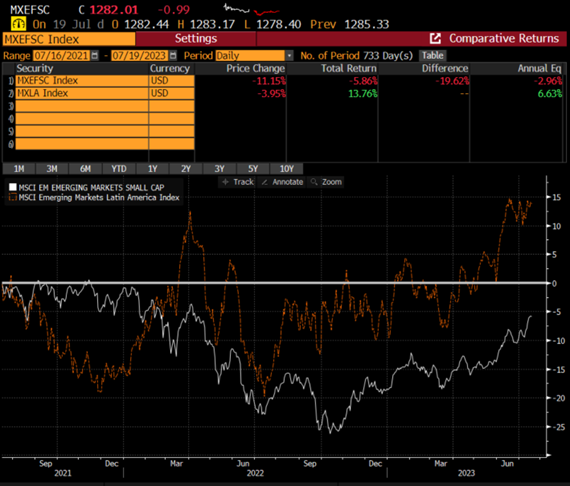
- Emerging markets were stronger through July, led by a bounce in Chinese equities on announcements from a Politburo meeting that authorities would step up support for the economy.
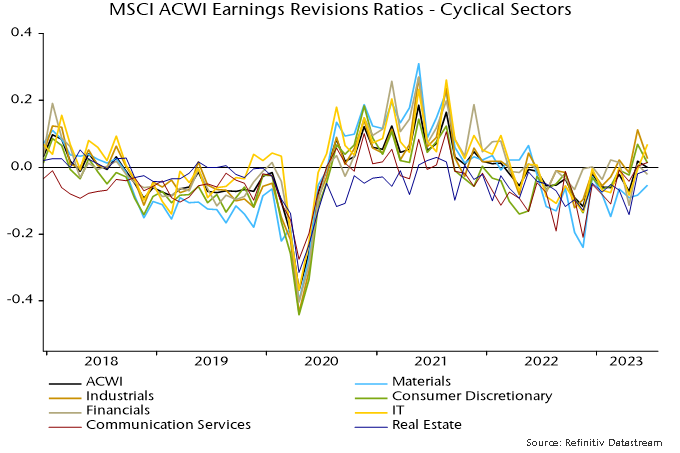
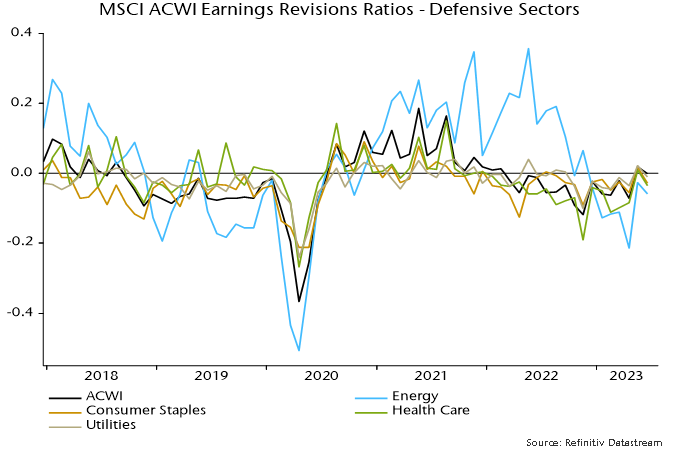
- Materials, energy and consumer discretionary sectors performed well on talks of a global economic soft landing and China stimulus.
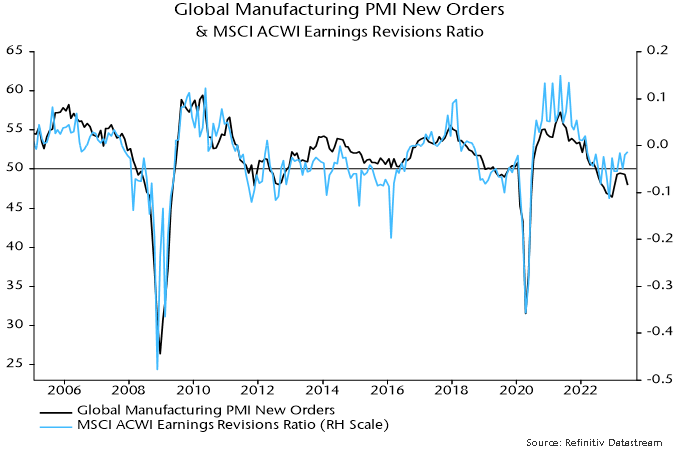
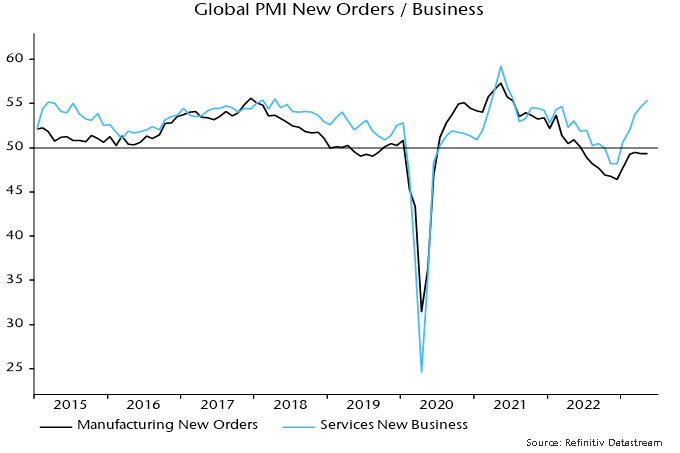
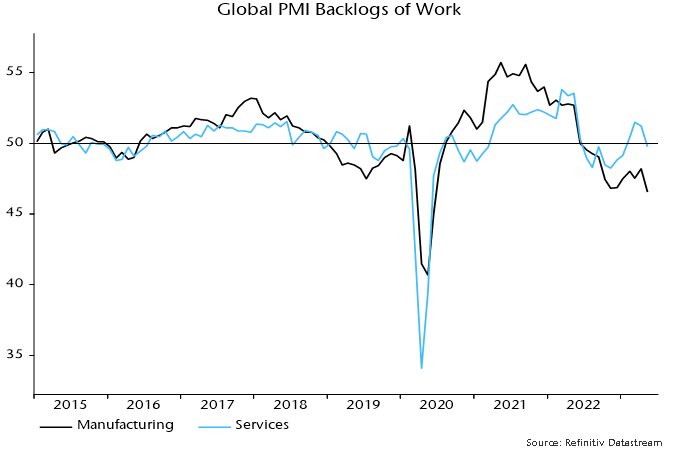
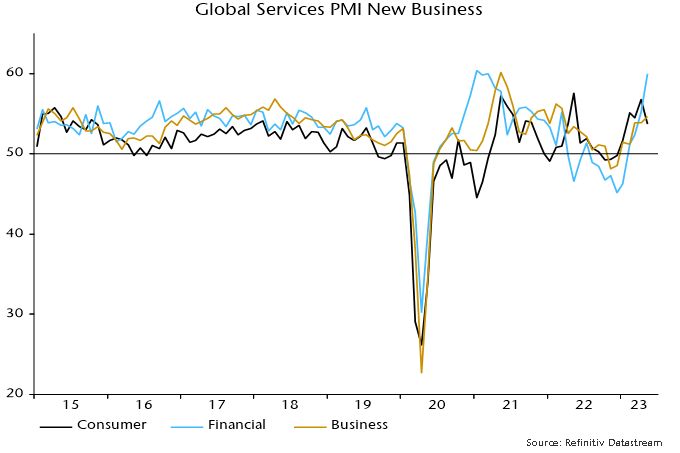
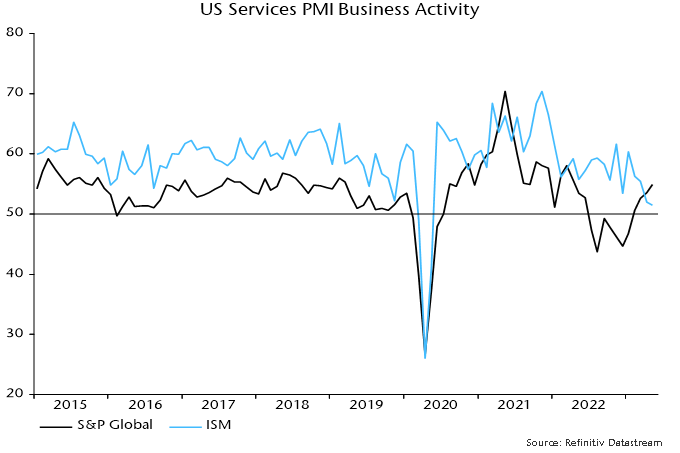
- We are not tempted to chase the rally in more cyclical parts of the market. The global monetary backdrop suggests risk of a head fake for investors expecting a soft or no landing, our view being that global PMIs are likely to roll into the end of 2023.
- Brazil is the first major emerging market to initiate rate cuts, with the Central Bank surprising markets with a 50 bps cut to the Selic policy rate, which now stands at 13.25%.
- While positive and signalling the capacity for many major emerging markets to ease policy as DM central banks pause, Brazil is vulnerable to weak commodities prices as the global economy slows. Narrow money numbers in Brazil are also very weak and indicating risk of a sharp domestic slowdown, while the currency looks vulnerable to a pullback from elevated levels.
Despite the bounce, bearish sentiment for Chinese equities prevails, with headlines dominated by foreign investor revulsion over the perceived fragility of the economic recovery and geopolitical overhang. This has been a tough market for our fund, with many of the high-quality names we hold underperforming as foreigners exit, and while domestic mutual fund investors favour SOEs on hopes that a government-backed reform drive will act as a catalyst for more dynamic management of what have historically been highly inefficient businesses. The low-hanging fruit for the SOEs will be cost cutting, with bloated headcounts being the obvious target. However, we question whether the political appetite for this exists in Beijing given high levels of national unemployment (with youth unemployment of at least 20%).
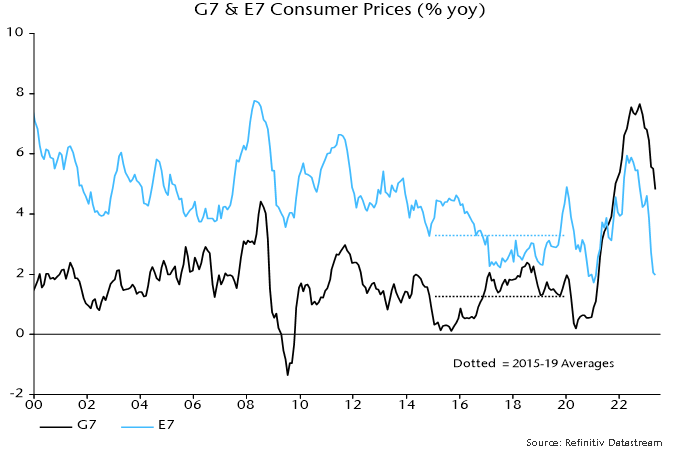
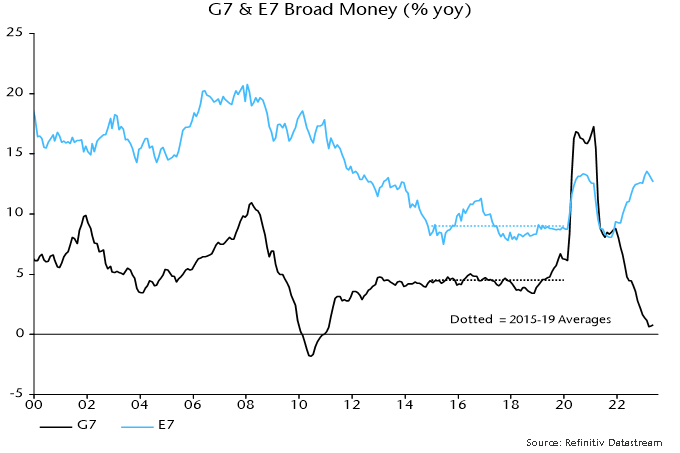
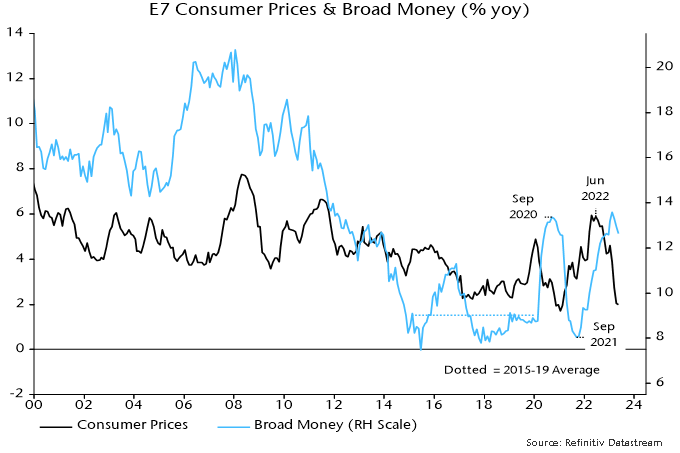
We have been writing for nearly a year on China’s monetary backdrop, which while not inspiring in absolute terms, looks much better than many other parts of the world, especially relative to major developed markets. While EM and global investors have been disappointed by the absence of a reopening boom in consumption akin to what we saw in the West, economic recovery is indeed underway.
However, recent data covering consumption, property prices and industrial production tells us that this recovery is fragile and risks rolling without further support. Following a meeting of the Politburo in late July, the authorities have signalled that concrete support is on its way. Better late than never.
Just as central banks and governments in the West were slow to turn off the monetary and fiscal taps as vaccines were rolled out and lockdowns ended, Chinese authorities have been too reactive in managing the recovery. Rather than relying on forward-looking indicators to guide proactive policy, the CCP prizes hard but backward-looking data. This is compounded by the deterioration of China’s institutional quality, as Xi’s consolidation of power has squeezed out dissenting voices in government, the wider party, economic and political think tanks, and in the private sector. This makes for slow and reactive decision-making, and many investors are not keen to wait around, adopting what we refer to as an “anything but China” footing, or ABC for short.
The risk to ABC is an unexpected policy reversal by China’s authorities that wrong-foots the market. They have form, such as the backflip on the regulation of China’s gaming sector – from “spiritual opium” in 2021 to an indispensable pillar of China’s development in 2022 – as fuel for the development of strategic technologies such as AI. Xi throwing in the towel on zero-COVID following protests set off by the tragic fire in a locked-down apartment block in Urumqi, Xinjiang, surprised investors and was the catalyst for a huge rally from October 2022 through to the end of the year.
While many investors and commentators will wait for something decisive from authorities before any pivot, there are signals that they are already taking action. Monetary policy changes in China aren’t announced (similar to the Fed decades ago). The first sign of loosening is often an easing of money market rates as the PBoC adds liquidity via open market operations. The PBoC’s reverse repo rate is supposed to act as a floor for rates, so if the PBoC allows the 7-day SHIBOR rate to trade below the reverse repo rate for any period, there is a good chance the latter will be cut. We can see this in the chart below from NS strategist and economist, Simon Ward.
7-day SHIBOR has been trading soft MTD
China interest rates
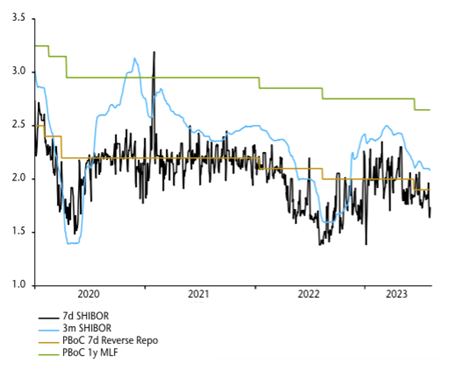
Source: Refinitiv Datastream
This suggests improving liquidity and another rate cut. We have written previously on our reservations about China’s development path and deteriorating institutional quality in particular. While this is a structural negative that hurts the longer-term picture for China, there is a potential cyclical opportunity for investors as meaningful monetary stimulus would drive a revival of animal spirits.
India’s HDFC merger makes combined entity one of the largest banks in the world
The merger of Housing Development Finance Corporation and HDFC Bank (both long-term portfolio holdings) in July was the largest in Indian corporate history. The combined loan book will stand at around 22 trillion rupees ($275.8 billion) and will make it one of the largest banks in the world by market cap – behind only JP Morgan Chase, ICBC and Bank of America. According to management, the merger synergies will outweigh the costs due to lower costs of funding, and the expansion of the mortgage business footprint by offering HDFC products across all 6,500 branches of HDFC Bank (from current presence in 2,500 branches).
A combined and more efficient entity will tap into HDFC’s status as India’s oldest and largest mortgage company, and market leader by virtue of wide distribution reach, robust asset liability management and tight control of operating costs. This leaves it well-positioned to harness multiple structural tailwinds that are set to drive growth in India’s housing market, which include:
- The rise of a massive and increasingly urbanised middle class (32% of the Indian population reside in cities, estimated to be 40% by 2030), which will act as a major structural source of demand.
- Around 66% of the population is below 35 years of age, with the average age of a home buyer being 38.
- Low mortgage penetration, with India’s mortgages as a percentage of nominal GDP at only 11% versus over 20% for broader Asia.
- Housing affordability over the past decade has improved as incomes rise while housing prices have been stagnant.
Mortgages as a % of nominal GDP
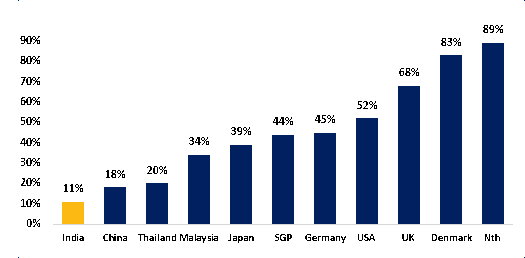
Source: HDFC investor presentation 4Q 2022
Affordability ratio (home loan payment/income ratio)
Source: Jefferies Indian housing sector research 2022
Unsurprisingly, valuations are rich for such a robust growth profile and high quality management, but have softened recently as the merger played out. The merger is likely to be accretive and allow foreigners to hold an additional 10% in the combined entity, allowing investors to increase exposure to one of EM’s strongest structural stories in the rise of the Indian middle class.