Le Groupe financier Connor, Clark & Lunn, l’une des plus importantes sociétés indépendantes de gestion de placements au Canada, a annoncé aujourd’hui le lancement de l’ICAV OPCVM Connor, Clark & Lunn. Le Fonds OPCVM d’actions de marchés émergents Q CC&L et le Fonds OPCVM d’actions mondiales Q neutre au marché CC&L font partie des sous-fonds initiaux. Le gestionnaire de placement est Gestion de placements Connor, Clark & Lunn Ltée (Gestion de placements CC&L), une équipe de 100 professionnels de Vancouver qui gère un actif de 41,7 milliards de dollars américains dans diverses catégories d’actif.
Le Fonds OPCVM d’actions de marchés émergents Q CC&L est une stratégie à gestion active composée exclusivement de positions acheteur sur des actions qui vise une croissance du capital à long terme par rapport aux indices boursiers des marchés émergents.
Le Fonds OPCVM d’actions mondiales Q neutre au marché CC&L est une stratégie à gestion active composée de positions acheteur et vendeur sur des actions qui vise à produire des rendements présentant une faible corrélation avec les marchés boursiers mondiaux et à maximiser le rendement total à long terme.
« Nous gérons avec succès des stratégies quantitatives d’actions depuis plus de 20 ans. Le lancement de ces fonds OPCVM permet aux investisseurs européens d’avoir accès à nos stratégies relatives aux marchés émergents et neutres au marché », se réjouit Martin Gerber, président et chef des placements de Gestion de placements CC&L.
La philosophie de placement de Gestion de placements CC&L repose sur le fait que les cours des actions sont établis en fonction des paramètres fondamentaux de croissance, de valorisation et de qualité de leurs sociétés sur un horizon à long terme. Toutefois, le processus de marché qui fait en sorte que les prix reflètent ces paramètres fondamentaux de façon juste n’est pas parfait. En effet, nombreux sont les obstacles et points de friction de nature comportementale, informationnelle et structurelle qui peuvent empêcher que le cours des actions reflète ces paramètres fondamentaux. Il en découle des évaluations inexactes sur le marché qui constituent des occasions d’ajouter de la valeur. Ces occasions font l’objet d’un processus systématique par lequel chaque société est évaluée objectivement par rapport à l’ensemble de l’univers mondial de Gestion de placements CC&L, lequel est composé d’environ 16 000 titres, 160 secteurs d’activité et 49 pays développés et émergents. Ce processus quotidien a pour résultat un portefeuille optimal qui investit constamment et objectivement dans les sociétés qui procureront les meilleurs rendements possibles tout en limitant rigoureusement le risque.
« C’est grâce à son équipe chevronnée et à son approche rigoureuse en matière de placements que Gestion de placements CC&L peut étendre avec succès sa gamme de produits en Europe », indique Warren Stoddart, cochef de la direction du Groupe financier Connor, Clark & Lunn.
L’ICAV OPCVM Connor, Clark & Lunn est un instrument irlandais de gestion collective d’actifs qui est constitué sous la forme d’un
fonds à compartiments avec responsabilité distincte entre les sous-fonds et géré par Carne Global Fund Managers (Ireland) Limited. HSBC Global Fund Services agit à titre d’administrateur, de registraire, de dépositaire et d’agent de transfert, et Matheson agit à titre de conseiller juridique en ce qui a trait aux lois irlandaises.
Si vous souhaitez en savoir plus sur les sous-fonds, cliquez ici pour consulter les prospectus, les suppléments et les renseignements clés à l’intention des investisseurs.
À propos de Gestion de placements Connor, Clark & Lunn Ltée
Gestion de placements Connor, Clark & Lunn Ltée (Gestion de placements CC&L) est l’une des plus importantes sociétés de gestion de placements indépendantes au Canada (elle appartient à ses associés) et gère un actif de plus de 41,7 milliards de dollars américains. Fondée en 1982, elle propose une gamme diversifiée de solutions de placements traditionnels (actions, titres à revenu fixe et placements équilibrés) et non traditionnels (stratégies neutres au marché, à alpha portable et à rendement absolu). Gestion de placements CC&L est membre du Groupe financier Connor, Clark & Lunn Ltée.
À propos du Groupe financier Connor, Clark & Lunn Ltée.
Le Groupe financier Connor, Clark & Lunn Ltée (Groupe financier CC&L) est une société de gestion de placements regroupant plusieurs sociétés, qui offre un large éventail de produits et de services de gestion de placements aux investisseurs institutionnels, aux particuliers fortunés et aux conseillers. Cette structure nous procure une envergure et une expertise considérables qui nous permettent d’assumer des fonctions administratives qui ne sont pas liées aux placements tout en laissant nos gestionnaires de placement se concentrer sur ce qu’ils font le mieux grâce à la centralisation des activités liées aux opérations et à la distribution. Possédant des bureaux un peu partout au Canada, de même qu’à Chicago et à Londres, les sociétés affiliées au Groupe financier CC&L gèrent des actifs totalisant plus de 70 milliards de dollars américains. Pour obtenir de plus amples renseignements, veuillez consulter le site www.cclgroup.com.
Personne-ressource
Carlos Stelin Directeur, Ventes institutionnelles (Europe) Connor, Clark & Lunn UK +44 (20) 3535-8107 [email protected]
This year has started on strong footing for global mergers and acquisitions (M&A). According to Refinitiv, global M&A hit a new record of $1.3 trillion as of March 31st, 2021.[1] What is driving this boom? On the news we have seen many big deals take shape, from GE divesting its business to Canadian Pacific expanding its footprint. But behind the headlines, something else is accelerating M&A activities, especially in the Unites States (US). We are talking about SPAC, which alone represent about 25% of the total deal volume in the US.
The first quarter of this year was also one of the busiest for IPOs, of which, once again, SPACs took the limelight. There were 296 SPACs raising $87 billion, a 20-fold increase over the same period last year.
First, a sponsor raises capital and incurs the cost of an IPO in a new shell company. To make the deal attractive to investors, the units are usually priced at $10 each and provide a warrant to buy more shares. The sponsor then has 12 to 24 months to find the target. If no target is found, or if the investors decide to vote “no” on the deal, the holders can redeem their investments.
We have seen this movie before
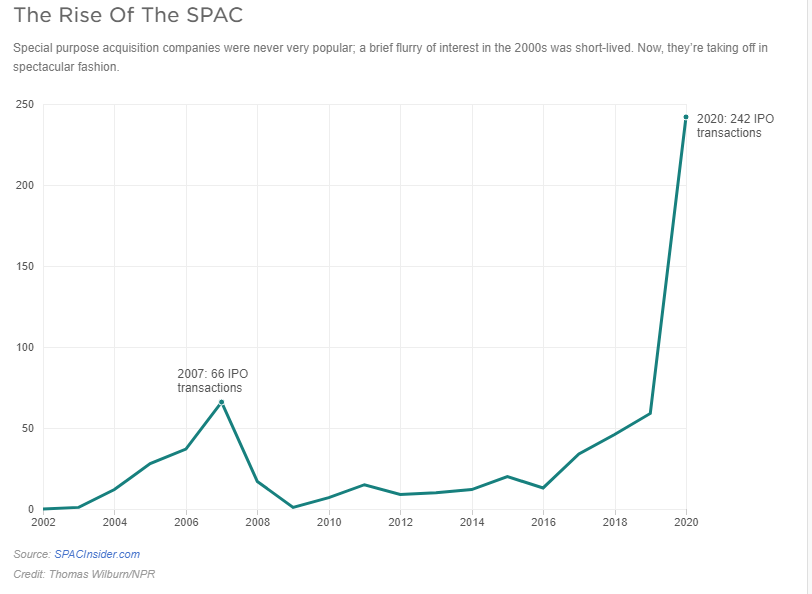
SPACs are in their third decade of existence. In the early 1990s, they were marketed as vehicles that helped small companies go public, while offering outsized favourable terms to their sponsors. In the late 90s, SPACs took a back seat. After all, why would a company do a reverse merger when you could easily raise money during the tech bubble? SPACs enjoyed a renaissance in late 2002, peaking at 66 IPOs just before the great financial crisis. They reappeared in early 2016, and have been going strong ever since. According to SPAC Analytics, in 2020, SPACs were 55% of IPOs, compared to 4% in 2013. So far this year, SPACs represent 79% of total IPOs.
SPACs versus a traditional IPO
SPACs are a pure genius way of going public. Since there is no identified target, a sponsor’s prospectus has no information about the business or the strategy. On the other hand, an IPO roadshow raises a lot of questions and invites a lot of scrutiny from investors.
In an IPO, there is no guarantee on the final valuation of the company. With a SPAC, the IPO has been done, and you have negotiated the valuation of your company with the sponsor. Plus the due diligence required for a merger is much less than SEC requirements for a regular IPO.
Cost could be another key factor. An IPO can cost anywhere between one to seven percent in fees for investment banks. With a SPAC, the underwriter may charge about five to six percent. However, there are other fees associated with the merger, which can end up being almost 20-25 percent of the total money the sponsor may raise.
Why are SPACs so popular?
A recent Wall Street Journal article counted 61 sports-related SPACs formed this year alone, compared to just five in 2019.[2] Athletes from Serena Williams, Stephen Curry, Naomi Osaka, Tony Hawk, Colin Kaepernick, and even Shaquille O’Neal, have shown interest in SPACs.
Everyone loves money, especially free money. SPAC founders and sponsors generally get about 20% of the shares of the SPAC as a fee for raising capital, finding the target, and, of course, giving it their brand name. Hedge Funds like it because they can use leverage to buy SPACs and also get preferential access to SPAC deals at the $10 share price. Everyone else has to wait and likely pay a higher price.
Most investors don’t read the annual reports of the companies they own, so they miss out on the fine print in the SPAC prospectus. For example, many are unaware of the lock-up period, which can be anywhere from six months to a year. Once the lock-up period is over, the floodgates open and add pressure to the stock price.
The clock is ticking?
SPACs don’t have time on their side because there is a limited window to close a deal. Targets are well aware of this restriction. They also know that a SPAC is required to spend at least 80% of its assets on a single deal. So the target always has the advantage. SPACs are paying a median price-to-sales ratio of 12.9, compared to 4.1 paid by other companies, according to 451 Research.[3]
SPAC-mania has been going on for a few years now, which means there is a lot of capital chasing deals, combined with ticking clock syndrome, which signals an inevitable decline in deal quality. We could easily see the SPAC bubble go bust once again.
How have SPACs performed historically?
A team of researchers analyzed completed mergers from January 2019 and June 2020, and found that SPACs lost 12% within the first six months, and dropped 35% on average after the first year. Bain & Co looked at 121 SPAC mergers from 2016 to 2020 and concluded that “more than 60% have lagged the S&P 500 since their merger dates, and 50% are trading down post-merger”. The other 40% are trading below the $10 IPO price.
At Global Alpha, we do not invest in SPACs. Our focus is on finding high-quality companies with defensible business models and strong balance sheets that should outperform the small-cap benchmark.
‘Utility: the state of being useful, profitable or beneficial’
Ask any respectable scientist or engineer how they achieved distinction, and they will likely tell you that they stood on the shoulders of giants. Such is the nature of their fields – you build upon the work of your predecessors. However, it would be a mistake to think that this is the only approach to development. Sometimes the best solutions come from scrapping the previous script, redefining the problem and standing on your own two feet.
Take the modern banking system as an example. While it has been tweaked and nudged into the digital age, the system is still – at its core – an iteration of a centuries old industry. If you look closely enough, not a lot has changed from the principles set out in the 15th century (and still employed to this day) by the Banca Monte dei Paschi di Siena. It is a rather extraordinary idea when you think about it, and one that stokes an interesting discussion internally when we ask ourselves what if we had the luxury of redesigning the system from scratch? Would we arrive at the same modern day setup? Would we see a need for a network of bank branches, for instance? Would utility bills and signatures be our preferred means of identity authorization?
In our view, it is a resounding no. But such is the consequence of an iterative process and a series of shortsighted ‘quick fixes’ that seldom appear shortsighted at the time (e.g. replacing cheques with debit cards); they assume a very different perspective when we take a step back. If we deconstruct ‘banking’ into the core utility on which it was designed – the store of wealth and the transfer of money – then it becomes apparent that the major providers of utility in most markets are no longer the banks. The value proposition is shifting from ‘where is the safest place to store my money’ to also include ‘what is the most seamless and cost effective way to transfer and manage my money’. The once dominant financial institutions are seeing their power eroded by technologically enabled disrupters, leveraging off mobile solutions, data and APIs.
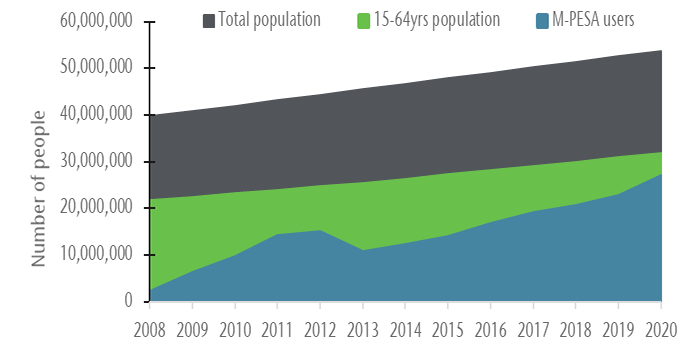
Somewhat surprisingly, one of the best examples of this trend can be found in Kenya. It is rare that the markets in which we invest harbor a best in class operator – particularly in disruptive sectors, and in a global context – but mobile network operator, Safaricom, is one exception. Through their mobile money network, M-PESA, they have almost single handedly brought more than 30 million Kenyans into the digital payments age, in what has been one of the world’s greatest advances in financial inclusion1.
M-PESA, as the name suggests (M = ‘mobile’; PESA = ‘money’ in Swahili) was one of the earliest mobile money products in an industry that has since ballooned to include more than 1 billion people globally, of which more than 50% are located in Sub-Saharan Africa2. The idea is simple – a digital wallet that is linked to a mobile phone. There are no banks involved. No account numbers. No etching your name onto the back of a card. An individual’s e-wallet links directly to their SIM, meaning a phone number is all that is needed to send and receive money.
If you lived in Kenya in 2005 there was a 70% chance you didn’t have a bank account3. Today, as an adult in Kenya, there is almost 100% chance that you have an M-PESA account and have transferred money digitally to somebody else in Kenya. In 2019, the total value of transactions that ran through M-PESA was almost 15% higher than Kenya’s entire $96 billion GDP. That is a whopping 8 billion unique transactions, or more than 150 transactions per person. For context, in the same year Germany recorded less than 60 cashless transactions per person4. Money enters and exists the M-PESA ecosystem through a network of ‘agents’, which mainly comprises authorized dealers, but also includes retailers such as petrol stations, supermarkets and registered SMEs. There are over 200,000 of these agents – that is more than every bank branch, ATM, currency exchange and microfinance institution in Kenya combined5.
Source: World Bank; Vergent Asset Management LLP
Note that Safaricom changed the definition of M-PESA users in 2013 from ‘Total Number of Users’ to ‘Users that have used M-PESA at least once in the last 30 days’. Under the former definition, there are over 30m M-PESA users today.
The early signs of M-PESA’s infiltration – and to some extent, redefinition – of the banking system are clear. Consider M-Shwari, an application built on M-PESA through which consumers can apply for up to KES 50,000 (roughly USD $450) in short-term loans. When M-Shwari launched in November 2012, approximately 700,000 Kenyans had an outstanding personal loan. Just three months later, M-Shwari had signed up a staggering 2.9 million customers, which rose to 5 million by the end of the year and almost 10 million a year later6. For the bank that underwrites the loans – NCBA Bank – just under 50% of all loans disbursed in 2019 were through M-Shwari 7.
KCB Bank has enjoyed similar success. Just one year after launching KCB M-PESA, an almost identical short-term loan product, their customer base had more than doubled to 9 million people. That is one of the largest banks in East Africa, having taken 115 years to amass its first 4 million customers, taking just 12 months to add 5 million more8. It is quite remarkable to witness even the most established, multi-centurial banks such as KCB sliding down the value chain of their own industry.
As fundamental investors, we assess the strength of our companies through an array of qualitative and quantitative methods. Sometimes, however, it can be just as useful analysis to employ a far simpler framework. History has consistently proven (across both capitalist and socialist systems) the old adage that money is power. Less discussed, albeit a slight subtlety, is the opposite. Power is money – the idea that those with influence and control can lever their advantage in order to benefit financially. For some companies, we can gauge this power quantitatively by analyzing the take rate – the percentage commission charged per transaction. There are a number of factors that go into the take rate, but generally those with a stronger grip on their respective industries are able to demand a higher rate.
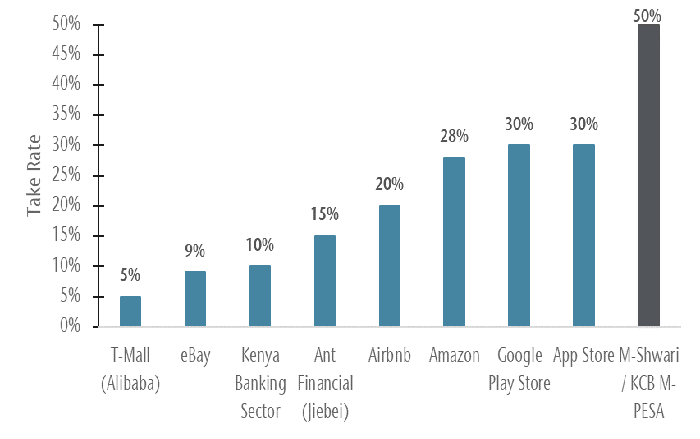
In this context, it is worth remembering that fundamentally, M-PESA is nothing more than a digital distributor. Consumers pay a small fee in return for the ability to distribute money to any other M-PESA user in Kenya. For financial products such as M-Shwari and KCB M-PESA, the underwriting banks pay for the privilege of distributing their products through M-PESA. The chart below compares the take rate that M-PESA earns on these financial products with some of the largest physical and digital distributors in the world. It is a surprising data point, but one which undeniably evidences the power that M-PESA holds over the Kenyan banking sector.
Source: Vergent Asset Management LLP
T-Mall includes fees for paying through AliPay. e-Bay is the blended rate for the US and international businesses. Kenya Banking Sector is calculated as the average yield for the last three years, adjusted for provisions for bad loans. Jiebei is an unsecured, consumer loan product. The rate given is on an annualized basis. Amazon is inclusive of 3P commissions, logistics fees and advertising fees.
What M-PESA has done for the financial development of Kenya has been nothing short of extraordinary. And what is most exciting is that we see this as just the start, the prelude to what is shaping up to be the most profound chapter of M-PESA’s story so far. As Ol’ Blue Eyes, Frank Sinatra, would say – “the best is yet to come”. M-PESA 2.0 will grow into its role as the core financial ecosystem in Kenya, and the global poster child for how technology and connectivity can expose the frailties of the modern banking system. We expect it will become much more than a convenient way to transfer money. Consumers will be able to pay for almost any good or service, settle bills and seamlessly send money from abroad; the government will collect taxes and pay public sector employees; banks will use it as their preferred channel to distribute credit, insurance and other financial products. Put another way, we believe M-PESA is on track to become the core provider of financial utility in Kenya.
We hasten to add that the next leg of M-PESA’s journey will not be all blue skies and rainbows. There will of course be storms ahead, as regulators and policy makers play catch up, and as the retail banking sector fights to stay relevant. Nevertheless, we are confident that M-PESA has what it takes to navigate these challenges successfully. Safaricom is, and has always been, our biggest bet. A company that from a small corner of Africa is spearheading one of the most powerful digital revolutions on the planet.
Vergent Asset Management April 8, 2021
1. Source: Safaricom, company accounts 2. Understanding why mobile money has been so disproportionately successful in Africa could be the subject of another paper entirely, and we will refrain from doing it an injustice by skimming over the details here. For the curious reader, we highlight what we think have been the three key ingredients: i) markets that have low banking penetration; ii) economies that are heavily reliant on cash; iii) populations that exhibit high rural density. 3. Source: GSMA Report, 2015 4. Source: Deutsche Bundesbank data 5. Source: CBK data 6. Source: FSD Kenya 7. Source: NCBA company accounts; Safaricom company accounts 8. Source: KCB company accounts
DISCLAIMER
These materials (“Presentation”) are presented by Vergent Asset Management LLP <(“Vergent”)>. This Presentation is furnished on a confidential basis for informational and illustration purposes only. This Presentation is intended for the use of the recipient only and may not be reproduced or distributed to any other person, in whole or in part, without the prior written consent of Vergent.
Vergent Asset Management LLP is registered in England and Wales with its registered office address at 8th Floor, 1 Knightsbridge Green, London SW1X 7QA, United Kingdom (Companies House number OC418829) and is authorized and regulated by the Financial Conduct Authority (FRN: 791909).
This financial promotion is issued by Vergent Asset Management which is authorized and regulated by the Financial Conduct Authority (‘FCA’). Past performance is not indicative of future results. The value of your investment may go down as well as up and you may not receive upon redemption the full amount of your original investment.
THE PERFORMANCE PRESENTED HEREIN IS NOT INDICATIVE OF FUTURE RESULTS. The performance results contained herein are for informational purposes only, and are not meant to imply that Vergent’s trading programs will produce results similar to the performance results contained herein. There can be no assurance that Vergent or any account or product advised thereby will or is likely to achieve any results shown. There can be no assurance that such trading programs will make any profit at all or will be able to avoid incurring substantial losses. No representation is made that Vergent’s investment processes or investment objectives will or are likely to be successful or achieved.
Certain information contained in this Presentation is based on information obtained from third-party sources that Vergent considers to be reliable. However, Vergent makes no representation as to, and accepts no responsibility for, the accuracy, fairness or completeness of the information contained herein. The information is as of the date indicated and reflects present intention only. This information is subject to change at any time, and Vergent is under no obligation to provide you with any updates or amendments to this Presentation. The information contained in this Presentation is not complete and does not contain certain material information about the trading programs described herein, including important risk disclosures. Accordingly, this Presentation must be read in conjunction with, and is qualified in its entirety by, such other disclosure documentation as may be provided by Vergent from time to time in connection with a prospective investment. An investment in the strategy described herein may not be suitable for all clients, and before allocating any assets to the strategy or strategies, you should thoroughly review the terms and disclosures the strategy and consult with your professional advisor(s) to determine whether an investment in the strategy is suitable for you in light of your investment objectives and financial situation.
This Presentation may contain opinions pertaining to securities, financial products, transactions and investment strategies, and such opinions may differ from one to another. Any opinions, assumptions, assessments, statements, market commentary or the like (collectively, “Statements”) regarding past, current and/or future market conditions, themes, trends or events or which are forward-looking, including regarding portfolio characteristics and limits, constitute only subjective views, beliefs, outlooks, estimations or intentions of Vergent, should not be relied on, are subject to change due to a variety of factors, including fluctuating market conditions and economic factors, and involve inherent risks and uncertainties, both general and specific, many of which cannot be predicted or quantified and are beyond Vergent’s control. Future evidence and actual results could differ materially from those set forth in, contemplated by, or underlying these Statements, which are subject to change without notice. In light of these risks and uncertainties, there can be no assurance and no representation is given that these Statements are now, or will prove to be, accurate or complete in any way. Vergent undertakes no responsibility or obligation to revise or update such Statements. Statements expressed herein may not necessarily be shared by all personnel of Vergent. You acknowledge that you are capable of independently analyzing such Statements and the other information presented herein using your own expertise, due diligence and decision making, and you are solely responsible for any investment decisions made through your use of such Statements or other information and for any and all trading results achieved thereby, whether for your own account or on behalf of your clients.
This Presentation is not an offer to buy or sell, nor a solicitation of an offer to buy or sell any security or other financial instrument, or to invest assets in any account, advised by Vergent. An investment in any account advised by Vergent may be made only by qualified clients after receipt of formal investment management documentation and disclosures from Vergent, and only in those jurisdictions where permitted by law. Vergent’s investment strategies have management fees and operating expenses that would reduce returns to a client. Operating expenses include items such as custodial fees for segregated accounts and for pooled vehicles would also include charges for valuation, audit, tax and legal expenses. Such additional operating expenses would reduce the actual returns experienced by investors in segregated accounts and pooled vehicles. Any client must be able to bear the risks involved in any potential investment and must meet the suitability requirements relating to its participation in the Trading Programs.
Financial indices are shown for illustrative purposes only, may not be available for direct investment, are unmanaged, assume reinvestment of income, do not reflect the impact of any management or incentive fees and have limitations when used for comparison or other purposes because they may have different volatility or other material characteristics (such as number and types of instruments) than the investment strategies described herein. Vergent’s investment strategies are not restricted to the instruments comprising any one index.
Vergent is not and does not purport to be an advisor as to legal, taxation, accounting, financial or regulatory matters in any jurisdiction. The recipient should independently evaluate and judge the matters referred to in this Presentation. Net performance figures are stated after estimated management fees and transaction costs but before operating expenses. Operating expenses include items such as custodial fees for segregated accounts and for pooled vehicles would also include charges for valuation, audit, tax and legal expenses.
Third-party data providers
This report may contain information obtained from third parties including: Merrill Lynch, Pierce, Fenner & Smith Incorporated (BofAML), S&P Global Ratings, and MSCI.
Source: Merrill Lynch, Pierce, Fenner & Smith Incorporated (BofAML), used with permission. BofAML permits use of the BofAML indices related data on an « As Is » basis, makes no warranties regarding same, does not guarantee the suitability, quality, accuracy, timeliness, and/or completeness of the BofAML indices or any data included in, related to, or derived therefrom, assumes no liability in connection with the use of the foregoing, and does not sponsor, endorse, or recommend Vergent, or any of its products.
This may contain information obtained from third parties, including ratings from credit ratings agencies such as S&P Global Ratings. Reproduction and distribution of third party content in any form is prohibited except with the prior written permission of the related third party. Third party content providers do not guarantee the accuracy, completeness, timeliness or availability of any information, including ratings, and are not responsible for any errors or omissions (negligent orotherwise), regardless of the cause, or for the results obtained from the use of such content. THIRD PARTY CONTENT PROVIDERS GIVE NO EXPRESS OR IMPLIED WARRANTIES, INCLUDING, BUT NOT LIMITED TO, ANY WARRANTIES OF MERCHANTABILITY OR FITNESS FOR A PARTICULAR PURPOSE OR USE. THIRD PARTY CONTENT PROVIDERS SHALL NOT BE LIABLE FOR ANY DIRECT, INDIRECT, INCIDENTAL, EXEMPLARY, COMPENSATORY, PUNITIVE, SPECIAL OR CONSEQUENTIAL DAMAGES, COSTS, EXPENSES, LEGAL FEES, OR LOSSES (INCLUDING LOST INCOME OR PROFITS AND OPPORTUNITY COSTS OR LOSSES CAUSED BY NEGLIGENCE) IN CONNECTION WITH ANY USE OF THEIR CONTENT, INCLUDING RATINGS. Credit ratings are statements of opinions and are not statements of fact or recommendations to purchase, hold or sell securities. They do not address the suitability of securities or the suitability of securities for investment purposes, and should not be relied on as investment advice.
Source: MSCI. The MSCI information may only be used for your internal use, may not be reproduced or re-disseminated in any form and may not be used as a basis for or a component of any financial instruments or products or indices. MSCI makes no express or implied warranties or implied warranties or representations and shall have no liability whatsoever with respect to any MSCI data contained herein. This report is not approved, reviewed or produced by MSCI.
The strategy continues to be focused on identifying transformational growth companies in the Frontier and smaller Emerging markets. Africa and Asia today represent ~90% of invested capital and the strategy owns or has previously owned companies in CEE, CIS, and the Middle East. Thematically, we’re primarily invested in the three following areas:
Financial inclusion and the development of the digital payments eco-system (i.e.: disruption of cash) via companies operating across a variety of sectors including in banks/microfinance, communications/media/mobile money, and software
Rising health and wellness awareness which we express through consumer health companies selling niche FMCG and healthcare providers offering medical services to their customers
The formalization of offline retail with a focus on the grocery and DIY category where our retailers have a large Omni-channel advantage over pure online competition as well as a scale and cost advantage over unorganized/traditional competition
Underpinning our confidence in these themes are the large addressable markets wherein our companies operate, the fragmented and weaker level of competition, and the quality of the management teams which run them (many of whom are also owners).
We highlight two such companies in this quarter’s letter.
MTN Ghana (MTNG) – the $1.8bn market cap company embodies the frontier equity story as well as any in our portfolio. MTNG is the leading telecom service provider in the West African nation of Ghana with over 24 million subscribers and a leading market share in voice (55%) and data (72%). However, what gets us excited about MTNG is “Momo”, the company’s mobile money business which is at the forefront of the digitalization of cash in the country. Similar to Mpesa in Kenya, Momo is already the winner in its market with a 98% share of all mobile money transactions and an active base of 10.2 million wallets in the country. Momo’s contribution to MTNG’s revenue has increased by ~350bps in the last two years to reach 21% in 2020. We see Momo’s growth coming from several areas including structural adoption of mobile money for peer-to-peer transfers as well as growth in value added use cases in the areas of remittances, loans and savings, and merchant services. Despite it being a $1bn+ revenue business with returns on invested capital of ~25% and an exciting fast growing fintech business, MTNG is not covered by the sell side community. This is perhaps because Ghana as a market is unclassified by MSCI and so is neither a frontier nor an emerging market by the index provider’s standards. On the buy side, many institutional investors will access MTNG via its parent company MTN Group out of South Africa, a sub-optimal way considering the multi-country operation of the parent co. This has presented us with a unique opportunity to directly own MTNG at ~5x price to earnings over the last two years. Even after a strong re-rating year-to-date, the stock is still trading below 7.5x trail 12m earnings with a dividend yield of +8%.
Unicharm Indonesia (UCID) – the $480m market cap company is the leading baby diaper and female sanitary brand in the country of ~250m people. Indonesia has one of the lowest penetration rates of baby diaper products in the world yet is expected to generate the second biggest growth in value terms in Asia Pacific after China. This is driven by demographics (over 4 million babies are born every year in Indonesia) and higher penetration rates driven by investments in innovation and distribution (UCID sells single diapers in certain retail channels to make the product affordable). UCID has nearly 47% of the baby diapers market in Indonesia which makes it almost 2x larger than its nearest competitor which puts it in a strong position to capture the growth in the market over the long term. UCID is also the market leader in sanitary female products and adult diapers which are high margin categories given competitive intensity is lower and premiumization opportunities larger (relative to baby diapers). While the top down opportunity is attractive, UCID has low operating margins compared to global peers. We attribute this mainly to the baby diaper category where consumers prioritize price over quality; consumers in Indonesia are predominantly price driven in their choices across most FMCG products and a high percentage of the target market (parents) still view baby diapers as a discretionary product. We do not foresee a change in consumer preferences in the near term in light of the impact that Covid-19 has inflicted on purchasing power. That being said, we are still expecting margins to trend upwards as the recent entry of Kimberly Clark via the acquisition of UCID’s main competitor Sofitex is likely to bring more pricing discipline to the market by way of lower promotional activity (note: the acquisition of Sofitex was done at 3x EV/Sales compared to 0.5x EV/Sales for UCID which on its own is an indication of the undervaluation present in the shares of UCID today). As the Indonesian economy reopens, we expect UCID’s general trade channel to also open up and offer another tailwind to margins over the next two years as the company earns a higher net price compared to the modern channel which is dominated by established mini market chains. We also see the development of the e-commerce channel as potentially positive for UCID’s margins as that targets a more affluent consumer base that buys more (volume) and better (quality). We’ve increased exposure to UCID over the last month having been encouraged by latest commentary from management on the competitive dynamics in the market following the entry of Kimberly Clark which we believe is a key catalyst for the thesis.
In conclusion:
The opportunity set for the strategy continues to be attractive despite the visible underperformance relative to emerging markets. A recent FT column by Simon Edelsten brought to light a phenomenon we’ve been talking about for some time: almost 2/3rd of the MSCI EM is in three countries (China, South Korea, and Taiwan) that have “emerged” if one judges by income levels, demographics, and market efficiency to paraphrase the article. In that light, we continue to see the frontier and emerging markets in which we specialize as a truer reflection of the classic emerging market story. Translating that opportunity to returns is still about selecting the right stocks for the long term and we believe our portfolio reflects that in its current composition.
Vergent Asset Management LLP
DISCLOSURES
1. Unless otherwise stated, all data is at March 31, 2021 and stated in US dollars (US$). Source: Connor, Clark & Lunn Financial Group, Thomson Reuters Datastream.
2. Performance history for the Vergent Emerging Opportunities Strategy is that of the Vergent Emerging Opportunities Composite. The Composite has an inception and creation date of August 2018.
3. Net performance figures are stated after management fees, estimated performance fees, trading expenses and before operating expenses. Operating expenses include items such as custodial fees for pooled vehicles and would also include charges for valuation, audit, tax and legal expenses. Such additional operating expenses would reduce the actual returns experienced by investors. Past performance of the strategy is no guarantee of future performance; Future returns are not guaranteed and a loss of capital may occur. For illustrative purposes, performance fee of 20% on added value over the hurdle rate of 6% plus the management fee of 1.25% have been assumed. Actual management fees charged to a particular account may vary.
4. There is no benchmark for the Vergent Emerging Opportunities Strategy because it has an absolute return objective
5. Standard Deviation measures the dispersion of monthly returns since the inception of the strategy.
Benchmarks and financial indices are shown for illustrative purposes only, are not available for direct investment, are unmanaged, assume reinvestment of income, do not reflect the impact of any management or incentive fees and have limitations when used for comparison or other purposes because they may have different volatility or other material characteristics (such as number and types of instruments) than the Strategy. The Strategy’s investments are not restricted to the instruments comprising any one index and do not in all cases correspond to the investments reflected in such indices.
These materials (“Presentation”) are furnished by Vergent Asset Management (“Vergent”) on a confidential basis for informational and illustration purposes only. This Presentation is intended for the use of the recipient only and may not be reproduced or distributed to any other person, in whole or in part, without the prior written consent of Vergent. Certain information contained in this Presentation is based on information obtained from third-party sources that Vergent considers to be reliable. However, Vergent makes no representation as to, and accepts no responsibility for, the accuracy, fairness or completeness of the information contained herein. The information is as of the date indicated and reflects present intention only. This information may be subject to change at any time, and Vergent is under no obligation to provide you with any updates or amendments to this Presentation. This Presentation is not an offer to buy or sell, nor a solicitation of an offer to buy or sell any security or other financial instrument advised by Vergent. This Presentation does not contain certain material information about the strategy, including important risk disclosures. An investment in the strategy is not suitable for all investors, and before making an investment in the strategy, you should consult with your professional advisor(s) to determine whether an investment in the strategy is suitable for you in light of your investment objectives and financial situation. Vergent does not purport to be an advisor as to legal, taxation, accounting, financial or regulatory matters in any jurisdiction, and the recipient should independently evaluate and judge the matters referred to in this Presentation. Vergent Asset Management LLP is registered in England and Wales with its registered office address at 8th Floor, 1 Knightsbridge Green, London SW1X 7QA, United Kingdom (Companies House number OC418829) and is authorized and is an Exempt Reporting Adviser in the USA. It is regulated by the Financial Conduct Authority (FRN: 791909).
Third-party data providers
This report may contain information obtained from third parties including: Merrill Lynch, Pierce, Fenner & Smith Incorporated (BofAML), S&P Global Ratings, and MSCI. Source: Merrill Lynch, Pierce, Fenner & Smith Incorporated (BofAML), used with permission. BofAML permits use of the BofAML indices related data on an « As Is » basis, makes no warranties regarding same, does not guarantee the suitability, quality, accuracy, timeliness, and/or completeness of the BofAML indices or any data included in, related to, or derived therefrom, assumes no liability in connection with the use of the foregoing, and does not sponsor, endorse, or recommend CC&L Canada, or any of its products. This may contain information obtained from third parties, including ratings from credit ratings agencies such as S&P Global Ratings. Reproduction and distribution of third party content in any form is prohibited except with the prior written permission of the related third party. Third party content providers do not guarantee the accuracy, completeness, timeliness or availability of any information, including ratings, and are not responsible for any errors or omissions (negligent or otherwise), regardless of the cause, or for the results obtained from the use of such content. THIRD PARTY CONTENT PROVIDERS GIVE NO EXPRESS OR IMPLIED WARRANTIES, INCLUDING, BUT NOT LIMITED TO, ANY WARRANTIES OF MERCHANTABILITY OR FITNESS FOR A PARTICULAR PURPOSE OR USE. THIRD PARTY CONTENT PROVIDERS SHALL NOT BE LIABLE FOR ANY DIRECT, INDIRECT, INCIDENTAL, EXEMPLARY, COMPENSATORY, PUNITIVE, SPECIAL OR CONSEQUENTIAL DAMAGES, COSTS, EXPENSES, LEGAL FEES, OR LOSSES (INCLUDING LOST INCOME OR PROFITS AND OPPORTUNITY COSTS OR LOSSES CAUSED BY NEGLIGENCE) IN CONNECTION WITH ANY USE OF THEIR CONTENT, INCLUDING RATINGS. Credit ratings are statements of opinions and are not statements of fact or recommendations to purchase, hold or sell securities. They do not address the suitability of securities or the suitability of securities for investment purposes, and should not be relied on as investment advice.
Source: MSCI. The MSCI information may only be used for your internal use, may not be reproduced or re-disseminated in any form and may not be used as a basis for or a component of any financial instruments or products or indices. MSCI makes no express or implied warranties or implied warranties or representations and shall have no liability whatsoever with respect to any MSCI data obtained herein. This report is not approved, reviewed or produced by MSCI.