In-depth macro analysis has always been a cornerstone of this process, based on an understanding that emerging markets are highly sensitive to macro shocks which can overwhelm ostensibly solid company fundamentals. The outbreak of conflict following US and Israeli strikes to take out the Iranian regime is one such event, and has sparked violent moves in markets. Our macroeconomic analysis and risk controls are crucial in helping to navigate a volatile environment.
The approach to macroeconomic analysis here is disciplined and incremental, and does not involve the type of Hail Mary calls (i.e., speculating on President Trump’s war aims) that get market pundits invitations onto Bloomberg and CNBC. Our approach to forming a top-down view of our markets is to mark the direction of travel, whether it be our monetary indicators or more qualitative factors such as politics and institutional quality. We marshal all of these data points into one number which rates the level of conviction for a country with 1 being the highest level of conviction corresponding with a maximum overweight (key caveat: provided we can find the right stocks that fit our process), and 5 being lowest (meaning no exposure at all). As the data changes, we will tweak that level of conviction, which should be tightly aligned with adjustments made in the portfolio.
This work is designed to help us understand how the investment environment is changing through cycles, structural change and theme-driven liquidity. Through this context, we can get a sense of what types of businesses are likely to be rewarded in a given environment and adjust the portfolio accordingly.
Test and re-test
We are big subscribers to the insights of psychologist and writer, Phillip Tetlock, who is an expert on forecasting. His studies found that the best long-term forecasters are those who are able to make probabilistic estimates, calibrate, learn and update beliefs frequently. They make many small corrections to their analysis as fresh data arrives, which leads to better long-run accuracy than rigid “set and forget” predictions. This is the forecasting approach we adopt in both our macro and company analysis, illustrated in our process diagram below.
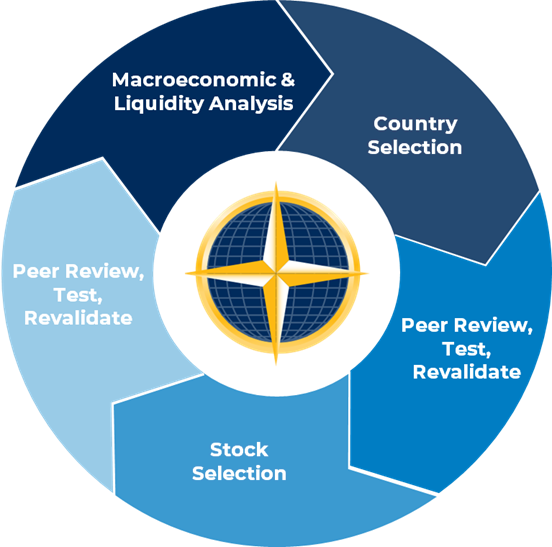
Through periods of high uncertainty and violent market moves like what we have currently, we lean heavily into this OODA (Observe, Orient, Decide, Act) Loop. This involves a constant testing and re-testing of our macro views and investment hypotheses, and tweaking of the portfolio as conditions change.
Example: lifting oil exposure
Moving from being zero weight in oil companies at the start of 2026 to equal weight (and with more beta to oil than the index) by the end of February is one example of how iterative tweaks in our macro analysis left the portfolio in a better position to weather the events of early March.
Towards the end of last year, one of the most debated topics of discussion in the team was our heavy underweight to the energy sector and, in particular, oil. Our only energy holding at the end of 2025 was uranium miner CGN.
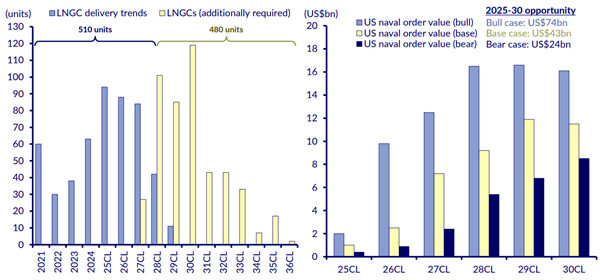
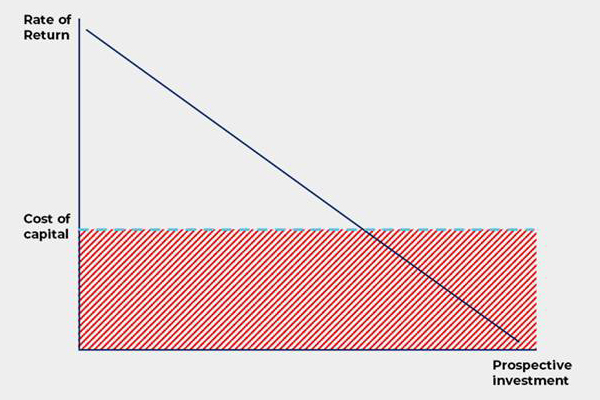
While we remain structurally cautious about oil’s long-term investment prospects, from a portfolio risk perspective we became concerned that having no oil exposure had turned into a crowded consensus trade – especially as weak prices began to squeeze US shale production. This alongside news of a US naval build up in the Persian Gulf, Arabian Sea and Eastern Mediterranean early in the year suggested the portfolio was exposed to risk of a geopolitical shock in the region. Through January and February, we gradually lifted our oil exposure from zero to an equal weight of over 3.5%.
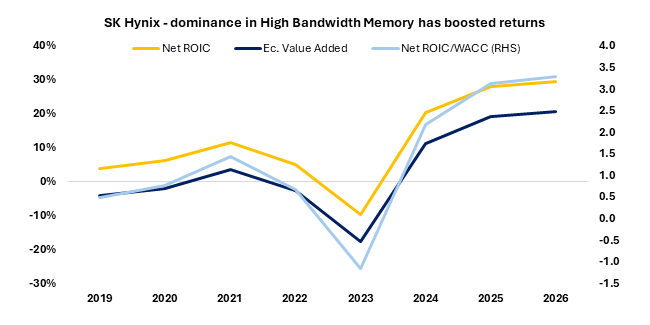
While our macro and risk analysis helped to identify a potential vulnerability, we could not know that conflict was about to break out in early March and drive such a dramatic hike in the price of oil. It was not a case of just adding oil beta to the portfolio. We added Argentinian shale oil producer Vista Energy and Petrochina based on their healthy returns on invested capital sustainable even through weak pricing environments, underpinned by growing production profiles, capital discipline and low lifting costs.
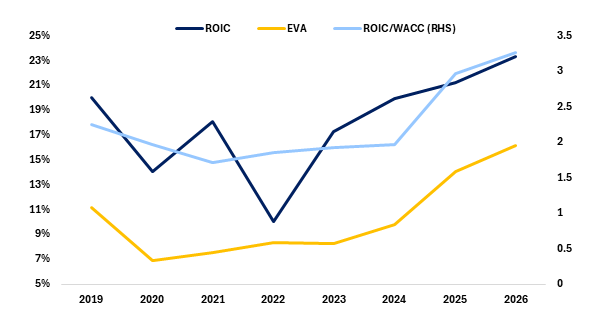
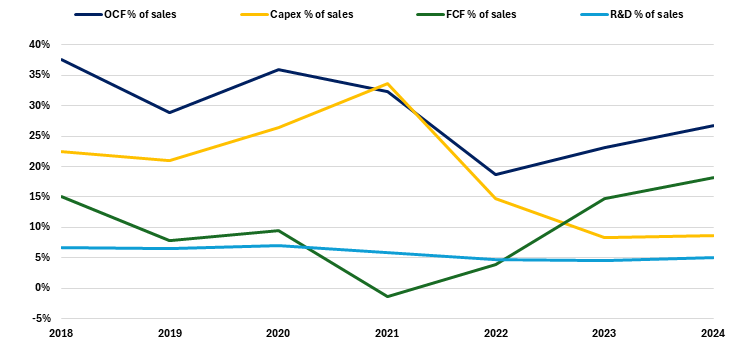
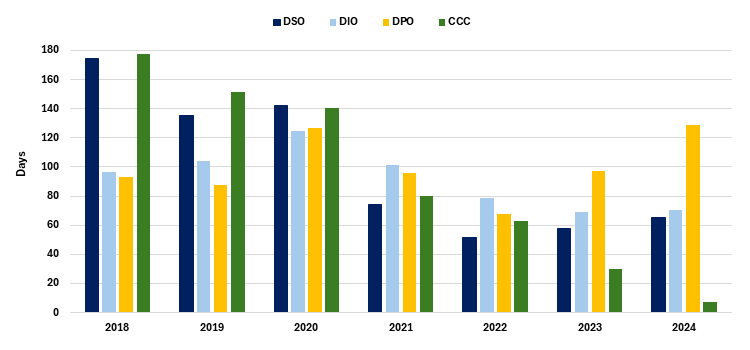
Vista Energy: Production growth and falling lifting costs driving earnings growth
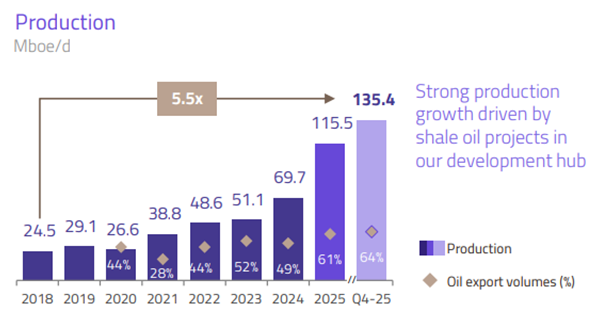
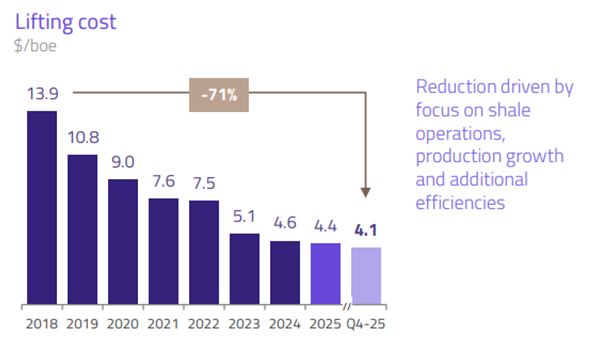
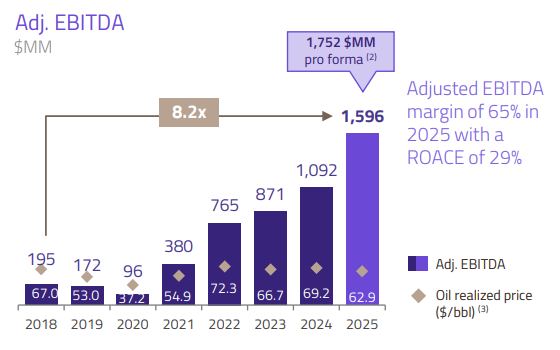
Source: Vista Energy Investor Relations 2026
The lift to oil exposure was timely, helping to preserve relative gains made this year despite sharp drawdowns in other winning positions that had been hit by broad risk-off sentiment.
Where to from here?
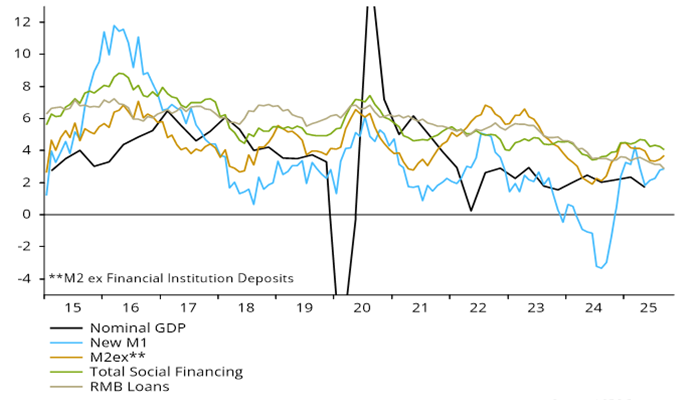
We rated the global monetary backdrop as modestly supportive coming into this shock, largely reflecting favourable trends in EM. However, we have been expecting the global stockbuilding cycle to turn down during 2026, giving us a bias to increase defensive positioning at the margin, especially on any signs of monetary weakness.
The energy price spike, unless swiftly reversed, will push up inflation and squeeze real money growth. It is leading to a revision of expectations for central bank policies, which may dampen nominal money growth. Nominal money trends are also at risk from recent tightening in US private credit conditions, which the current shock may exacerbate.
We are cautious and do not expect the negative effects of this shock will be swift to reverse, so our inclination is to add to defensive positioning on any rally, rather than to view current market weakness as a buying opportunity.