The forecasting approach employed here – relying on monetary and cycle analysis – turned positive on the global economy and risk markets in early Q2 2020 but is giving a more cautionary message at the start of 2021. The suggestion is that underlying economic momentum will slow temporarily while monetary support for markets has diminished, together raising the risk of a correction. The central view remains that global growth will be strong over the course of 2021 as a whole but with the adverse corollary of a significant pick-up in inflation into 2022.
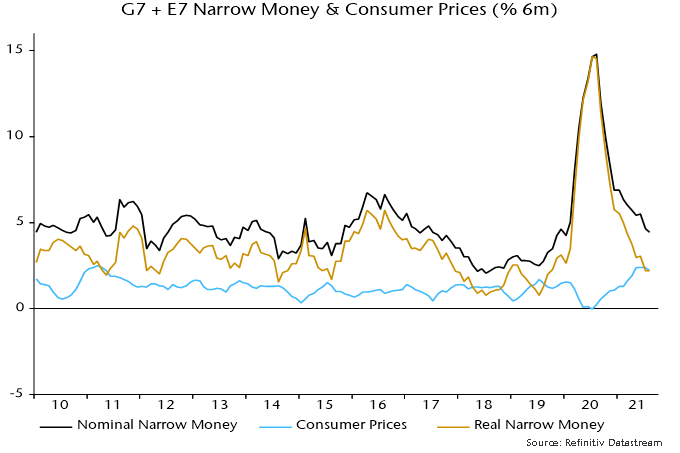
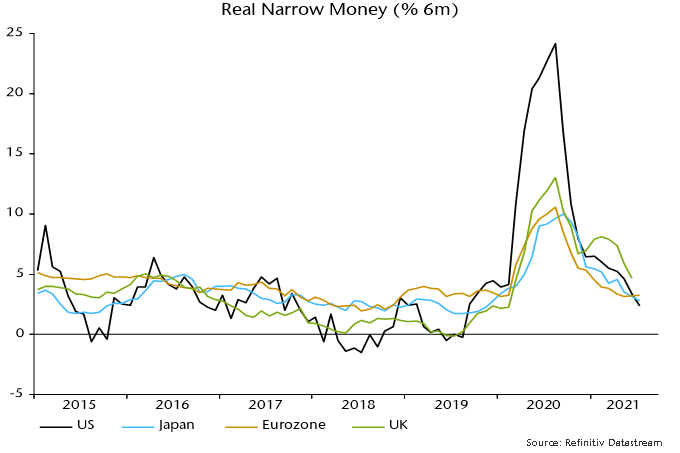
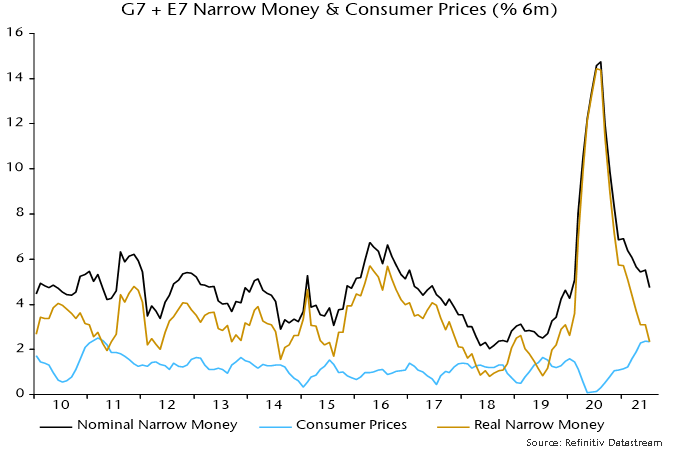
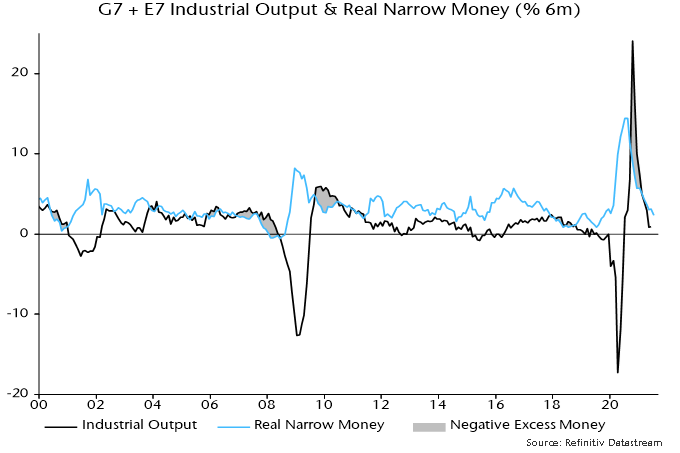
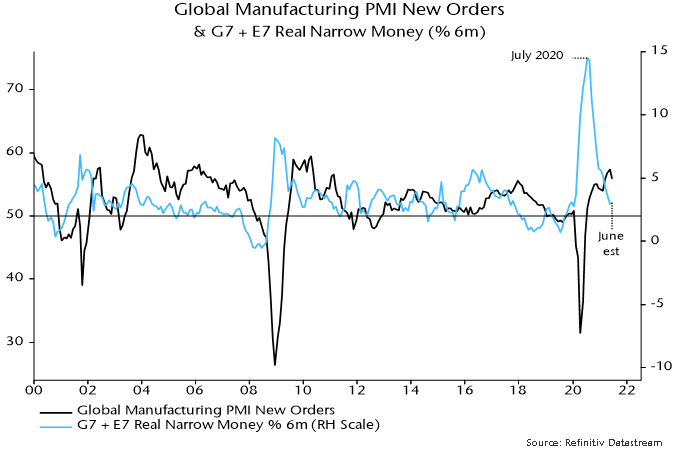
The monetary aspect of the forecasting approach can be summarised as “real money leads the economy while excess money drives markets”. Six-month growth of real (i.e. inflation-adjusted) narrow money in the G7 economies and seven large emerging economies (the “E7”) was weak at the start of 2020 but surged from March, correctly signalling a strong rebound in global economic activity during H2.
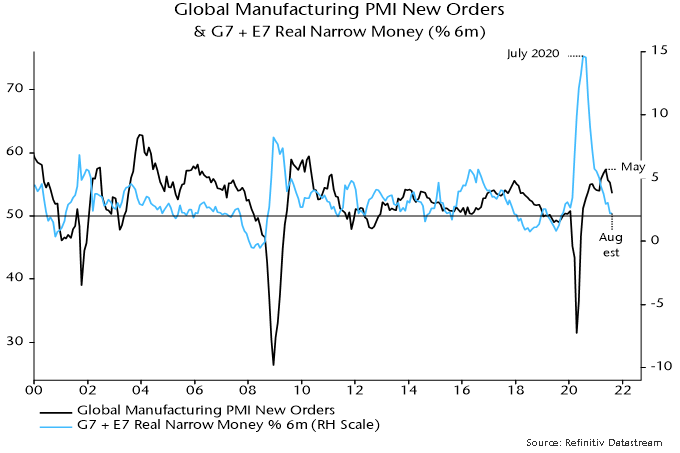
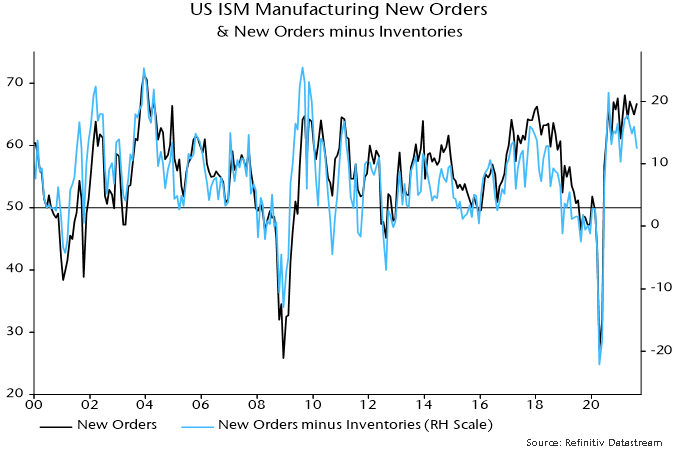
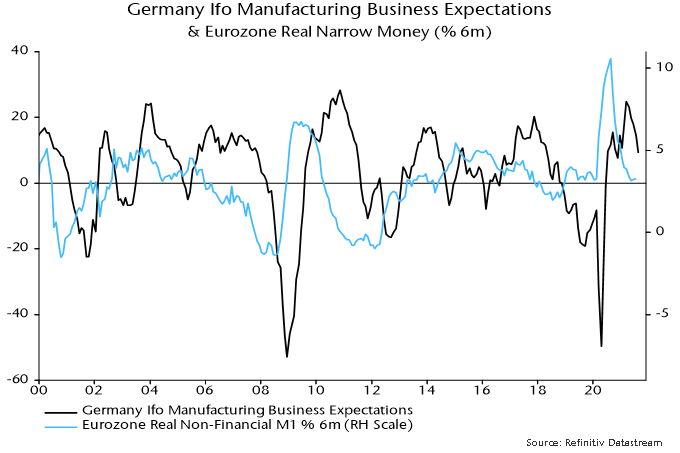
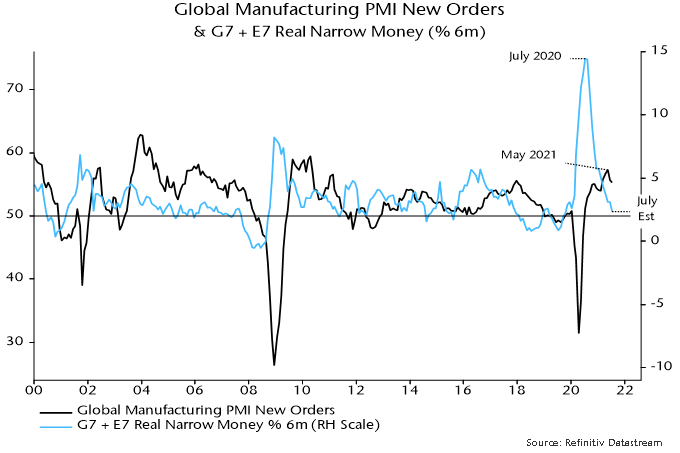
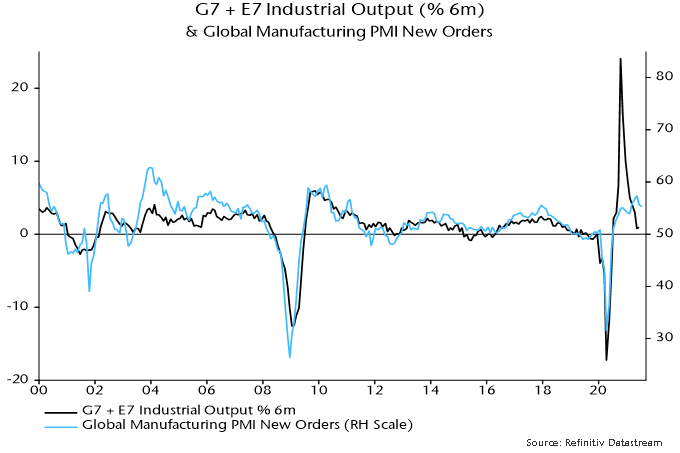
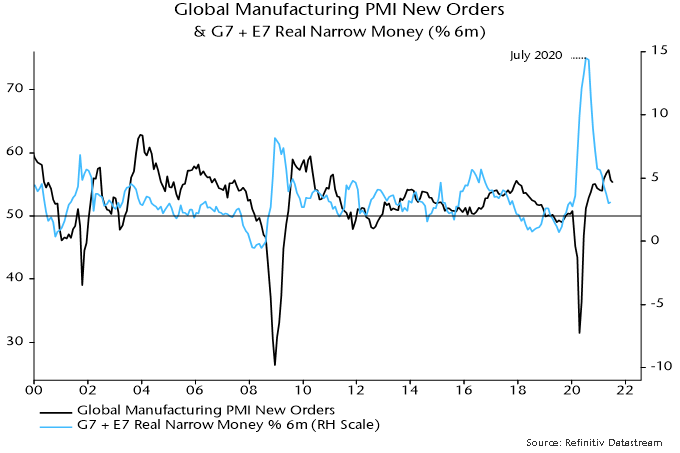
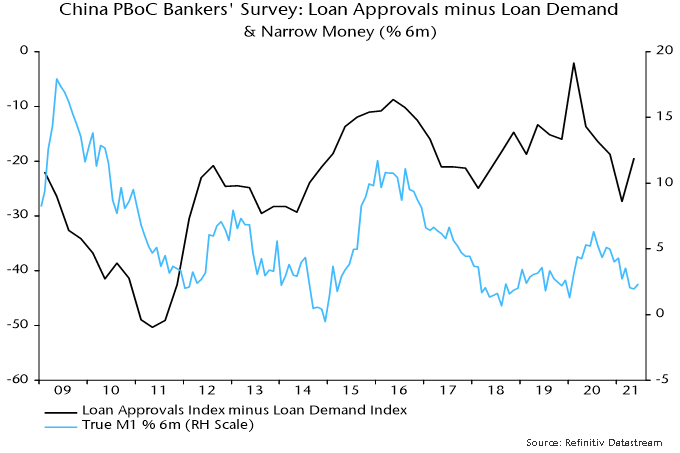
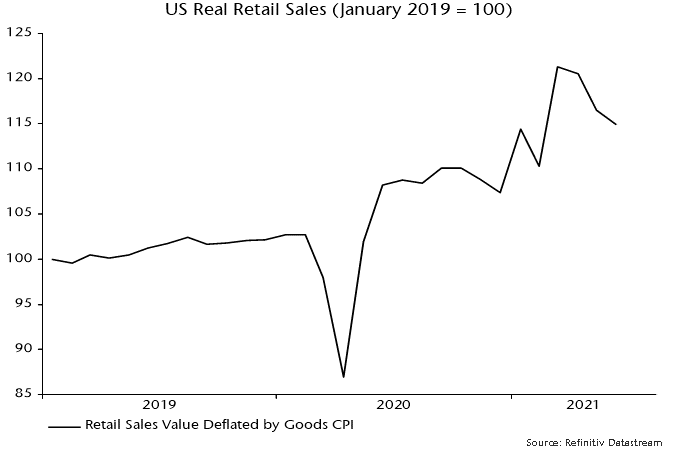
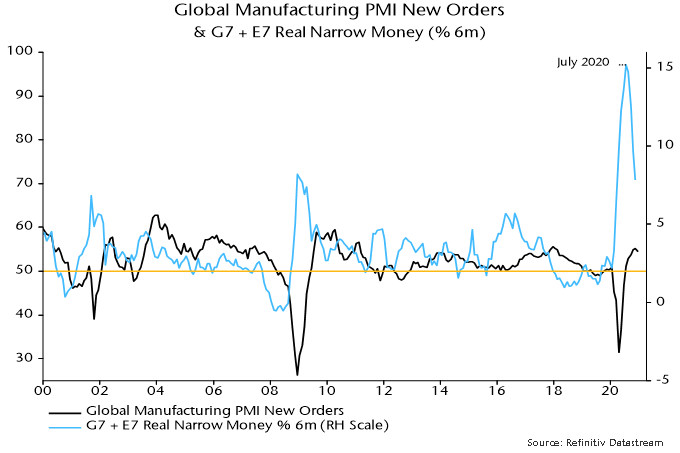
Real money growth, however, peaked in July, falling steadily through November, the latest data point – see chart 1. Turning points in real money growth have led turning points in the global manufacturing PMI new orders index – a key coincident indicator – by 6-7 months on average historically, suggesting that the PMI will move lower in early 2021. The level of money growth remains high, arguing against economic weakness (except due to “lockdowns”), but a directional shift in activity momentum could act as a near-term drag on cyclical assets.
Chart 1
“Excess” money refers to an environment in which actual real money growth exceeds the level required to support economic expansion, with the surplus likely to be invested in markets. Two gauges of excess money are monitored here: the gap between six-month growth rates of G7 plus E7 real narrow money and industrial output, and the deviation of year-on-year real money growth from a long-run moving average. Historically, global equities performed best on average when both measures were positive, worst when they were negative, and were lacklustre when they gave conflicting signals.
Following a joint positive signal (allowing for data release lags) at end-April 2020, the measures became conflicting again at end-December – year-on-year real money growth remains well above its long-run average but six-month growth fell below that of industrial output in October / November. Markets, therefore, may no longer enjoy a monetary “cushion” against unfavourable news, including the expected PMI roll-over.
The expectation here is that markets will become more volatile but risk assets are unlikely to be outright weak – any sizeable set-back would probably represent another buying opportunity. As noted, real money growth remains at an expansionary level and may stabilise soon, while the cycle analysis is giving a positive economic message for the next 12+ months, as explained below.
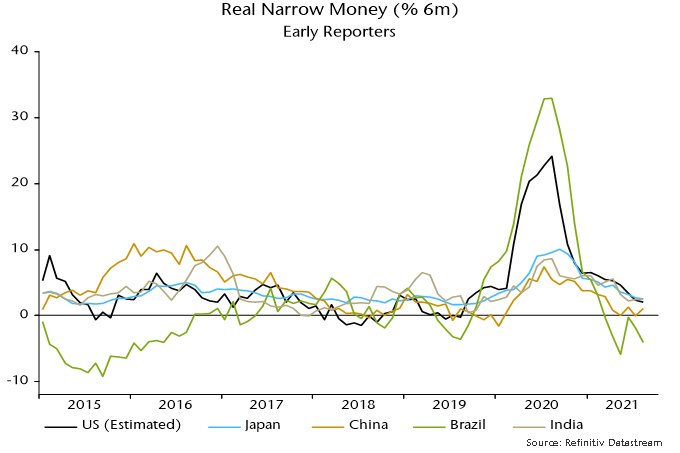
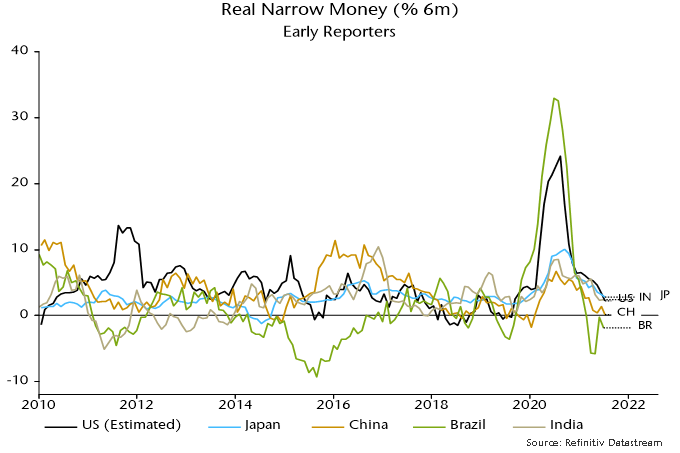
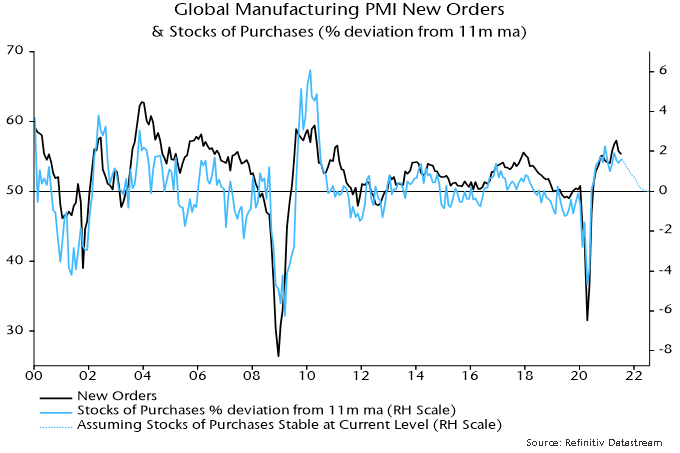
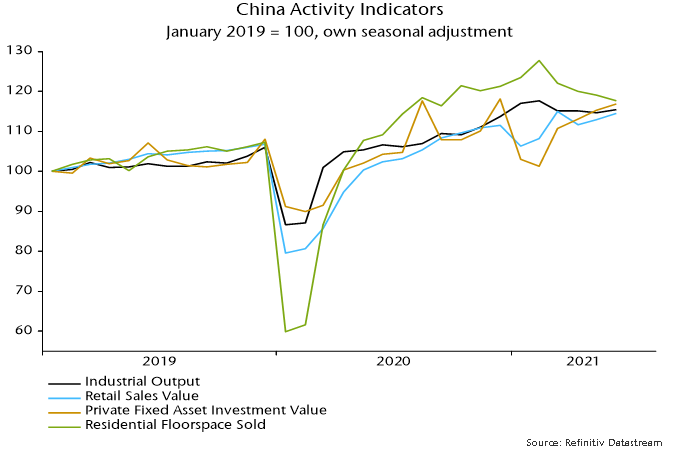
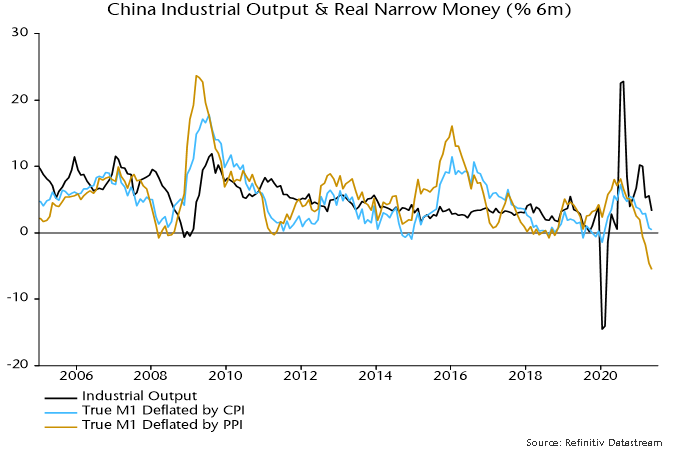
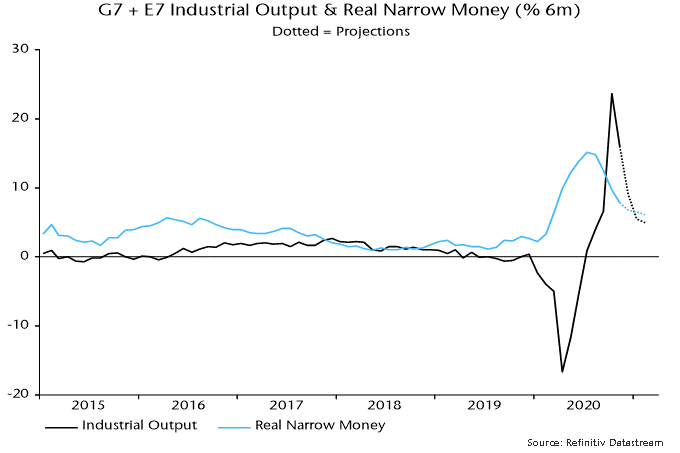
The cross-over of six-month real narrow money growth below industrial output growth, moreover, could prove short-lived, with output momentum about to fall back sharply as positive base effects fade. Assuming a stabilisation of monthly money growth, a positive differential could be restored as early as January – see chart 2 – in which case the assessment of the monetary backdrop for markets would shift back to favourable from Q2.
Chart 2
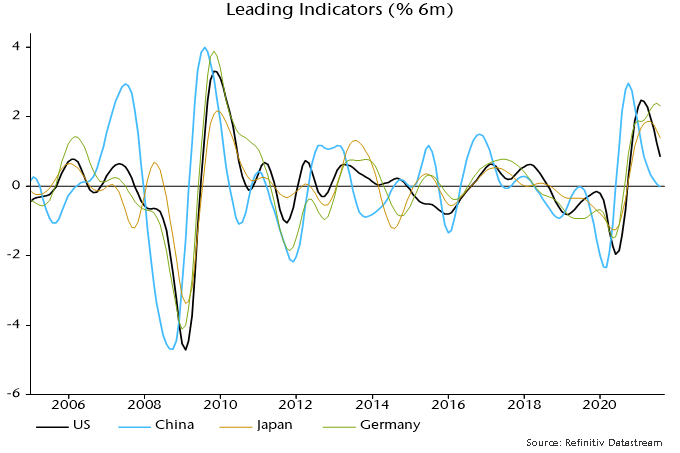
The cycle analysis provides a medium-term perspective and acts as a cross-check of the monetary analysis. There are three key economic activity cycles: the stockbuilding or inventory cycle, which averages 3.5 years (i.e. from low to low); a 9-year business investment cycle; and a longer-term housing cycle averaging 18 years. These cycles are essentially global in nature although housing cycles in individual countries can sometimes become desynchronised.
The cycle analysis was cautionary at the start of 2020, reflecting a judgement that the stockbuilding and business investment cycles were in downswings that might not complete until mid-year. The covid shock magnified but ended these downswings, with both cycles bottoming in Q2 and entering a recovery phase in H2. With the housing cycle still in an upswing from a 2009 low, all three cycles are now acting to lift global economic momentum.
The next scheduled cycle trough is a low in the stockbuilding cycle, due to be reached in late 2023 if the current cycle conforms to the average 3.5 year length. The downswing into this low would probably start about 18 months earlier, i.e. around Q2 2022. The cycle analysis, therefore, is giving an “all-clear” signal for the global economy for the next 15-18 months, implying that any data weakness – such as suggested by monetary trends for early 2021 – is likely to be minor and temporary.
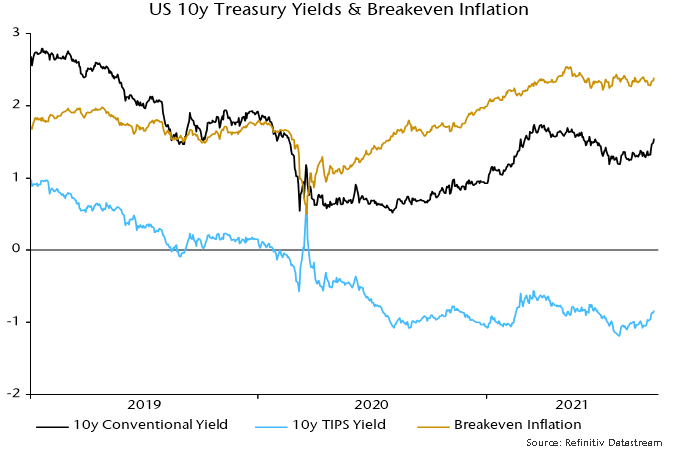
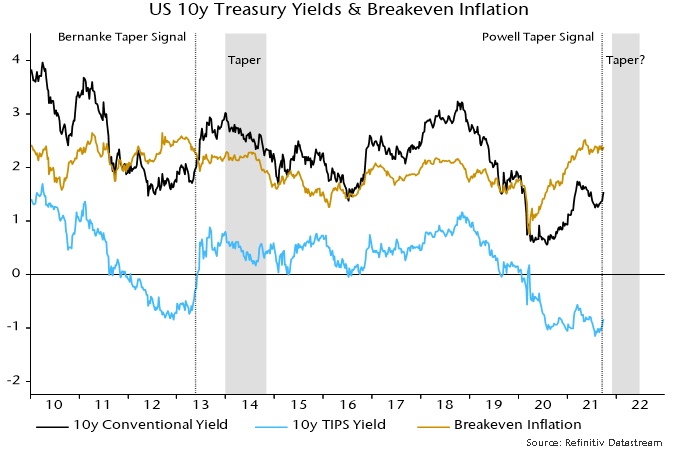
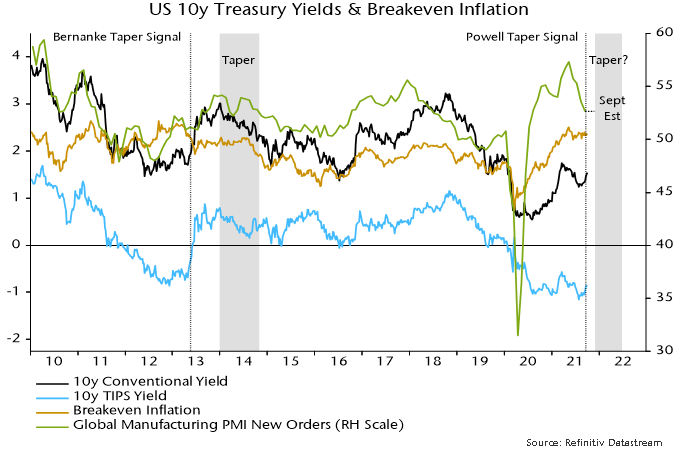
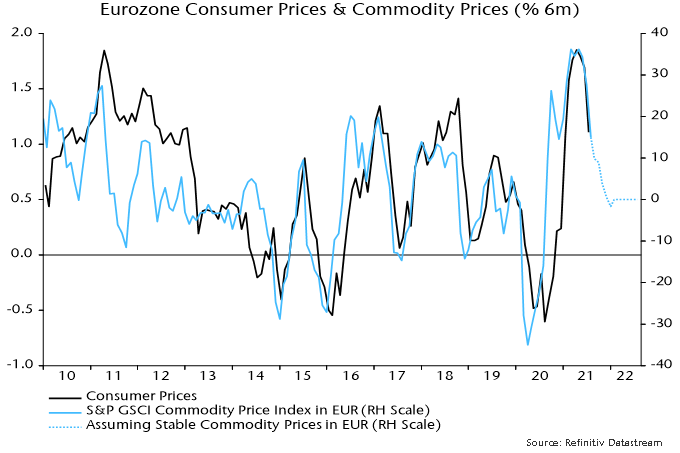
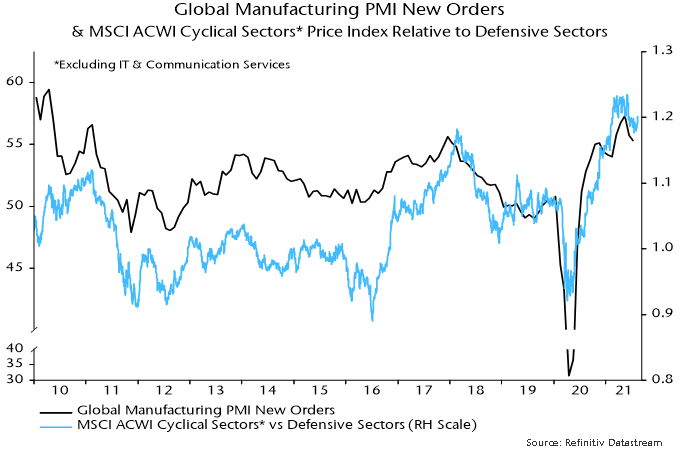
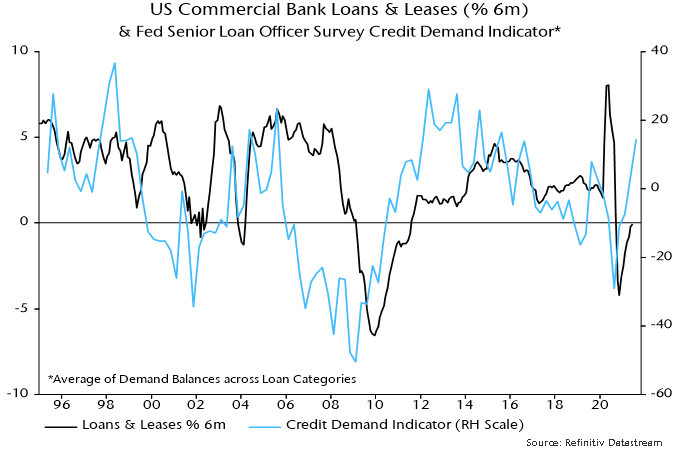
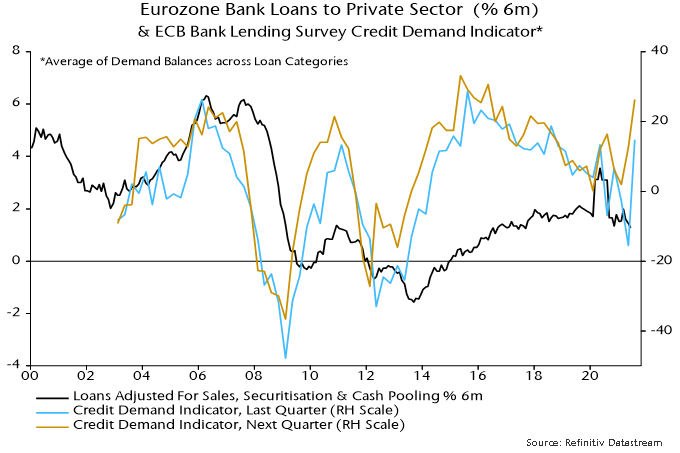
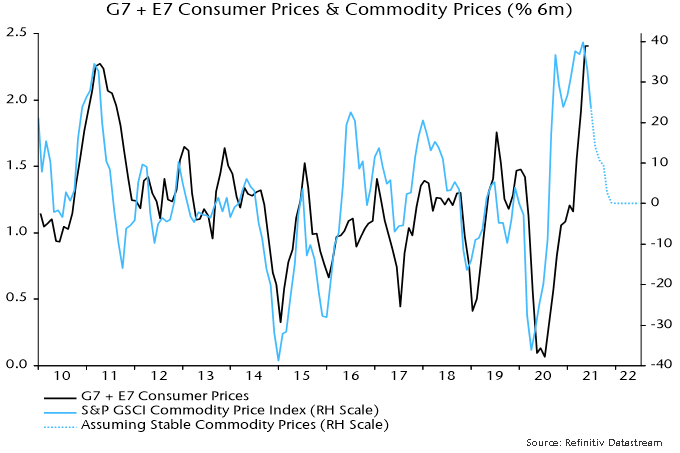
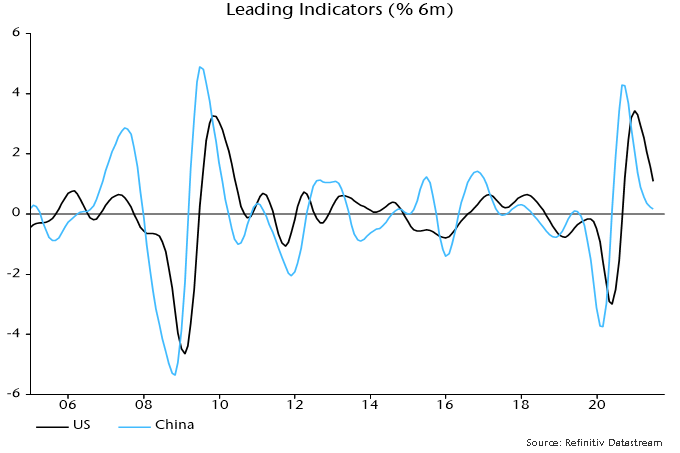
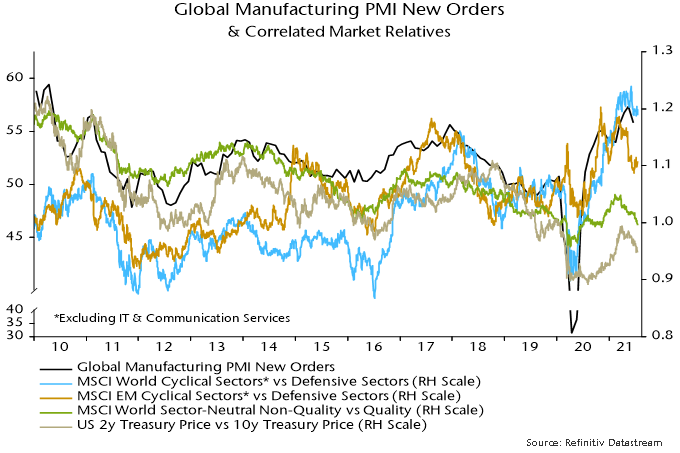
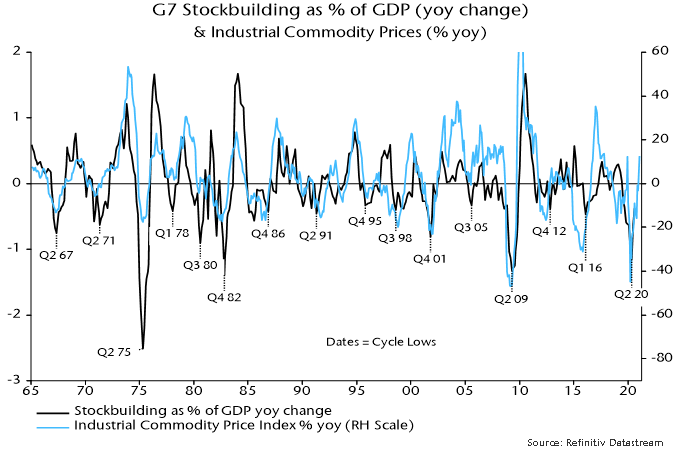
Financial market behaviour is strongly correlated with the stockbuilding cycle in particular. Cycle upswings are usually associated with rising real government bond yields and strong commodity markets – see charts 3 and 4 – as well as low / falling credit spreads and outperformance of cyclical equity sectors. The latter three of these trends, of course, were in place during H2 2020 and may extend during 2021 after a possible Q1 correction. A surprise to the consensus in 2021 could be a rebound in real bond yields, which would challenge current equity market valuations and could favour “value”.
Chart 3
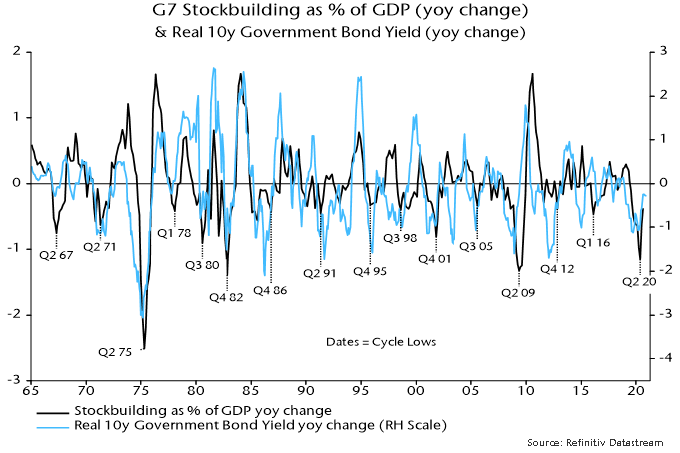
Chart 4
To sum up, monetary data in early 2021 will be important for the strategy assessment here. The current monetary backdrop and possible weaker near-term economic data suggest reducing cyclical exposure relative to H2 2020 but a stabilisation or revival in real money growth would support the positive message from the cycle analysis, arguing for using any setback in cyclical markets to rebuild positions in anticipation of a strong H2.
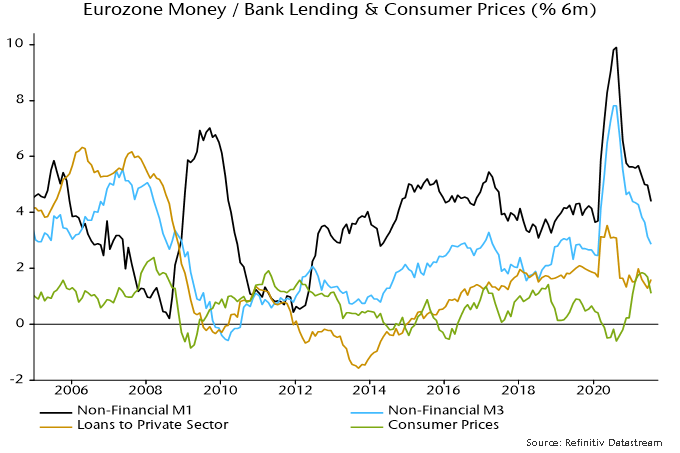
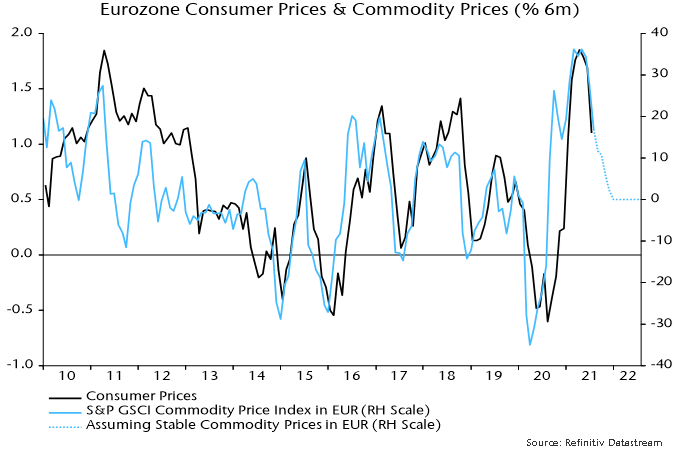
Consumer price inflation rates are widely expected to rise during H1 2021, reflecting recent commodity price strength, a reversal of temporary tax cuts (Germany / UK) or subsidies (Japan), and base effects. The policy-maker and market consensus is that this will represent a temporary “cyclical” move of the sort experienced regularly in recent decades. The suspicion here is that it will prove more lasting and significant, because the monetary backdrop is much more expansionary / inflationary than before those prior run-ups.
Broad rather than narrow money trends are key for assessing medium-term inflation prospects. This is illustrated by Japan’s post-bubble experience: narrow money has grown strongly on occasions but annual broad money expansion never rose above 5% over 1992-2019, averaging just 2.1% – the monetary basis for sustained low inflation / mild deflation. Similarly, G7 annual broad money growth averaged only 3.7% in the post-GFC decade (i.e. 2010-19).
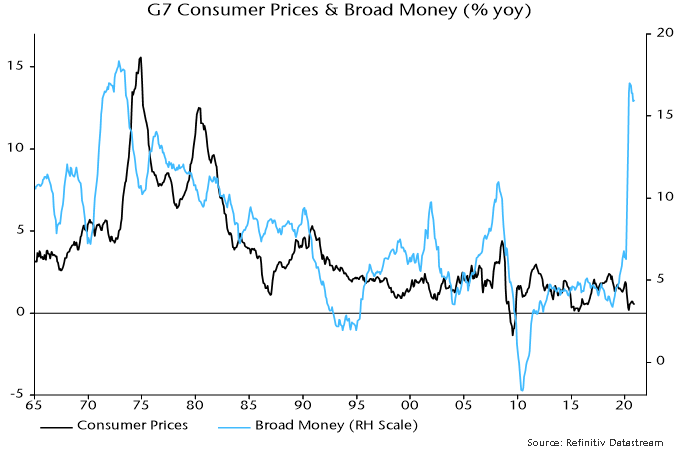
2020 may have marked a transformational break in monetary trends. G7 annual broad money growth peaked at 17.0% in June, the fastest since 1973 – see chart 5. Monthly growth has subsided but there has been no “payback” of the H1 surge. At the very least, this suggests a larger-than-normal “cyclical” upswing in inflation in 2021-22. Ongoing monetary financing of large fiscal deficits may sustain broad money growth at well above its levels of recent decades, embedding the inflation shift.
Chart 5
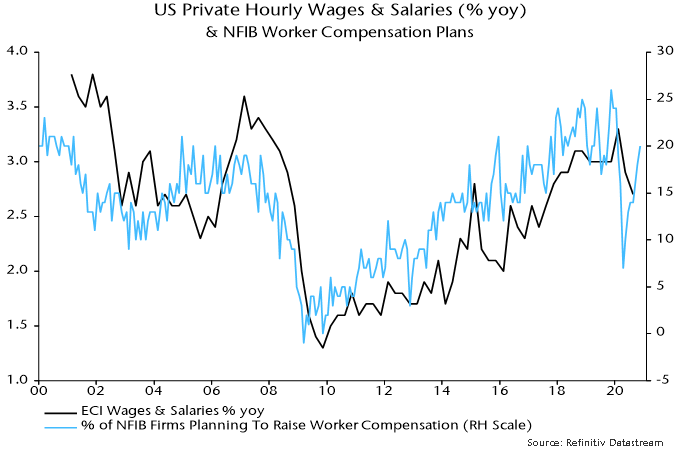
The consensus view that an inflation pick-up will prove temporary rests on weak labour markets bearing down on wage growth. Unemployment rates adjusted for short-time working / furlough schemes, however, fell sharply as the global economy rebounded in H2 2020 and structural rates have probably risen – labour market “slack”, therefore, may be less than widely thought and much lower than after the 2008-09 recession. The slowdown in wages to date has been modest and some business surveys are already hinting at a rebound – see chart 6.
Chart 6
Commentators who take seriously the prospect of a sustained inflation rise often argue that real bond yields would take the strain by moving deeper into negative territory, the view being that central banks will cap nominal yields. Such a scenario would be bullish for risk assets but probably overstates the power of the policy emperors. Pegged official rates and a QE flow currently running at about 10% of the (rapidly rising) outstanding stock of G7 government bonds per annum could prove insufficient to offset selling by existing holders in the event of an unexpected inflation surge.